Received Date:
09 August 2017 Accepted Date:
08 September 2017 Available Online:
01 May 2018
Abstract:
Poly(vinylidene fluoride) (PVDF) exhibits pronounced polymorphs. Its γ phase is attractive due to the electroactive properties. The γ-PVDF is however difficult to obtain under normal crystallization condition. In a previous work, we reported a simple melt-recrystallization approach for producing γ-phase rich PVDF thin films through selective melting and subsequent recrystallization. We reported here another approach for promoting the αγ' phase transition to prepare γ-phase rich PVDF thin films. To this end, a stepwise crystallization and subsequent annealing process was used. The idea is based on a quick generation of a large amount of α-PVDF crystals with some of their γ-PVDF counterparts at suitable crystallization temperature and then annealing at a temperature above the crystallization temperature for enhancing the molecular chain mobility to overcome the energy barrier of phase transition. It was found that crystallizing the PVDF melt first at 152℃ for 4 h, then quenching to room temperature and finally annealing the sample at 160℃ for 100 h was the most efficient to produce γ-PVDF rich films. This is related to the melting and recrystallization of the α-PVDF crystals produced during quenching in the annealing process at 160℃, which favors the formation of γ-PVDF crystals for triggering the αγ' phase transition.
Poly(vinylidene fluoride) (PVDF), acting as a useful ferroelectric material and attracting large interest since 1970s[1-4], exhibits the best piezoelectric and pyroelectric effect among polymers. Its applications in memory technology[1], and as sensor[5], dielectric capacitors[6]etc. have been largely studied.
It is well-known that PVDF can crystallize into five different crystal forms, designated as α, β, γ, σ and ε, depending on the crystallization condition[7]. However, the piezo-and pyro-electricities of PVDF can be achieved only in its β, γ, and δ phases, with the β-and γ-PVDF crystals being electrically the most active[3, 8-11]. Therefore, the preparation of high quality thin films with β or γ phases is of great interest. For the γ-PVDF crystals, it is now clear that the commonly known quiescent melt-crystallization at high temperature, generally above 155 ℃, results in the growth of α and γ crystals simultaneously[12, 13], while only the kinetically favored α form can be produced at relatively low temperatures, e.g. below 150 ℃[14]. Although the content of γ form increases with elevated crystallization temperature, the tremendously dropped growth rates of both α and γ crystals make it unsuitable for preparing high content γ-PVDF films. Another pathway to obtain γ-PVDF crystals is the solid phase transition from thermodynamically less stable α form to a high melting point γ form (referred as to the γ′ form) by annealing at temperatures near the melting point of α form[12, 15]. The α to γ solid phase transition generally occurs at the points where α crystals are in contact with γ crystals, and it involves rearrangement of the molecular chains or the chain segments. This is best revealed by the change from the TGTG' chain conformation of the α form to the T3GT3G′ chain conformation of the γ form and the molecular packing inversion in unit cell[16, 17]. Consequently, there is an energy barrier for solid phase transition, which hinders the occurrence of phase transition at low temperature.
In a previous work, we have reported a simple melt-recrystallization approach, which comprises a selective melting of the non-polar α-PVDF and polar γ-PVDF crystals (but not the stable γ-PVDF crystals) and a subsequent isothermal recrystallization at 160 ℃[18]. During that process, the non-melting stable γ-PVDF crystals initiate the formation of γ-PVDF crystals in the melt on one hand, and on the other hand a direct crystallization of γ-PVDF crystallizes from locally ordered domains survived in the molten α-PVDF crystal regions. In the present work, we report another route for promoting the α to γ solid phase transition. The idea is based on a quick generation of a large amount of α crystals with some of their γ counterparts at suitable crystallization temperature and a subsequent annealing at a temperature above the crystallization temperature for enhancing the molecular chain mobility to overcome the energy barrier of the phase transition. This is found to be a promising approach for producing γ-rich PVDF films.
EXPERIMENTAL
PVDF used in this work was purchased from Sigma-Aldrich with average molecular weight Mw
= 5.34 × 10⁵ estimated by GPC. Samples for polarizing optical microscopy (POM) and infrared spectroscopy (IR) measurements were prepared by solution casting of PVDF (20 mg/mL in N, N-dimethyl formamide) on clean silicon substrates. The thicknesses of the samples estimated by ellipsometer are ca. 60 μm. After totally dried, samples were heated to 200 ℃ for 10 min to remove thermal history and cooled to desired temperature for further thermal treatment as described in detail both in the text and in figure captions. All the thermal treatments of the samples for IR and POM measurements were performed by Linkam THMS600 temperature controller stage. Samples (5.0-8.0 mg) were weighed in an aluminum crucible and followed the same thermal treatment as the samples for POM and IR measurements.
For differential scanning calorimetry (DSC) measurement, a Q-2000 TA Instrumental DSC equipment was used. The sample was heated at a constant rate of 10 K/min from room temperature to 210 ℃ under nitrogen atmosphere. An optical microscope (Axioskop 40A Pol, Carl Zeiss) combined with Linkam THMS600 temperature controller stage was used for POM observation under reflective mode. IR spectra were recorded using Perkin Elmer spectrum 100 with 4 cm-1 resolution by deducting the signal of a blank Si substrate before recording the spectra of the sample signal.
RESULTS AND DISCUSSION
Melt Crystallization of PVDF Isothermally at 160 ℃
Figure 1 displays the in situ melting process of a PVDF sample, which was isothermally crystallized from the melt at 160 ℃ for 100 h and then cooled to room temperature. From Fig. 1(a), it is clear that the isothermal crystallization of PVDF is not complete, leading to coexistence of some big spherulites grown at 160 ℃ and plenty of microcrystallites formed by quenching to room temperature. This is in agreement with the results reported previously and confirms that the growth of PVDF crystals is very slow at 160 ℃[18]. The sparsely dispersed big spherulites in the matrix of microcrystallites indicate a very low nucleation density of PVDF at 160 ℃. The big spherulites are identified to be composed of γ-or α-PVDF crystals by selective melting at different temperature as presented in Figs. 1(b) and 1(c). The relatively small spherulites with strong birefringence belong to the α form PVDF. These α-PVDF crystals melt away completely when the sample was heated to 172 ℃ (Fig. 1b). The melting of the large spherulites with irregular shape and weak birefringence at 179 ℃ (Fig. 1c) showed the characteristics of the γ-PVDF crystals. The size difference of the γ and α-PVDF spherulites (ca. 280 μm versus 120 μm) indicates a faster crystallization rate for γ-PVDF crystals with respect to the α counterparts. It should be pointed out that there are some α spherulites left after complete melting of the γ crystals. These spherulites are connected with the γ spherulites and melt at 182 ℃. They are the results of solid phase transition and belong to the γ′ form.
Figure 1
Figure 1.
Optical micrographs of a PVDF sample recorded during the in situ heating process at (a) room temperature, (b) 172 ℃ and (c) 179 ℃ (The sample was prepared by heating to 200 ℃ for 10 min, crystallizing isothermally at 160 ℃ for 100 h and subsequently quenching to room temperature.)
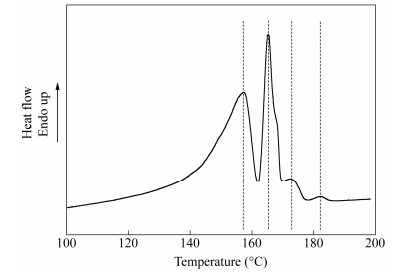
The exact melting temperature of the related crystal was determined by DSC. Figure 2 shows a DSC heating scan of a sample isothermally crystallized at 160 ℃ for 100 h and quenched to room temperature. It is seen from Fig. 2 that the sample exhibits very complicated melting behavior. The broad melting peak at ca. 158 ℃ was attributed to the melting of the α-PVDF microcrystallites produced during quenching. The melting peak at 166 ℃ was assigned to the melting of α-PVDF spherulites grown at 160 ℃. It should be pointed out that a shoulder was observed at around 168 ℃, indicating a double melting behavior of the α-PVDF spherulites. Marega and Marigo[19] suggested that the double melting of α-PVDF crystals was due to the structural defects of the lamellae, which caused melting and recrystallization of the crystalline lamellae. Anyway, the melting of the α-PVDF crystals completed at 170 ℃. The melting peak at 173 ℃ was assigned to the melting of γ-PVDF crystals produced during isothermal crystallization. The appearance of the melting peak at 182 ℃, belonging to the melting of transformed γ′ crystals, indicated the occurrence of the solid phase α to γ transition.
Figure 2
Figure 2.
DSC heating thermagram of a PVDF sample prepared by heating to 200 ℃ for 10 min, crystallized isothermally at 160 ℃ for 100 h and subsequently quenched to room temperature
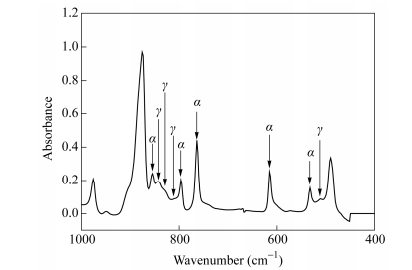
The coexistence of γ and α-PVDF crystals after isothermal crystallization at 160 ℃ for 100 h followed by cooling to room temperature is also confirmed by FTIR analysis. Figure 3 shows the spectrum of the sample prepared exactly in the same way as that shown in Figs. 1 and 2. The characteristic absorption bands of α-PVDF were seen at 532, 614, 763, 795 and 855 cm-1, while those corresponding to the γ-PVDF appeared at 512, 812, 833 and 840 cm-1[20].
Figure 3
Figure 3.
FTIR spectrum of a PVDF sample prepared by heating to 200 ℃ for 10 min, isothermally crystallized at 160 ℃ for 100 h and subsequently quenched to room temperature
Stepwise Crystallization and Annealing of PVDF at Different Temperatures
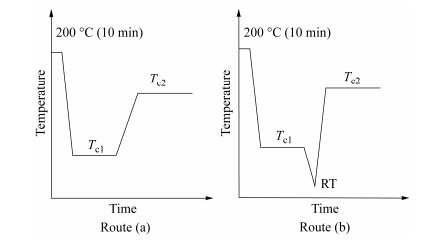
The above experimental results show that the amounts of γ and γ′-PVDF crystals were very low when PVDF was simply crystallized from melt at 160 ℃. To prepare thin films with rich γ or γ′-PVDF crystals, two different experimental procedures were used, as shown in Fig. 4.
Figure 4
Figure 4.
Two different routes for sample preparation used in the following sections
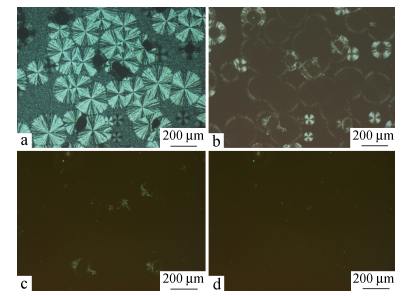
Figure 5(a) shows the POM picture of a sample prepared through route (a) via isothermal crystallization at 152 ℃ and 160 ℃ for 4 and 100 h, respectively, followed by subsequent quenching to room temperature. It is seen that the isothermal crystallization first at 152 ℃ for 4 h plus another step at 160 ℃ for 100 h resulted in the formation of bigger spherulites in comparison with those shown in Fig. 1(a). Nevertheless, the crystallization was still not complete, leading to the formation of abundant microcrystallites after the sample quenching to room temperature. It was confirmed that the big spherulites with strong birefringence belonged to the α form PVDF and the relatively small ones with weak birefringence were composed of γ-PVDF crystals. The size inversion of the α- and γ-PVDF spherulites indicates a quicker crystallization of α-PVDF compared to the γ-PVDF at 152 ℃. This agrees well with the reported results[12, 13]. After melting of the α-PVDF crystals formed at 152 ℃, stepwise crystallization owing to the temperature jump was clearly identified, as shown in Fig. 5(b). While the radius of α-PVDF spherulites prepared at 152 ℃ with 4 h of crystallization was ca. 100 mm, this radius increased only about 20 μm after the subsequent crystallization at 160 ℃ for 100 h. This demonstrated that the α-PVDF crystals grew extremely slow at 160 ℃. Further melting of the γ-PVDF crystals disclosed the phase transition phenomenon. As shown in Fig. 5(c), there were still a certain amount of the transformed γ′-PVDF crystals. Since these γ′-PVDF crystals were transformed from the α-PVDF crystals grown at 152 ℃, they exhibited a relatively low melting temperature than those shown in Fig. 1, and the complete melting was achieved at 181 ℃ (see Fig. 5d). It is noted that the size of the transformed γ′-PVDF crystals shown in Fig. 5(c) was somewhat larger than that shown in Fig. 1(c). This may imply that the α-PVDF crystals formed at 152 ℃ transformed more easily into the γ′-PVDF crystals than those formed at 160 ℃, which may indicate a lower thermal stability for the α-PVDF crystals produced at a lower temperature.
Figure 5
Figure 5.
POM micrographs taken at (a) room temperature, (b) 168 ℃, (c) 177 ℃ and (d) 181 ℃ (Sample was prepared by the route (a) shown in Fig. 4 with Tc1 = 152 ℃ and Tc2 = 160 ℃; tc1 = 4 h and tc2 = 100 h.)
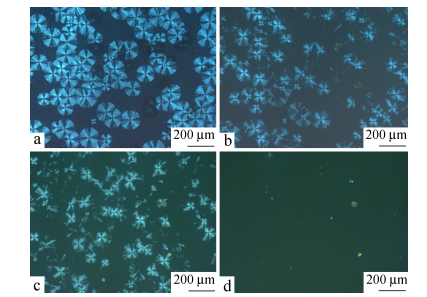
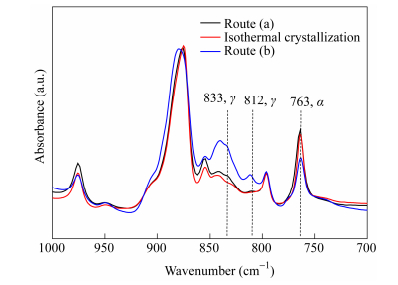
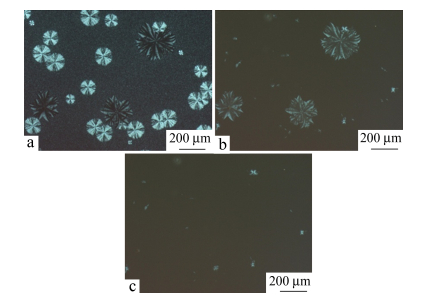
Following the route (b) shown in Fig. 4, another sample was prepared by first crystallizing isothermally at 152 ℃ for 4 h, quenching to room temperature with final annealing at 160 ℃ for 100 h. Figure 6 shows POM images of the sample taken during the melting process. Comparing Fig. 6(a) with Fig. 5(a), the crystals were clearly observed after the first step crystallization at 152 ℃ for 4 h. After melting of the α-PVDF crystals at 170 ℃ (Fig. 6b), a large amount of PVDF crystals remained unchanged. Even after the melting at 176 ℃, plenty of PVDF crystals were still present (Fig. 6c), which were melted completely at 180 ℃ (Fig. 6d). This indicates that a large amount of α-PVDF crystals were transformed into the γ′ form. FTIR experiments further confirmed the occurrence of phase transition, as shown in Fig. 7. For a direct comparison, the FTIR spectra of the samples, isothermally crystallized from the melt at 160 ℃ for 100 h, quenched to room temperature and prepared via route (a), are also presented in Fig. 7. The spectra for all the samples were processed by baseline correction and the 875 cm-1 band of C―C stretching of PVDF was used as the internal standard reference[21]. From Fig. 7, it is clear that the sample prepared by route (b) exhibited a much larger amount of γ form PVDF crystals (including directly formed γ and transformed γ′ crystals) than the other two samples, indicating a much easier transition for the α-PVDF crystals into their γ′ counterparts.
Figure 6
Figure 6.
Optical micrographs taken at (a) room temperature, (b) 170 ℃, (c) 176 ℃ and (d) 180 ℃ during heating (The sample was prepared via route (b) as shown in Fig. 4 with Tc1 = 152 ℃, Tc2 = 160 ℃, tc1 = 4 h and tc2 = 100 h.)
Figure 7.
FTIR spectra of the samples prepared by isothermal crystallization at 160 ℃ for 100 h (red), via route (a) (black) and route (b) (blue) with Tc1 = 152 ℃, tc1 = 4 h and Tc2 = 160 ℃, tc2 = 100 h (All of the spectra were recorded at room temperature.)
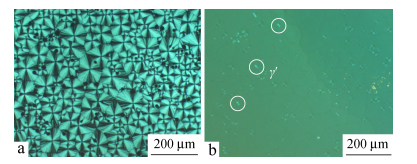
The above result seems hard to be understood at first glance when the occurrence of phase transition is believed usually at the αγ interface. It can be actually explained in the following way. A recent study performed by Men et al.[22] showed that the polymorph selection of polymers was dependent strongly on the melting status of the previous crystals. It was also demonstrated that the structural evolution of polymers in different domains was different[23]. In the present case, the sample prepared by isothermal crystallization first at 152 ℃ and quenched to room temperature was believed to have both big spherulites and microcrystallites of α form PVDF. These crystals would exhibit different melting points (Fig. 2). By annealing at 160 ℃, the melting and recrystallization of the α-PVDF microcrystallites formed during quenching took place. Our previous work[18] showed that the locally ordered domains owing to incomplete melting were more easy to adjust their chain conformation to recrystallize into the γ form than the chains in the solid state. Besides, the temperature for annealing was high enough to overcome the energy barrier required for the chain conformation change. In this case, abundant γ-PVDF crystals surrounding the non-molten big α-PVDF spherulites are expected. It is these γ-PVDF microcrystallites that initiated the αγ′ phase transition. On the other hand, for the sample prepared by isothermal crystallization first at 152 ℃ for 4 h and at 160 ℃ for 100 h, the surrounding of the formed PVDF spherulites was still in the molten state. Therefore, only those spherulites in contact with the sparsely dispersed γ-PVDF crystals would achieve the transformation, limiting the formation of γ-PVDF crystals. This demonstrates the importance of insufficient melting and subsequent recrystallization with regard to the αγ phase transition of PVDF, which is also supported by lowering the crystallization temperature of the first step. As presented in Fig. 8(a), when the sample was prepared by isothermal crystallization first at 145 ℃ for 4 h, a complete crystallization of PVDF in its α form was achieved. In this case, only a small amount of the α-PVDF crystal was transformed into the γ′ form during the subsequent annealing process at 160 ℃ for 100 h, as judged by melting at 173 ℃ (see Fig. 8b). Furthermore, it is found with a close inspection that the transition from α phase to the γ′ phase took place mainly from the center of the α-PVDF spherulites as indicated by the dash circle in Fig. 8(b).
Figure 8
Figure 8.
Optical micrographs taken at (a) room temperature and (b) 173 ℃ (Sample was prepared through route (b) as shown in Fig. 4 with Tc1 = 145 ℃ (tc1 = 1 h), cooled to room temperature and annealed at Tc2 = 160 ℃ (tc2 = 100 h). The circles indicate γ′ form transformed from α form.)
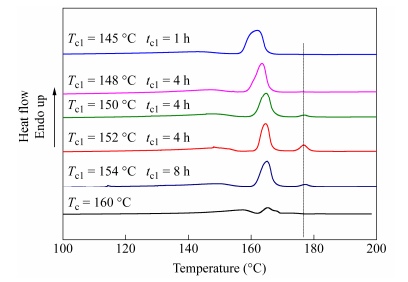
It was further found that the crystallization temperature and time in the first step in the route (b) also imposed remarkable influence on the αγ′ phase transition of PVDF. Figure 9 shows the DSC heating scans of the PVDF samples prepared through route (b) with different crystallization temperature Tc1 and crystallization time tc1. The annealing step was performed at the same temperature Tc2 (160 ℃) for a same period of time of 100 h. For comparison, the DSC scan of the sample isothermally crystallized at 160 ℃ for 100 h is also included in Fig. 9. It is clearly seen that all of the samples prepared by route (b) had a much higher crystallinity than those prepared by isothermal crystallization at 160 ℃ for 100 h. The content of the γ′-PVDF crystals first increased and then dropped down with increasing crystallization temperature. This is reasonable when different crystallization status of the PVDF in the first step was taken into account. For the samples crystallized at low temperature, e.g., below 150 ℃, full crystallization of the PVDF in its α form was realized. Consequently, cooling the sample to room temperature and subsequent annealing at 160 ℃ did not show obvious structural change for PVDF except for an increment of crystallinity. For the sample crystallized first at 150 ℃ for 4 h, a small part of the PVDF remained in the molten state and crystallized during quenching to room temperature. This part of the PVDF crystals underwent a melting and a recrystallization when annealed at 160 ℃, which generated some γ-PVDF microcrystals and initiated the αγ′ phase transition. For a quantitative comparison, the relative amount of transformed γ′-PVDF crystals was revealed simply by the fraction of the enthalpy of γ′ form over the totally enthalpy including all detected crystals. It was found that the fraction of the γ′-PVDF crystals was about 16.61% in the sample first crystalized at 152 ℃. On the other hand, the samples first crystallized at 150 and 154 ℃ exhibited only about 3.70% and 6.62% γ′-PVDF crystals, respectively. This clearly shows that the content of the γ′-PVDF crystals closely depended on the content of the PVDF crystals grown during quenching, which increased with increasing crystallization temperature in the first step. After Tc1 reached 154 ℃, even though more PVDF crystals were generated during quenching, the less amount of α-PVDF crystals formed at the first step would also result in a decrease in the transformed γ′-PVDF crystals. As a consequence, crystallizing PVDF from isotropic melt, first at 152 ℃ for 4 h, followed by a quenching to room temperature and finally annealing at 160 ℃ for 100 h, seemed to be the best condition for promoting the αγ′ phase transition of the PVDF with molecular weight of 5.34 × 10⁵.
Figure 9
Figure 9.
DSC heating curves of PVDF prepared by isothermal crystallization at 160 ℃ for 100 h and prepared by route (b) as shown in Fig. 4 with different Tc1 and the same annealing Tc2 (160 ℃) for 100 h
Polymorphic behavior and related phase transition of PVDF during stepwise crystallization and subsequent annealing were studied by optical microscopy, infrared spectroscopy and DSC. It was found that only quite a small amount of γ-and γ′-PVDF can be produced by crystallizing the PVDF from the melt isothermally at 160 ℃ for 100 h, even though γ-PVDF crystallization is preferred at this temperature. This is related to the extremely slow crystallization rates for both α-and γ-PVDF crystals, and the αγ′ phase transition is limited since it takes place most likely at the interface of the α-and γ-PVDF crystals. During stepwise crystallization, if the sample was crystallized first at a low temperature, e.g., 152 ℃, and then at 160 ℃, finitude interface of the α-and γ-PVDF crystals also restricts the αγ′ phase transition. However, when quenching the sample to room temperature after the first crystallization at temperatures around 152 ℃ followed by annealing at 160 ℃, the αγ′ phase transition is promoted significantly. This is related to the fact that melting and recrystallization of the α-PVDF microcrystallites formed during quenching take place in the annealing step at 160 ℃. The melt recrystallization of the PVDF microcrystallites at 160 ℃ favors the formation of γ-PVDF crystals surrounding the α-PVDF crystals formed in the isothermal crystallization. It is those γ-PVDF crystals in contact with the isothermally crystallized α-PVDF crystals that initiate the αγ′ phase transition, leading to formation of abundant γ′-PVDF crystals.
[1]
Ling Q. D., Liaw D. J., Zhu C., Chan D. S. H., Kang E. T., Neoh K. G.. Polymer electronic memories:materials, devices and mechanisms[J]. Prog. Polym. Sci.,
2008, 33(10):
917-978.
doi: 10.1016/j.progpolymsci.2008.08.001
[2]
Doll W. W., Lando J. B.. The polymorphism of poly(vinylidene fluoride) Ⅳ. The structure of high-pressure-crystallized poly(vinylidene fluoride)[J]. J. Macromol. Sci. B,
1970, 4(4):
889-896.
doi: 10.1080/00222347008217130
[3]
Lovinger, A. J., in "Developments in Crystalline Polymers, Vol. 1", ed. by Bassett, D. C. Springer, Netherlands, 1982, p. 195
Chen Z., Kwon K. Y., Tan X.. Integrated IPMC/PVDF sensory actuator and its validation in feedback control[J]. Sensor Actuat. A-Phys.,
2008, 144(2):
231-241.
doi: 10.1016/j.sna.2008.01.023
[6]
Chu B., Zhou X., Ren K., Neese B., Lin M., Wang Q., Bauer F., Zhang Q. M.. A dielectric polymer with high electric energy density and fast discharge speed[J]. Science,
2006, 313(5785):
334-336.
doi: 10.1126/science.1127798
[7]
Lovinger A. J.. Annealing of poly(vinylidene fluoride) and formation of a fifth phase[J]. Macromolecules,
1982, 15(1):
40-44.
doi: 10.1021/ma00229a008
[8]
Li M., Wondergem H. J., Spijkamn M. J., Asadi K., Katsouras I., Blom P. W. M.. Revisiting the δ-phase of poly(vinylidene fluoride) for solution-processed ferroelectric thin films[J]. Nat. Mater.,
2013, 12(5):
433-438.
doi: 10.1038/nmat3577
[9]
Kang S. J., Park Y. J., Bae I., Kim K. J., Kim H. C., Bauer S., Thomas E. L., Park C.. Printable ferroelectric PVDF/PMMA blend films with ultralow roughness for low voltage non-volatile polymer memory[J]. Adv. Funct. Mater.,
2009, 19(17):
2812-2818.
doi: 10.1002/adfm.v19:17
[10]
Kang S. J., Park Y. J., Hwang J. Y., Jeong H. J., Lee J. S., Kim K. J., Kim H. C., Huh J., Park C.. Localized pressure-induced ferroelectric pattern arrays of semicrystalline poly(vinylidene fluoride) by microimprinting[J]. Adv. Mater.,
2007, 19(4):
581-586.
doi: 10.1002/(ISSN)1521-4095
[11]
Kang S. J., Bae I., Choi J. H., Park Y. J., Jo P. S., Kim Y., Kim K. J., Myoung J. M., Kim E., Park C.. Fabrication of micropatterned ferroelectric gamma poly(vinylidene fluoride) film for non-volatile polymer memory[J]. J. Mater. Chem.,
2011, 21(11):
3619-3624.
doi: 10.1039/c0jm02732d
[12]
Lovinger A. J.. Crystalline transformations in spherulites of poly(vinylidene fluoride)[J]. Polymer,
1980, 21(11):
1317-1322.
doi: 10.1016/0032-3861(80)90200-1
[13]
Lovinger A. J.. Crystallization and morphology of melt-solidified poly(vinylidene fluoride)[J]. J. Polym. Sci. Polym. Phys. Ed.,
1980, 18(4):
793-809.
doi: 10.1002/pol.1980.180180412
[14]
Tashiro K., Kobayahsi M.. Structural phase transition in ferroelectric fluorine polymers:X-ray diffraction and infrared/Raman spectroscopic study[J]. Phase Transit.,
1989, 18(3-4):
213-246.
doi: 10.1080/01411598908206864
[15]
Gregorio R., CapitãO R. C.. Morphology and phase transition of high melt temperature crystallized poly(vinylidene fluoride)[J]. J. Mater. Sci.,
2000, 35(2):
299-306.
doi: 10.1023/A:1004737000016
[16]
Lovinger A. J.. Conformational defects and associated molecular motions in crystalline poly(vinylidene fluoride)[J]. J. Appl. Phys.,
1981, 52(10):
5934-5938.
doi: 10.1063/1.328522
[17]
Takahashi Y., Matsubara Y., Tadokoro H.. Mechanisms for crystal phase transformations by heat treatment and molecular motion in poly(vinylidene fluoride)[J]. Macromolecules,
1982, 15(2):
334-338.
doi: 10.1021/ma00230a026
[18]
Zheng Y., Zhang J., Sun X., Li H., Ren Z., Yan S.. Crystal structure regulation of ferroelectric poly(vinylidene fluoride) via controlled melt-recrystallization[J]. Ind. Eng. Chem. Res.,
2017, 56(15):
4580-4587.
doi: 10.1021/acs.iecr.7b00543
[19]
Meraga C., Marigo A.. Influence of annealing and chain defects on the melting behavior of poly(vinylidene fluoride)[J]. Eur. Polym. J.,
2003, 39(8):
1713-1720.
doi: 10.1016/S0014-3057(03)00062-4
[20]
Martins P., Lopes A. C., Lanceros-Mendez S.. Electroactive phases of poly(vinylidene fluoride):determination, processing and applications[J]. Prog. Polym. Sci.,
2014, 39(4):
683-706.
doi: 10.1016/j.progpolymsci.2013.07.006
[21]
Tashiro K., Kobayashi M., Tadokoro H.. Vibrational spectra and disorder-order transition of poly(vinylidene fluoride) form Ⅲ[J]. Macromolecules,
1981, 14(6):
1757-1764.
doi: 10.1021/ma50007a028
[22]
Wang Y. T., Liu P. R., Lu Y., Men Y. F.. Mechanism of polymorph selection during crystallization of random butene-1/ethylene copolymer[J]. Chinese J. Polym. Sci.,
2016, 34(8):
1014-1020.
doi: 10.1007/s10118-016-1802-8
[23]
Hu D. D., Ye S. B., Yu F., Feng J. C.. Further understanding on the three domains of isotactic polypropylene by investigating the crystalline morphologies evolution after treatment at different domains[J]. Chinese J. Polym. Sci.,
2016, 34(3):
344-358.
doi: 10.1007/s10118-016-1745-0

 DownLoad: