Citation:
Ma Xiuzhen, Hu Bin. Volumetric Properties of Aqueous Li2SO4-Na2SO4-H2O and Li2SO4-K2SO4-H2O Solutions[J]. Chemistry,
2018, 81(10): 939-943, 938.
Key Laboratory of Comprehensive and Highly Efficient Utilization of Salt Lake Resources, Qinghai Institute of Salt Lakes, Chinese Academy of Sciences; Key Laboratory of Salt Lake Resources Chemistry of Qinghai Province, Xining 81008
Received Date:
25 May 2018 Accepted Date:
30 July 2018 Available Online:
18 October 2018
Abstract:
Densities of two aqueous ternary systems Li2SO4-Na2SO4-H2O, The experimental study of these systems were carried out for four total ionic strengths ranging from 0.1 to 4.5 mol·kg-1. For each total ionic strength, the values of the ionic strength fraction of the Na2SO4 and K2SO4 were y2≈0.2, 0.4, 0.6, and 0.8. The Pitzer mixing parameters θV and ψV for the ternary systems were fit for the experimental density values. Also, using the Pitzer model, we determined the volume of mixing at constant ionic strength at 298.15 K, for each ternary system that have been studied.
Salt lakes are widely distributed in the Qinghai-Tibet plateau and abundant in high concentration of lithium, potassium and boron. The composition of salt lake brine can be represented as Li+-Na+-K+-Mg2+-Cl--SO42--B2O3-H2O system. Knowledge of the volumetric characteristics, such as density, volume of mixing, has a guiding role in salt lake brine evaporation process control and solar pond design[1]. Such data also provide valuable insight into the interaction behavior of mixed electrolyte solutions. To the best of our knowledge, volumetric properties for aqueous ternary subsystems of complex salt lake brine are not available due to the scarcity of reliable density data. Oscillating U-tube densimeter was employed in densities determination of Li2SO4-Na2SO4-H2O and Li2SO4-K2SO4-H2O by Guo et al and Bu et al respectively[2, 3]. But the main purposes of the above-mentioned publications focused on phase equilibrium research. Volumetric properties were not conducted in these publications.
In this study, the densities of aqueous solutions of Li2SO4-Na2SO4-H2O, Li2SO4-K2SO4-H2O over the temperature range 288 ≤ T/K ≤ 318 were determined with high precision vibrating-tube densimetry. The experimental densities were correlated with the Pitzer thermodynamic model. The volume of mixing at constant ionic strength and at 298.15 K for each of the ternary systems was calculated.
1.
Experimental
1.1
Reagents
All reagents (purchased from Aladdin Co.) were of analytical reagent grade and used directly without further purification (lithium sulfate 99.9%, sodium sulfate ≥99.0%, potassium sulfate 99.99%). The stock solutions were prepared by dissolving solutes in distilled deionized water, respectively. The molalities of the sulfate stock solutions were determined gravimetrically by precipitation of sulfate as BaSO4(s). Stock solution molality determinations were done with 5 replicate samples and reproducible to ≤0.08%. The tested ternary aqueous solutions were prepared by using an analytical balance with a precision of ±0.1mg, the two stock solutions and the water were weighed in appropriate proportions according to the desired concentrations using mass burettes.
1.2
Density Determination
Densities were measured using an Anton Paar (Austria) vibrating-tube densitometer (DMA 5000) following the experimental protocol described in detail previously[4]. Temperatures were controlled to ±0.002K at the intervals of 288≤T/K≤318. The densitometer was calibrated with laboratory air and high purity degassed water at 293K before measure-ment. Following the calibration, densities of water and target solutions were measured. The reprod-ucibility of the densities were always within the range ±(2~10) μg·cm-3.
2.
Methods
The density of a mixture of aqueous electrolytes is expressed as:
where mi and Mi are the molality and the molecular weight of the electrolyte i in the mixture, respectively. ${\bar V_i^0}$ is the apparent molar volume of electrolyte i at infinite dilution. ρ0 is the water density. Vex represents the excess volume of the mixture. Vex is determined with the Pitzer model, whose general equation is:
where the symbols have the usual meanings[5]. Theoretical Debye-Hückel slope (AV) used in the fit was obtained using the equations developed by Krumgalz[6].
The volume of mixing at constant ionic strength is defined as the difference between the excess of the mixture volume and the sum of the excess volume of the pure-electrolyte components.
where y2 is the ionic strength fraction of Na2SO4 or K2SO4 in the ternary systems and is defined by y2=I2/(I1+I2).
3.
Results and Discussion
Experimental density data of ternary systems Li2SO4-Na2SO4-H2O and Li2SO4-K2SO4-H2O are summarized in Tab. 1. I represents the total ionic strength, and m2 represents the molality of the second electrolyte Na2SO4 or K2SO4 in ternary systems. Solution densities, ρ, are based on the water densities, ρw, at the target temperatures. The standard densities of water were calculated from the polynomial proposed by Kell[7]. The measured quantity Δρ=ρ-ρw is independent of the model representing ρw. From the data in Tab. 1, the solution densities can be trivially calculated.
Table 1.
Results of experimental measurements of density differences Δρ of Li2SO4-Na2SO4-H2O, Li2SO4-K2SO4-H2O systems with respect to pure water at temperatures Ta
a Standard uncertainties u are u(T)=0.002K, u(p)=1kPa, u(Δρ)=0.005kg·m-3, u(m)=0.0007 for Li2SO4, u(m)=0.0008 for Na2SO4 and u(m)=0.0006 for K2SO4.
For values that have constant ion strength I, the densities of the two ternary systems decrease as the temperatures increase. It can be ascribed to the expansion of the volume of the solution, which is due to the increase of the temperature of the system. It is clear that for constant I and temperature the densities of both ternary systems increase with the increase of y2, which tends to reach the value of density of the second electrolyte (y2=1). This behavior occurs while the density value of the Na2SO4-H2O or K2SO4-H2O system is higher than that of the Li2SO4-H2O system within the concentration interval evaluated this work.
Experimental data in Tab. 1 were correlated using equation (2), for which the excess molar volumes of ternary systems were derived from equation (1). The volumetric ion interaction parameters (VMX0, βMX(0)V, βMX(1)V, CMXV) at different temperatures for single electrolytes were listed in Table 2. The parameters of Na2SO4, K2SO4 obtained from polynomial proposed by Krumgalz et al[6]. The parameters of Li2SO4 were cited from our previously published paper[8].These parameters were used in the correlation of the two ternary systems.
Table 2
表 2
不同温度下的Pitzer体积参数
Table 2.
Volumetric Pitzer parameters at different temperatures
The mixing parameters θLiNaV, θLiKV, ψLiNaSO4V, ψLiKSO4V for the ternary systems can be calculated from experimental densities listed in Tab. 1 by using Least-Squares method. The values of Pitzer mixing parameters and the standard deviation of the two ternary systems were correlated and listed in Tab. 3.
Table 3
表 3
不同温度下的Pitzer混合参数
Table 3.
Mixing parameters at different temperatures
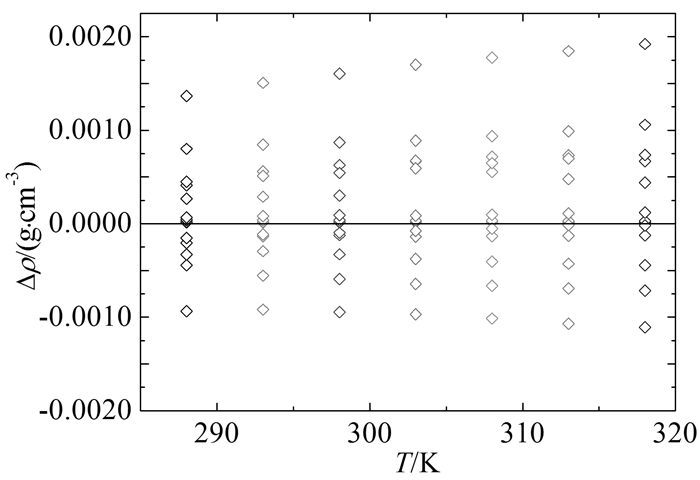
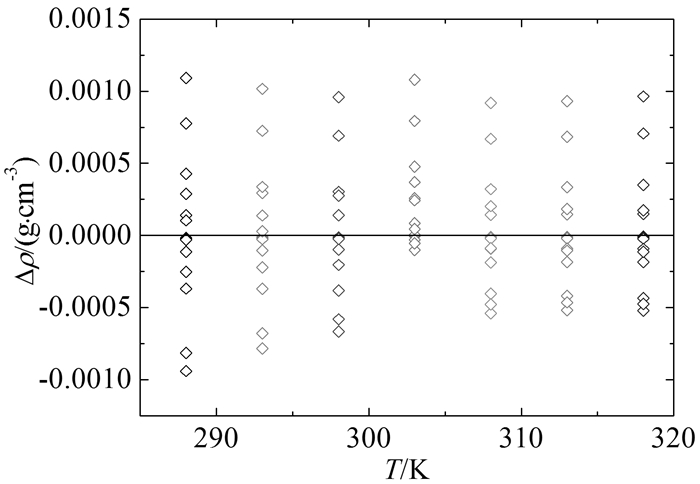
In this table, SD1 and SD2 are the standard deviations of the systems Li2SO4-Na2SO4-H2O and Li2SO4-K2SO4-H2O respectively. In general, the quality of the fit is better when the mixing parameters are considered (option 1) than not considered ones at all (option 2). The abilities of the Pitzer model to fit the data over wide ranges of concentrations and temperatures are illustrated as deviation plots in Fig. 1 and Fig. 2. Maximum deviations between the experimental density data and those calculated from Pitzer model using the parameters in Tab. 1 and Tab. 2 were always ≤ ±0.002 (for Li2SO4-Na2SO4-H2O system) or ≤ ±0.0015 (for Li2SO4-K2SO4-H2O system).
Figure 1
图 1.
Li2SO4-Na2SO4-H2O体系密度计算值与实验值偏差
Figure 1.
Density deviations of Pitzer model from experimental data of the Li2SO4-Na2SO4-H2O system
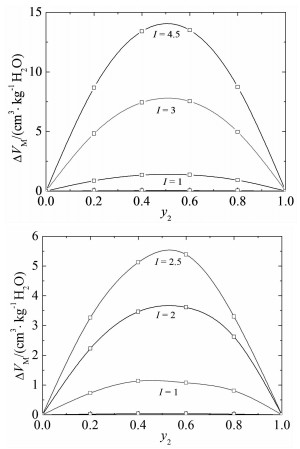
Values of volume of mixing at 298 K for the ternary systems were obtained by using eq.(2) and eq.(5). Fig. 3 shows the values of ΔVM versus y2 for the systems Li2SO4-Na2SO4-H2O, Li2SO4-K2SO4-H2O respectively. Open symbols are calculated values of volume of mixing and different curves correspond to different I (total ionic strength) values in each figure. It is clear that the values of volume of the mixing are obviously positive over the entire interval of y2 for the two ternary systems. Also, the values of ΔVM become more positive as I increase.
The positive ΔVM value indicates that the excess volume of mixtures is greater than the two binary mixtures before mixing. This indicates that the final ternary mixture reaches a less-compact configuration, leading to a greater volume of the system. The presence of the two electrolytes probably does not greatly disturb the water structure because an overall decrease in the structure of water implies a breakage of hydrogen bonds, which contributes to a decrease in volume[9]. According to Desnoyers et al[10], mixing two solutes with the different ability to orient water molecules (one is a structure maker and the other is a structure breaker)would result in an attraction with an increase in volume.
4.
Conclusions
This work provides reliable experimental data of volumetric properties of mixed aqueous Li2SO4- Na2SO4-H2O and Li2SO4-K2SO4-H2O solutions. This information is important in the design and control of brine evaporation processes. The data obtained for wide ranges of temperatures were used for parameterization of Pitzer mixing model that describes the volumetric properties of multi-component solutions. The values of volume of mixing (ΔVM) at 298 K were obtained, which indicates that the two binary solutes possess an opposite ability for orientating water molecular resulting in the increase of volume after mixing.
[1]
S Wang. J. Salt Lake Res., 2000, 8(4):44~49.
[2]
Y Guo, Y Liu, Q Wang. J. Chem. Eng. Data, 2011, 56(9):3585~3588. doi: 10.1021/je200429a
[3]
B Bu, L Li. N Zhang. Fluid Phase Equilibria, 2015, 402(18):78~82.
[4]
B Hu, L Hneědkovský, W Li et al. J. Chem. Eng. Data, 2016, 61(4):1388~1394. doi: 10.1021/acs.jced.5b00535
[5]
B Krumgalz, R Pogorelskii, K Pitzer. J. Solution Chem., 1995, 24(10):1025~1038. doi: 10.1007/BF00973519
[6]
B Krumgalz, R Pogorelskii, A Sokolov et al. J. Phys. Chem. Ref. Data, 2000, 29(5):1123~1140. doi: 10.1063/1.1321053
Table 1.
Results of experimental measurements of density differences Δρ of Li2SO4-Na2SO4-H2O, Li2SO4-K2SO4-H2O systems with respect to pure water at temperatures Ta
I/ (mol·kg-1)
m2 / (mol·kg-1)
y2
288K Δρ/ (kg·m-3)
293K Δρ/ (kg·m-3)
298K Δρ/ (kg·m-3)
303K Δρ/ (kg·m-3)
308K Δρ/ (kg·m-3)
313K Δρ/ (kg·m-3)
318K Δρ/ (kg·m-3)
Li2SO4+ Na2SO4 + H2O
0.1002
0.0069
0.2064
3.459
3.430
3.405
3.386
3.371
3.361
3.355
0.0999
0.0131
0.3931
3.653
3.622
3.593
3.569
3.552
3.538
3.525
0.1005
0.0203
0.6059
3.896
3.874
3.840
3.811
3.789
3.771
3.757
0.1008
0.0266
0.7924
4.116
4.073
4.034
4.002
3.975
3.955
3.936
0.9993
0.0666
0.1998
32.944
32.678
32.465
31.932
31.932
31.929
31.915
1.0020
0.1337
0.4004
35.220
34.912
34.652
34.441
34.270
34.136
34.034
0.9987
0.1998
0.6002
36.831
36.339
35.968
35.662
35.418
35.243
35.181
0.9993
0.2665
0.8000
38.973
38.513
38.130
37.780
37.483
37.236
37.043
2.9973
0.1997
0.1999
93.094
92.545
92.086
91.706
91.405
91.168
90.982
2.9985
0.4000
0.4002
99.094
98.403
97.814
97.323
96.922
96.598
96.341
3.0003
0.5999
0.5998
104.929
104.293
103.625
103.046
102.556
102.151
101.815
2.9997
0.8001
0.8002
110.969
110.047
109.258
108.579
108.000
107.507
107.089
4.4997
0.3000
0.2000
134.613
133.854
133.239
132.749
132.368
132.081
131.876
4.4994
0.5999
0.4000
142.990
142.127
141.387
140.764
140.232
139.764
139.434
4.5006
0.9001
0.6000
151.632
150.595
149.708
148.957
148.324
147.794
147.356
4.4988
1.2000
0.8002
159.250
158.084
157.076
156.203
155.451
154.808
154.258
Li2SO4 + K2SO4 + H2O
0.0990
0.0066
0.2008
3.505
3.473
3.451
3.432
3.419
3.411
3.403
0.1008
0.0133
0.3969
3.869
3.835
3.807
3.785
3.769
3.756
3.747
0.0987
0.0198
0.6015
4.107
4.069
4.038
4.013
3.993
3.977
3.966
0.0981
0.0266
0.8141
4.391
4.350
4.315
4.285
4.264
4.245
4.230
0.9993
0.0665
0.1997
33.772
33.521
33.319
33.158
33.037
32.944
32.880
0.9999
0.1334
0.4002
36.699
36.421
36.187
35.997
35.846
35.727
35.637
0.9633
0.2009
0.6258
38.602
38.296
38.036
37.819
37.641
37.497
37.382
0.9999
0.2667
0.8002
42.521
42.167
41.870
41.619
41.411
41.237
41.096
1.9992
0.1334
0.2002
65.480
65.044
64.691
64.411
64.197
64.036
63.925
1.9998
0.2666
0.4000
70.886
70.416
70.011
69.678
69.415
69.211
69.054
1.9992
0.4002
0.6005
76.634
76.088
75.630
75.245
74.929
74.673
74.468
1.9998
0.5334
0.8001
82.065
81.462
80.943
80.506
80.141
79.835
79.584
2.5002
0.1666
0.1999
80.554
80.041
79.632
79.308
79.058
78.873
78.742
2.5005
0.3333
0.3998
87.480
86.922
86.450
86.064
85.755
85.513
85.329
2.4999
0.5003
0.6004
94.105
93.468
92.928
92.479
92.110
91.808
91.568
a Standard uncertainties u are u(T)=0.002K, u(p)=1kPa, u(Δρ)=0.005kg·m-3, u(m)=0.0007 for Li2SO4, u(m)=0.0008 for Na2SO4 and u(m)=0.0006 for K2SO4.

 下载:
下载:

 下载:
下载:


