

表 1
Composition of the prepared catalysts
Table 1.
Composition of the prepared catalysts


Converting the natural gas to syngas (a mixture of CO and H2) has gain more interest in recent years[1-4]. Syngas can be used as a feed of Fischer-Tropsch synthesis (FTS) to produce the high added values chemical such as high quality fuel with cetane number up to 75 and small content of aromatics and sulfur. The syngas can be generated via different methods (i.e., auto thermal reforming (ATR), catalytic partial oxidation (CPO) and steam methane reforming (SMR))[1]. Recently, the syngas production from partial oxidation of methane (POM) has been widely studied[2-4].The following reactions represent the partial and total oxidation of methane as follows:
|
$ {\rm{C}}{{\rm{H}}_{\rm{4}}}{\rm{ + 0}}{\rm{.5}}{{\rm{O}}_{\rm{2}}}{\rm{}} \to {\rm{ }}2{{\rm{H}}_{\rm{2}}}{\rm{ + CO }}\left( {{\rm{partial}}\;{\rm{oxidation}}} \right) $ |
|
$ {\rm{C}}{{\rm{H}}_{\rm{4}}}{\rm{ + 2}}{{\rm{O}}_{\rm{2}}} \to 2{{\rm{H}}_{\rm{2}}}{\rm{O + C}}{{\rm{O}}_{\rm{2}}}\left( {{\rm{total}}\;{\rm{oxidation}}} \right) $ |
Although the both aforementioned reactions are exothermic, but total oxidation releases the extra heat of combustion than partial one and finally results in no syngas production[1]. Reaction (1) as a partial oxidation referred to the direct mechanism and leads to CO together with H2 production[1].
Previous researches designated that it is more proper to express the catalyst partial oxidation (CPO) based on indirect mechanism[1]. In this mechanism; first, total oxidation of hydrocarbons proceeds, indeed hydrocarbons react with oxygen to form H2O and CO2 accompanied by heat release[1]. Subsequently, the endothermic steam reforming and CO2 (dry) reforming occur[5]. Steam and hydrocarbons dry reforming can be written as follow:
|
$ {\rm{C}}{{\rm{H}}_{\rm{4}}}{\rm{ + }}{{\rm{H}}_{\rm{2}}}{\rm{O }} \to {\rm{1CO}} + 3{{\rm{H}}_{\rm{2}}}\left( {{\rm{steam}}\;{\rm{reforming}}} \right) $ |
|
$ {\rm{C}}{{\rm{H}}_{\rm{4}}}{\rm{ + C}}{{\rm{O}}_{\rm{2}}} \to {\rm{2CO + 2}}{{\rm{H}}_{\rm{2}}}\left( {{\rm{dry}}\;{\rm{reforming}}} \right) $ |
In addition, other reactions could take place. The most essential ones are water gas shift (Eq. (5)) and CO hydrogenation (Eq. (6)):
|
$ {\rm{CO + }}{{\rm{H}}_{\rm{2}}}{\rm{O}} \to {\rm{C}}{{\rm{O}}_{\rm{2}}}{\rm{ + }}{{\rm{H}}_{\rm{2}}}\left( {{\rm{water-gas-shift}}} \right) $ |
|
$ {\rm{CO + 3}}{{\rm{H}}_{\rm{2}}} \to {\rm{C}}{{\rm{H}}_{\rm{4}}}{\rm{ + }}{{\rm{H}}_{\rm{2}}}{\rm{O }}\left( {{\rm{methanation}}} \right) $ |
As previously reported, among catalysts for partial oxidation of methane, nickel and cobalt active metals were exclusively used due to their low prices and suitable catalytic performance [5, 6]. Ni-based catalysts showed high catalytic activity for the partial oxidation of methane at temperatures higher than 973 K[6]. However, the stability of Ni-based catalysts was low and the sintering of Ni particles and deposition of carbons led to the deactivation of Ni-based catalysts [6]. The cobalt has higher melting, vaporizing points, less activity for syngas methanation and higher stability compared to nickel[6]. Thus, supported cobalt catalysts can be an appropriate alternative to nickel catalysts. Based on the literature[7-10], several parameters in terms of the support effect, synthesis methods of catalysts, introduction of promoters and etc. were investigated in the catalyst performance in POM. Nevertheless, there are no studies which concern the synthesis solution and pH values in catalytic partial oxidation. Xing et al[11] founded that CO conversion and formation of heavier hydrocarbons in FTS reaction enhanced by decreasing of pH from 4.0-5.0 in Co-NH4NO3 synthesis solution. Delgado et al[12] stated that the methane selectivity in FTS process remained constant within the pH range of 7-13.1, but increased up to 90% for higher pH unexpectedly. Concerning the product distribution, increasing the pH from 7 to 13.3 could lead to the slight decrease of the chain growth parameter from 0.59 to 0.52. Li et al[13] synthesized the Co/ZrO2 catalysts using different precipitants (i.e., NH4OH, Na2CO3 and NaOH) with different pH values (pH = 9, 11 and 13). They founded that the catalyst was prepared by NaOH (with pH of 13) illustrates the higher CO conversion and heavier hydrocarbons selectivity compared to other catalysts. Liu et al[14]prepared the Ni-Mg/Al2O3 catalysts by co-precipitation method using NH4OH, NaOH and Na2CO3. The obtained results demonstrated that the pH of synthesis solution influenced significantly on the NiO and oxide support interaction. Their catalytic performance in syngas methanation was improved by increasing of pH. In other study[15], The Co/ γ-Al2O3 catalysts were prepared by the slurry impregnation in the presence of nitric acid or ammonium hydroxide to control the pH in the range of 0.8-11.12. The considerable difference in the initial activity was observed. However, at higher reaction temperature of 240 ℃, the catalysts prepared at lower solution pH exhibited the higher conversion than those prepared at higher solution pH. The product distribution revealed a greater selectivity to C1 and C8+ upon using the catalyst that prepared with a higher solution pH[15]. Therefore, it is obvious that the pH plays a crucial role in the activity, selectivity and stability in the catalytic process[14].
In the present work, we synthesized Co/ γ-Al2O3 catalyst by chemical reduction of cobalt chloride over the γ-Al2O3 support in the presence of water-ethanol using NaBH4 reducing agent with different values of NaOH (with different pH in the range of 11.9-13.8) and then focused on the pH effect on the physical and chemical characteristics of prepared catalysts, catalytic activity and selectivity in POM.
The catalysts were synthesized via the chemical reduction method. First, 0.5 g of γ-Al2O3 (high purity, 100-200 mesh, 230 m2/g) was dispersed in 50 mL solution of ethanol-water (v/v:1/1) at 330 K under ultrasonic for 30 min. Then, CoCl2·6H2O (Sigma Aldrich) aqueous solution was added into the suspension, stirred and purged by N2 for 90 min to give the N2 saturated solution. Afterward, the NaBH4solution (0.007 g in 10 mL of NaOH) as a reducing agent was added dropwise into the solution under stirring at 313 K. After the suspension mixing for 8 h, the solution was allowed to settle down. Then, the solid sample was filtrated using circle filtration paper and washed with both ethanol and deionized water several times. The drying procedure of catalysts was carried out in vacuum condition at temperature of 373 K for 12 h. To eliminate the impurities and any residuals, the catalysts are calcined at 773 K for 5 h. The theoretical Co loading in synthesized catalysts are 15%. Table 1 reveals the specifications of all catalysts synthesized in this work.
 下载:
导出CSV
下载:
导出CSV
| Sample | NaOH concentration w/(mol·L-1) | pH of synthesis solution |
| CA1 | 0.01 | 11.92 |
| CA2 | 0.02 | 12.47 |
| CA3 | 0.1 | 13.04 |
| CA4 | 0.6 | 13.80 |
The XRD characterization of the calcined catalysts is obtained by an X′Pert MPD X-ray diffractometer (Philips Company) using Cu Kα radiation (λ=0.154 nm). The X-ray tube operates at 40 kV and 30 mA. The average CoO particle size (d) was calculated using Sherrer equation as d = 0.89 λ / β cosθ; where λ is the wavelength of X-ray and β is the full width half maximum of the CoO diffraction peak with 2θ=42.4° in radians.
By means of nitrogen adsorption/desorption using a Belsorp mini Ⅱ apparatus, the surface area, pore volume and catalysts average pore size were determined. The TPR analysis was carried out using Quantachrome ChemBET-3000, where the 0.05 g of catalyst was placed in a quartz tubular reactor. Prior to the temperature-programmed reduction (TPR) measurement, the calcined catalysts were heated up to 423 K under the pure N2 stream for 30 min in order to remove any water or impurities. After that, the sample was cooled down to the ambient temperature in N2 flow and the gas was switched to 5% H2/Ar. Then, catalysts were heated up to 1073 K with a rising rate of 10 K/min.
The dispersion and average size of reduced cobalt was determined by H2-chemisorption at 373 K in a Micromeritics ASAP 2020 C instrument. The samples were reduced in situ by flowing H2 and raising the temperature to 873 K and maintaining this temperature for 5 h. After reduction, the temperature decreased to 373 K and chemisorbed at same temperature.
To measure the reduction degree of synthesized catalysts, O2 pulse titration method was used. After the reduction process, the whole system temperature cooled down and reached to 673 K under He gas stream (30 mL/min) in order to remove physical and chemical adsorbed hydrogen on the catalyst surface. The oxygen pulses were introduced into the reactor. The quantity of consumed oxygen is a consequence of reduced cobalt. Hereby, the ratio of reduced cobalt to total of cobalt in catalyst shows the reduction degree.
The TEM analysis was specified using Philips CM 30 high resolution transmission electron microscopy (HRTEM). The catalysts acidity was determined by the temperature programmed desorption of ammonia (NH3-TPD). First, the sample was pretreated at 523 K under He flow for 2 h. After cooling to 373 K, ammonia was introduced into the reactor for 1 h and He was used to purge the remaining ammonia for 2 h, afterwards, the sample was heated from 373 to 1073 K with the heating rate of 10 K/min.
The quantity of carbon that deposited on the catalyst surface over the partial oxidation process was established by means of temperature programmed oxidation (TPO). This analysis was performed using Chemisorb 2750 (Micrometrics Company). First, the catalysts those used in partial oxidation of methane were placed inside a fixed bed reactor. The reactor also was placed in a furnace where temperature was increased with the heating rate of 10 K/min under a He flow (30 mL/min) for 2 h to remove the water and possible adsorbed gases. Then, heated up to the 1273 K under the stream of O2 and He mixture (5% O2) with a rising rate of 10 K/min. The reactor outlet products were analyzed using Agilent 7890A refinery gas analyzer with a thermal conductivity detector (TCD).
The catalysts performance was evaluated in a POM set up. Specific amount of samples (0.4 g) were loaded in a fixed-bed reactor (ID = 30 mm, OD = 35 mm and L= 70 cm), which was made of 316 stainless steel and was located in a furnace. Before starting the experiment, the catalysts were reduced at 873 K under atmospheric pressure for 5 h by a flow of pure hydrogen (30 mL/min). The reactant feed of methane and air with the ratio (v/v)of 4 to 1 was introduced into the reactor at space velocity of 9000 h-1 (30 mL/min) and pressure of 1.5 MPa. The product stream was analyzed after a period of 600 min with Agilent 7890 A refinery gas analyzer.
In order to determine the catalytic activity, methane conversion (xCH4), products selectivity and deactivation parameter were calculated as follows:
|
$ \begin{array}{l} {x_{{\rm{CH}}}}_{_4}\left( \% \right) = \\ \frac{{{\rm{amount}}\;{\rm{of}}\;{\rm{methane}}\;{\rm{in}}\;{\rm{inlet}}-{\rm{amount}}\;{\rm{of}}\;{\rm{methane}}\;{\rm{in}}\;{\rm{outlet}}}}{{{\rm{amount}}\;{\rm{of}}\;{\rm{methane}}\;{\rm{in}}\;{\rm{inlet}}}} \times 100\% \end{array} $ |
|
$ \begin{array}{l} {\rm{Selectivity}}\;{\rm{of}}\;i\left( \% \right) = \\ \frac{{{\rm{moles}}\;{\rm{of}}\;i\;{\rm{produced}}}}{{\left( {{\rm{total}}\;{\rm{moles}}\;{\rm{of}}\;{\rm{methane}}\;{\rm{converted}}} \right)}}\\ \times 100\% (i = {\rm{CO}}\;{\rm{and}}\;{\rm{C}}{{\rm{O}}_{\rm{2}}}) \end{array} $ |
|
$ \begin{array}{l} {{\rm{H}}_{\rm{2}}}\;{\rm{yield }}\left( \% \right) = \\ \frac{{{\rm{moles}}\;{\rm{of}}\;{{\rm{H}}_{\rm{2}}}\;{\rm{produced}}}}{{2 \times \left( {{\rm{total}}\;{\rm{moles}}\;{\rm{of}}\;{\rm{methane}}\;{\rm{feed}}} \right)}} \times 100\% \end{array} $ |
|
$ \begin{array}{l} {\rm{Deactivation }}\left( \% \right) = \\ \frac{{{\rm{initial}}\;{\rm{methane}}\;{\rm{conversion}}-{\rm{final}}\;{\rm{methane}}\;{\rm{conversion}}}}{{{\rm{initial}}\;{\rm{methane}}\;{\rm{conversion}}}} \times 100\% \end{array} $ |
The catalysts crystal structure was evaluated by means of XRD method and the corresponding results are illustrated in Figure 1.
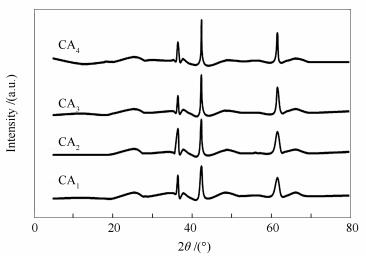
The diffraction patterns show the broad peaks at 2θ= 25.58°, 37.79° and 66.3° assigning to γ-Al2O3 [16-18]. The peaks at 2θ= 36.4°, 42.4° and 61.53° are ascribed to CoO with cubic structure[19]. As previous studies reported, the cobalt oxide phase is presented in XRD pattern as Co3O4 [20, 21]. In this work, owing to the using reducer in catalysts preparation, one step of cobalt oxidation was occurred (Co → CoO) which is in a good agreement with the result of H2-TPR test. The presence of CoO peaks may be attributed to the oxidation treatment before XRD test (during the catalyst transfer from catalyst synthesis experimental set up to XRD).
The peak at 48.5° in the spectrum of prepared catalysts is ascribed to formation of cobalt aluminate, although the peak intensity decreased by increasing pH[19, 20]. Previous studies demonstrated that the reaction of alumina and dispersed CoO was a responsible for cobalt aluminates species formation[19-21]. The CoO average particle size of 7.6-11.9 nm for catalysts was measured by the XRD pattern and using the Scherrer equation at 42.4° as reported in Table 2. The average particle size of prepared catalysts was calculated by TEM analysis (see Table 2). It was observed that the CoO average particle size for synthesized catalysts was almost coincided with the size value that calculated by XRD.
下载:
导出CSV
| Sample | Surface area A/(m2·g-1) | Total pore volume v/(cm3·g-1) | Average pore size d/nm | Average CoO crystal size (XRD) d/nm | Average CoO crystal size (TEM) d/nm |
| γ-Al2O3 | 230 | 0.498 | 9.2 | - | - |
| CA1 | 185.2 | 0.441 | 8.2 | 7.6 | 7.9 |
| CA2 | 183.1 | 0.437 | 7.7 | 8.9 | 9.3 |
| CA3 | 179.6 | 0.439 | 7.8 | 10.3 | 10.2 |
| CA4 | 178.3 | 0.438 | 7.5 | 11.9 | 12.3 |
It is obvious that intensity of CoO peaks increased and it was narrowed as pH of synthesis solution was increased. Increasing of pH in the range of 11.92-13.80 resulted in size increment of cobalt oxide nanocrystal to 4.3 nm. This could be ascribed to the lower number of cobalt oxide crystallization sites by increasing the pH from 11.92 to 13.80[19, 20]. Park et al[21] observed that the Co3O4 particle diameter increased through increasing of catalyst synthesis solution pH.
The results of the textural characteristics are listed in Table 2. It is obvious that, the BET surface area as well as the porosity of the loaded catalysts is lower than γ-Al2O3. The active components (Co) were blocking the support pores during the catalyst synthesis leading to the decrease of specific surface area, pore volumes and pore sizes[22]. An increase of pH in the range of 11.92-13.80 led to the surface area reduction from 185.2 to 178.3 m2/g. This decrement of surface area with the increasing of synthesis solution pH was observed by other similar works[13, 14]. By the increase in synthesis solution pH, any noticeable changed in pore volume and average pore size of synthesized catalysts was not detected.
The number of acid sites with dissimilar strength was measured by means of NH3-TPD test and the subsequent results are expressed in Table 3. The peaks located below 500 K, in the range of 550-605 and 623-823 K were assigned to the weak, the medium-strength and strength acid sites, respectively[22, 23]. It also showed that the ammonia uptake of weak acid sites was increased from 72 to 95 μmol/g, while strong acid sites was decreased from 127 to 71 μmol/g, by increasing pH of synthesis solution from 11.92 to 13.80. Consequently, it can be concluded that the increase of synthesis solution pH caused to the acidity reduction of synthesized catalysts.
下载:
导出CSV
| Sample | NH3 uptake /(μmol·g-1) | ||
| W | M | S | |
| CA1 | 72 | 139 | 127 |
| CA2 | 83 | 155 | 99 |
| CA3 | 89 | 161 | 87 |
| CA4 | 95 | 180 | 71 |
| weak (W), medium-strength (M) and strong (S) acid sites | |||
Figure 2 reveals the reduction behavior of the catalysts as studied by the H2-TPR.
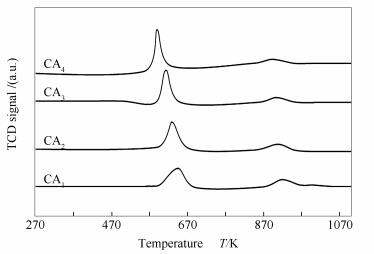
Although different studies concerned the H2-TPR behavior of Co/Al2O3 catalysts, however different interpretations were demonstrated about the attribution of reduction peaks [8-10]. For CA1 catalyst, a sharp reduction peak at 646 K is represented to the reduction of CoO crystallites to metallic cobalt. The high temperature reduction peak at 915 K is assigned to reduction of cobalt aluminate formation due to the strong interaction between cobalt and the alumina support[24]. Several studies were expressed that the cobalt aluminates species caused the shifting of H2-TPR spectrum to the higher temperature owing to the more difficulties of cobalt oxide reduction[24]. As the pH increases from 11.92 to 13.80, the first reduction peaks are found at 629, 614 and 590 K. Furthermore, the peak position of second reduction towards to the lower temperature as the synthesis solution pH increases. This can be attributed to the decrease in the interaction of cobalt species with the support which leading to the easier cobalt reduction. It suggested that CA4 catalyst with pH of 13.80 has a slightly higher reducibility than other prepared catalysts, which was in a good agreement with previous study[13]. We observed an increasing in intensity of reduction peak by increasing particle size of cobalt oxide from 7.6-11.9 nm, which was confirmed by Park et al[21] work.
H2-chemisorption and O2 pulse titration tests data were shown in Table 4, which were illustrated the valuable information such as cobalt dispersion, average particle size and reduction degree. Among all the catalysts, the small size of cobalt particle (8.82 nm) for CA1 catalyst (with pH of 11.92) was indicated to highest dispersion (10.91%) and surface area of metallic cobalt. The nanocrystal size of metallic cobalt was increased from 8.82 to 13.42 nm and cobalt dispersion was decreased from 10.91% to 7.15% as the synthesize solution pH increases from 11.92 to 13.80, which is consistent with the results obtained from XRD. The average metallic cobalt particles size calculated by H2-chemisorption and O2 pulse titration were bigger than sizes of cobalt oxide particles estimated by XRD analysis. This can be due to the partial blockage of cobalt by support species which decreases the H2-chemisorption to some extent[21]. The reduction degrees of prepared catalysts were calculated by means of O2 pulse titration method, as reported in Table 4. An increase of pH in the range of 11.92-13.80, leads to the growth of reduction degree from 71.6% to 91.8%. Xing et al[11] were reached to the inverse results in FTS reaction, so that the higher values of reduction degree are favorable at lower pH of synthesis solution. It was reported that the influence of cobalt particle size is one of the factors to obtain the high reduction degree and catalytic activity[12]. The growth in cobalt particle size led to increase of reduction degree that was observed by different scholars[11, 19, 21]. The differential values of reduction degree represent the variation in metallic cobalt nanoparticles size and dispersion over the γ-Al2O3 support.
下载:
导出CSV
| Sample | Uncorrected dispersion /%a | Uncorrected cobalt size d/nmb | Reduction degree /%c | Corrected dispersion /%d | Corrected cobalt size d/nme |
| CA1 | 7.81 | 12.29 | 71.6 | 10.91 | 8.82 |
| CA2 | 7.57 | 12.67 | 79.7 | 9.49 | 10.11 |
| CA3 | 7.32 | 13.12 | 83.2 | 8.79 | 10.92 |
| CA4 | 6.57 | 14.59 | 91.8 | 7.15 | 13.42 |
| a: uncorrected dispersion= 100×number of metallic cobalt atoms on the surface/total number of metallic cobalt atoms; b: uncorrected cobalt size were measured by H2-chemisorption using 96/uncorrected dispersion; c: measured by O2 pulse titration; d: corrected dispersion=100× (uncorrected dispersion/reduction degree); e: corrected cobalt size= (uncorrected cobalt size×reduction degree)/100 | |||||
The partial oxidation of methane was tested for prepared catalysts at the range of temperatures 923-1023 K and obtained results are listed in Table 5.
下载:
导出CSV
| Catalyst | Reaction temperature T/K | xCH4 /% | Selectivity s/% | H2 yield w/%/CO ratio | H2/CO ratio | |
| CO | CO2 | |||||
| CA1 | 923 | 40.33 | 31.08 | 19.73 | 33.98 | 1.76 |
| 1023 | 51.23 | 41.57 | 13.58 | 52.71 | 1.8 | |
| CA2 | 923 | 46.24 | 36.79 | 17.42 | 39.67 | 1.82 |
| 1023 | 53.08 | 46.51 | 13.32 | 55.23 | 1.83 | |
| CA3 | 923 | 58.66 | 40.24 | 13.24 | 49.14 | 1.91 |
| 1023 | 65.09 | 48.19 | 10.23 | 60.59 | 1.88 | |
| CA4 | 923 | 62.67 | 55.24 | 8.28 | 61.17 | 1.98 |
| 1023 | 71.02 | 61.49 | 6.71 | 70.88 | 2.05 | |
The reduction degree of CA1 catalyst was low which resulted in decrease of the number of accessible cobalt active sites for methane and consequently, the methane conversion decreased[1, 2]. By increasing pH from 11.92 to 13.80, the methane conversion increased significantly for all the process temperatures. This is an approve for the improving the reduction degree from 71.6% to 91.8% in which higher metallic cobalt sites were obtained for reaction. In fact, the larger the metallic cobalt particle size increases the active surface of catalyst, which leads to the higher catalytic performance[12].This behavior was mentioned in previous work, where the CO conversion was increased from 15% to 46.7% by increasing of synthesis solution pH in the range of 9-11[13].
Our results were in consistent with literature, where the raises of CH4 conversion due to temperature increment were reported[24].
At 1023 K, the maximum and minimum of methane conversion of 71.02 % and 51.23% were perceived for CA4 and CA1 samples, respectively. Table 5 shows the H2yield; CO and CO2 selectivity obtained using the prepared catalysts. By increasing pH in the range of 11.92-13.80, a considerable enhancement was seen in CO and H2production. These outcomes are described so that the catalytic performance for partial oxidation of methane depends on the synthesis condition. It should be noted that the H2 yield compared to CO and CO2 selectivity, was affected more by synthesis solution pH. The carbon dioxide selectivity decreased by increase of NaOH concentration. Hence, the CO selectivity and H2 yield were increased by increase of reducibility, while the carbon dioxide formation decreased.
It is observed that the higher temperatures led to the increase of CO selectivity, H2 yield and lower CO2 production. These results also are in consistent with previous studies, which higher methane conversion, CO selectivity and H2 yield are assigned to the higher process temperature[24, 25]. It is evident that the effect of temperature on the H2 yield was greater than the CO and CO2 selectivity. The maximum CO selectivity, H2 yield and least of CO2 formation were seen at 1000 K using CA4 catalyst. As shown in Table 5, that higher values of H2/CO ratio were seen at higher pH. Regarding as, the H2/CO ratio was closed to 2 using CA4; this catalyst was showed the effective performance in production of syngas as a feed of FTS. Thus, the best obtained pH value for Gas-to-Liquid (GTL) process was 13.80.
Figure 3 demonstrates the variations of CH4 conversion for all catalysts at 1023 K as a function of time-on-stream. It is shown that the CH4 conversion for CA1 catalyst was almost fixed (51.23%) during 50 h initial on stream. This stability can be owing to the strong metal-support interaction in this catalyst [26].
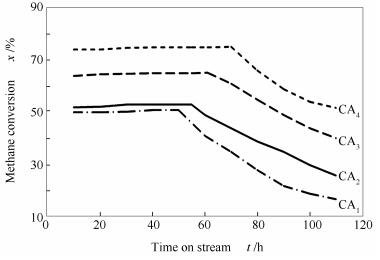
However, the catalyst performance reduces quickly (Deactivation: 66.1%) as the reaction time increases from 50 to 110 h. The quite remarkable results reported by other scholars for the supported Co-based catalysts[27, 28]. According to Figure 3, it is also observed that the catalysts stability increased by increase of pH in the range of 11.92-13.80. CA4 catalyst showed stable activity for about 70 h with CH4 conversion of 71.02%. In time period of 70 to 110 h, a decrease (about 27.15%) was observed in CH4 conversion. Figure 3 also shows that the stability of Co/Al2O3 catalysts in the partial oxidation of methane was affected significantly by synthesis solution pH.
Ruckenstein et al[27] found that deactivation of catalyst in dry reforming of methane could be the result of both carbon deposition and oxidation of metallic sites. They expressed that the stability of Co/Al2O3 catalysts in the CH4 reforming reaction was strongly affected by the Co loading and the calcination temperature. For Co loading below the 9%, there are other factors besides carbon deposition, influence on the catalytic deactivation. While for Co loading higher than 9%, the coke deposition was the main factor in Co/Al2O3 catalyst deactivation. In the study that concerned the partial oxidation of methane using Co/Al2O3 catalyst at temperature of 1273 K, a rapid deactivation was observed due to cobalt aluminate formation[28]. The coke deposition on this catalyst is assigned as below:
|
$ {\rm{C}}{{\rm{H}}_4} \to {\rm{C + }}{{\rm{H}}_{\rm{2}}}{\rm{O }}\left( {{\rm{cracking}}} \right) $ |
|
$ {\rm{2CO}} \to {\rm{C + C}}{{\rm{O}}_{\rm{2}}}\left( {{\rm{boudouard}}\;{\rm{reaction}}} \right) $ |
Table 6 shows the amount of accumulated carbon on the surface of catalysts during the reaction.
下载:
导出CSV
| Sample | Amount of coke formation /(mol×10-4) | Deactivation /% |
| CA1 | 2.423 | 66.1 |
| CA2 | 1.987 | 51.23 |
| CA3 | 1.744 | 38.46 |
| CA4 | 1.214 | 27.15 |
The deactivation percent for each catalyst also reported in order to correlate the carbon deposition with the catalytic deactivation. The results indicated that with increase of pH from 11.92 to 13.80, amount of both coke formation and deactivation percentage were decreased from 2.423×10⁻⁴ to 1.214×10⁻⁴ mol and 66.1% to 27.15%, respectively. It designated that the coke deposition was the greatest significant aspect for Co-based catalyst deactivation, which is consistent with literature[27].
Co/γ-Al2O3 catalysts were synthesized via CoCl2·6H2O chemical reduction in solution including water-ethanol with pH various values from 11.92 to 13.80. An increase in synthesis solution pH led to the decrease in CoO species reduction temperature so that a significant improvement in reduction degree observed from 71.6% to 91.8%. The methane conversion and CO selectivity of H2 yield was improved while; the carbon dioxide selectivity and deactivation percent was suppressed by increasing pH in the range of 11.92-13.80. The catalyst was prepared at pH of 13.80 represented a suitable performance in the syngas production as a FTS feed.
MOSAYEBI A, ABEDINI R. Partial oxidation of butane to syngas using nanostructure Ni/zeolite catalysts[J]. J Ind Eng Chem, 2014, 20(4): 1542-1548. doi: 10.1016/j.jiec.2013.07.044
MOSAYEBI A, ABEDINI R, BAKHSHI H. Ni@Pd nanoparticle with core-shell structure supported overγ-Al2O3 for partial oxidation process of methane to syngas[J]. Int J Hydrogen Energy, 2017, 42(30): 18941-18950. doi: 10.1016/j.ijhydene.2017.06.027
YU C L, HU J B, WENG W Z, ZHOU X C, CHEN X R. Preparation of Co/Ce0.5Zr0.5O2 catalysts and their catalytic performance in methane partial oxidation to produce synthesis gas[J]. J Fuel Chem Technol, 2012, 40(4): 418-423. doi: 10.1016/S1872-5813(12)60019-X
YU C L, ZHOU X C, WENG W Z, HU J B, Chen X R, WEI L F. Effects of alkaline-earth strontium on the performance of Co/Al2O3 catalyst for methane partial oxidation[J]. J Fuel Chem Technol, 2012, 40(10): 1222-1229. doi: 10.1016/S1872-5813(12)60123-6
JAFARBEGLOO M, TARLANI A, WAHID MESBAH A, SAHEBDELFAR S. One-pot synthesis of NiO-MgO nanocatalysts for CO2 reforming of methane:The influence of active metal content on catalytic performance[J]. J Nat Gas Sci Eng, 2015, 27(2): 1165-1173.
YU C, WENG W, SHU Q, MENG X, ZHANG B, CHEN X, ZHOU X. Additive effects of alkaline-earth metals and nickel on the performance of Co/γ-Al2O3 in methane catalytic partial oxidation[J]. J Nat Gas Chem, 2011, 20(2): 135-139. doi: 10.1016/S1003-9953(10)60175-2
NASABI M, LABBAFI M, MOUSAVI M E, MADADLOU A. Effect of salts and nonionic surfactants on thermal characteristics of egg white proteins[J]. Int J Biol Macromol, 2017, 102(1): 970-976.
LARIMI A S, ALAVI S M. Ceria-zirconia supported Ni catalysts for partial oxidation of methane to synthesis gas[J]. Fuel, 2012, 102(1): 366-371.
KIM H W, KANG K M, KWAK H Y. Preparation of supported Ni catalysts with a core/shell structure and their catalytic tests of partial oxidation of methane[J]. Int J Hydrogen Energy, 2009, 34(8): 3351-3359. doi: 10.1016/j.ijhydene.2009.02.036
LI L, HE S, SONG S, ZHAO J, JI W, TAO C K. Fine-tunable Ni@porous silica core-shell nanocatalysts:Synthesis, characterization, and catalytic properties in partial oxidation of methane to syngas[J]. J Catal, 2012, 288(1): 54-64.
XING C, AI P, ZHANG P, GAO X, YANG R, YAMANE N, SUN J, REUBROYCHAROEN P, TSUBAKI N. Fischer-Tropsch synthesis on impregnated cobalt-based catalysts:New insights into the effect of impregnation solutions and pH value[J]. J Energ Chem, 2016, 25(6): 994-1000. doi: 10.1016/j.jechem.2016.09.008
DELGADO J A, CASTILL S, CURULLA-FERR'E D, CLAVER C, GODARD C. Effect of pH on catalyst activity and selectivity in the aqueous Fischer-Tropsch synthesis catalyzed by cobalt nanoparticles[J]. Catal Commun, 2015, 71(1): 88-92.
LI Z, SI M, LI X, LIU R, LIU R, LV J. Cobalt catalysts for Fischer-Tropsch synthesis:The effect of support, precipitant and pH value[J]. Chin J chem Eng, 2017, : . doi: 10.1016/j.cjche.2017.11.001
LIU J, YU J, SU F B, XU G W. Inter correlation of structure and performance of Ni-Mg/Al2O3 catalysts prepared with different methods for syngas methanation[J]. Catal Sci Technol, 2014, 4(2): 472-481. doi: 10.1039/C3CY00601H
BAE J W, LEE Y J, PARK Y J, JUN K W. Influence of pH of the Impregnation solution on the catalytic properties of Co/Alumina for FTS[J]. Energy Fuels, 2008, 22(5): 2885-2891. doi: 10.1021/ef800155v
MOSAYEBI A, HAGHTALAB A. The comprehensive kinetic modeling of the Fischer-Tropsch synthesis over Co@Ru/γ-Al2O3 core-shell structure catalyst[J]. Chem Eng J, 2015, 259(1): 191-204.
MOSAYEBI A, MEHRPOUYA M A, ABEDINI R. The development of new comprehensive kinetic modelingfor Fischer-Tropsch synthesis process over Co-Ru/Al2O3 nano-catalyst in a fixed-bed reactor[J]. Chem Eng J, 2016, 286(1): 416-426.
ABEDINI R, MOSAYEBI A, MOKHTARI M. Improved CO2 separation of azide cross-linked PMPmixed matrix membrane embedded by nano-CuBTC metal organic framework[J]. Process Saf Environ, 2018, 114(1): 229-239.
HAGHTALAB A, MOSAYEBI A. Co@Ru nanoparticle with core-shell structure supported over Al2O3 for Fischer-Tropsch synthesis[J]. Int J Hydrogen Energy, 2014, 39(33): 18882-18893. doi: 10.1016/j.ijhydene.2014.09.074
KHODAKOV A Y, CHU W, FONGARLAND P. Recent advances in the liquid-phase syntheses of inorganic nanoparticles, Advances in the development of novel cobalt Fischer-Tropsch catalysts for synthesis of Long-Chain hydrocarbons and clean fuels[J]. Chem Rev, 2007, 107(5): 1692-744. doi: 10.1021/cr050972v
PARK J Y, LEE Y J, KARANDIKAR P R, JUN K W, HA K S, PARK H. Fischer-Tropsch catalyst deposited with size controlled Co3O4 nanocrystals:effect of particle size on catalytic activity and stability[J]. Appl Catal A:Gen, 2012, 411-412(1): 15-23.
MOSAYEBI A, ABEDINI R. Detailed kinetic study of Fischer-Tropsch synthesis for gasoline production over Co-Ni/HZSM-5 nano-structure catalyst[J]. Int J Hydrogen Energy, 2017, 42(44): 27013-27023. doi: 10.1016/j.ijhydene.2017.09.060
WANG S, YIN Q, GUO J, RU B, ZHU L. Improved Fischer-Tropsch synthesis for gasoline over Ru, Ni promoted Co/HZSM-5 catalysts[J]. Fuel, 2013, 108(1): 597-603.
BAYRAKDAR E, GVRKAYNAKALTINÇ EKIÇT, ÖKSVZÖMER M A F. Effects of PVP on the preparation of nanosized Al2O3 supported Ni catalysts by polyol method for catalytic partial oxidation of methane[J]. Fuel Process Technol, 2013, 110(1): 167175.
FERREIRA A C, FERRARIA A M, BOTEIHO A M, GONCALVE A P, CORREIA C. Partial oxidation of methane over bimetallic nickel-lanthanide oxides[J]. J Alloys Compd, 2010, 489(1): 316-323. doi: 10.1016/j.jallcom.2009.09.082
TAKENAKA S, ORITA Y, UMEBAYASHI H, MATSUNE H, KISHIDA M. High resistance to carbon deposition of silica-coated Ni catalysts in propane stream reforming[J]. Appl Catal A:Gen, 2008, 351(2): 189-194. doi: 10.1016/j.apcata.2008.09.017
RUCKENSTEIN E, WANG H Y. Carbon deposition and catalytic deactivation during CO2 reforming of CH4 over Co/Al2O3 catalysts[J]. J Catal, 2002, 205(2): 289-293. doi: 10.1006/jcat.2001.3458
LØDENG R, BJØRGUM E, ENGER B C, EILERTSEN J L, HOLMEN A, KROGH B, RØNNEKLEIV M, RYTTER E. Catalytic partial oxidation of CH4 to H2 over cobalt catalysts at moderate temperatures[J]. Appl Catal A:Gen, 2007, 333(1): 11-23. doi: 10.1016/j.apcata.2007.08.038

Figure 3 Time-dependent of CH4 conversion over the reduced Co/γ-Al2O3 catalysts
p= 1.5 MPa, GHSV=9000 h-1, T=1023 K, CH4/air=4
Table 1. Composition of the prepared catalysts
| Sample | NaOH concentration w/(mol·L-1) | pH of synthesis solution |
| CA1 | 0.01 | 11.92 |
| CA2 | 0.02 | 12.47 |
| CA3 | 0.1 | 13.04 |
| CA4 | 0.6 | 13.80 |
 下载: 导出CSV
Table 2. Textural parameters of the prepared catalysts
| Sample | Surface area A/(m2·g-1) | Total pore volume v/(cm3·g-1) | Average pore size d/nm | Average CoO crystal size (XRD) d/nm | Average CoO crystal size (TEM) d/nm |
| γ-Al2O3 | 230 | 0.498 | 9.2 | - | - |
| CA1 | 185.2 | 0.441 | 8.2 | 7.6 | 7.9 |
| CA2 | 183.1 | 0.437 | 7.7 | 8.9 | 9.3 |
| CA3 | 179.6 | 0.439 | 7.8 | 10.3 | 10.2 |
| CA4 | 178.3 | 0.438 | 7.5 | 11.9 | 12.3 |
下载: 导出CSV
Table 3. Acid sites of prepared samples determined by NH3-TPD analysis
| Sample | NH3 uptake /(μmol·g-1) | ||
| W | M | S | |
| CA1 | 72 | 139 | 127 |
| CA2 | 83 | 155 | 99 |
| CA3 | 89 | 161 | 87 |
| CA4 | 95 | 180 | 71 |
| weak (W), medium-strength (M) and strong (S) acid sites | |||
下载: 导出CSV
Table 4. H2-chemisorption and O2 pulse titration results for the synthesized catalysts
| Sample | Uncorrected dispersion /%a | Uncorrected cobalt size d/nmb | Reduction degree /%c | Corrected dispersion /%d | Corrected cobalt size d/nme |
| CA1 | 7.81 | 12.29 | 71.6 | 10.91 | 8.82 |
| CA2 | 7.57 | 12.67 | 79.7 | 9.49 | 10.11 |
| CA3 | 7.32 | 13.12 | 83.2 | 8.79 | 10.92 |
| CA4 | 6.57 | 14.59 | 91.8 | 7.15 | 13.42 |
| a: uncorrected dispersion= 100×number of metallic cobalt atoms on the surface/total number of metallic cobalt atoms; b: uncorrected cobalt size were measured by H2-chemisorption using 96/uncorrected dispersion; c: measured by O2 pulse titration; d: corrected dispersion=100× (uncorrected dispersion/reduction degree); e: corrected cobalt size= (uncorrected cobalt size×reduction degree)/100 | |||||
下载: 导出CSV
Table 5. Results of catalytic activity in the partial oxidation of methane
| Catalyst | Reaction temperature T/K | xCH4 /% | Selectivity s/% | H2 yield w/%/CO ratio | H2/CO ratio | |
| CO | CO2 | |||||
| CA1 | 923 | 40.33 | 31.08 | 19.73 | 33.98 | 1.76 |
| 1023 | 51.23 | 41.57 | 13.58 | 52.71 | 1.8 | |
| CA2 | 923 | 46.24 | 36.79 | 17.42 | 39.67 | 1.82 |
| 1023 | 53.08 | 46.51 | 13.32 | 55.23 | 1.83 | |
| CA3 | 923 | 58.66 | 40.24 | 13.24 | 49.14 | 1.91 |
| 1023 | 65.09 | 48.19 | 10.23 | 60.59 | 1.88 | |
| CA4 | 923 | 62.67 | 55.24 | 8.28 | 61.17 | 1.98 |
| 1023 | 71.02 | 61.49 | 6.71 | 70.88 | 2.05 | |
下载: 导出CSV
Table 6. Coke deposition and deactivation as a function of synthesis solution pH over the Co/Al2O3 catalysts
| Sample | Amount of coke formation /(mol×10-4) | Deactivation /% |
| CA1 | 2.423 | 66.1 |
| CA2 | 1.987 | 51.23 |
| CA3 | 1.744 | 38.46 |
| CA4 | 1.214 | 27.15 |
下载: 导出CSV

 扫一扫看文章


扫一扫关注我们

