Figure 1.
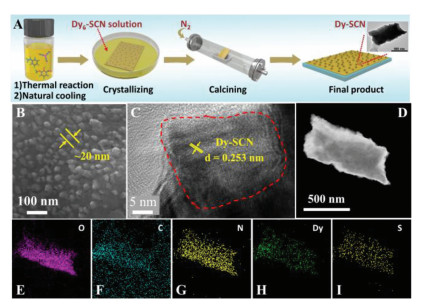
(A) Schematic diagram of the preparation process of Dy-SCN/FTO photoelectrode for L-lactic acid concentration detection. (B) SEM image of Dy-SCN/FTO. (C) HRTEM mapping image of Dy-SCN. (D-I) HRTEM-DES-Mapping of Dy-SCN.
Label-free photoelectric sensor for lactic acid determination in human sweat
Dongfang Han , Xiaolei Li , Zhishan Liang , Bolin Zhao , Zhifang Wu , Fangjie Han , Dongxue Han , Li Niu

Lactic acid is a product of the anaerobic metabolism of glucose. It mainly comes from white skeletal muscle, brain, skin, renal medulla and red blood cells. Generally, it originated from glucose metabolized in the cytoplasm through the glycolysis pathway. Body lactate concentration is a sensitive marker reflecting peripheral tissue perfusion and intracellular hypoxia, as well as an indicator of death [1, 2]. The variation of L-lactic acid has an important correlation with the internal environment of the body. The dynamic determination of L-lactic acid value can help doctors detect the changes of the condition as early as possible during the process of treating patients, and it is of great significance to judge the degree of cell damage and hypoxia state of tissues to correct them in time, so as to improve the success rate of rescue [3-5]. Whether monitoring human disease or guiding health exercise, it is extremely important to detect the concentration of L-lactic acid in human body.
Nevertheless, requirements of frequent blood drawing for L-lactic acid levels evaluation during exercise to monitor vital substances or investigating body state will cause a lot of inconveniences, which might also increase the risk of infection. Fortunately, there is a certain relationship between the concentration of L-lactic acid in human blood and sweat [6], and it is possible to determinate lactic acid in human body through a non-invasive way [7]. The rapid and sensitive desire of sweat lactate acid determination makes it an essential requirement for ideal sensor development.
Nowadays, the commonly used strategies for L-lactic acid analysis in sweat mainly include liquid chromatography [8-10], fluorescence colorimetry spectrophotometry [11] and nuclear magnetic resonance approaches [12]. In particular, traditional testing methods often suffer from some possible drawbacks, for example, large instruments requirement, complex operation, expensive cost as well as low efficiency, which should not be conducive to rapid and convenient testing. Electrochemical sensing has been widely used because of its high selectivity, low cost, simple operation and rapid response [13-15]. For the commonly applied enzyme-modified electrode sensors, although electrochemical enzyme-catalyzed process can quickly and efficiently reveal the concentration of L-lactic acid in sweat, the biological enzyme consumption always brings high cost, while the inadvisable stability of the enzyme in normal temperature usually raises a new problem for limited condition preservations, which makes the enzyme-modified electrochemical method not competent for wide application [16-20]. Till now, only a few investigations reported the development of enzyme-free electrochemical approach for such use. Since then, it is very promising to develop a rapid, simple and enzyme-free strategy for the determination of L-lactic acid concentration in human sweat.
The photoelectric chemistry (PEC) technique has attracted wide attention due to its inherent advantages in recent years [21-25]. Although it has been paid great attentions, the photochemical catalytic system for human lactic acid was still very rare. In this research a kind of Dy-SCN photoelectronic semiconductor material was developed by calcination of [Dy6L2(μ3-OH)4(µ2-OH)2(SCN)8(H2O)4]·6CH3CN·2CH3OH·H2O single crystal (Dy6-SCN). The regular structure of the obtained semiconductor is beneficial to the transport of separated carriers during photoexcitation. As the central atom in the single crystal structure has a strong coordination effect on the L-lactic acid molecules, the Dy-SCN photoelectrode depicted excellent specific adsorption for L-lactic acid species. Based on this hybrid material, an enzyme-free potentiometric sensing platform towards L-lactic acid in human sweat was designed and constructed.
Fig. 1A illustrates the scheme of the preparation process of Dy-SCN/FTO. To ensure the advisable PEC performance of this modified electrode, the optimal experimental parameters were determined by different screening sintering temperatures, excitation light source wavelength and excitation power. Based on the above discussion, the PEC sensor was further constructed under the condition of 535 nm light excitation at 5 W with 300 ℃ sintering temperature (see Supporting information). Concerning the morphology study, as shown in Fig. 1B, the scanning electron microscopy (SEM) image demonstrated that some uniform distributed but irregularly shaped islands were observed embedding into the base material, while the high-resolution transmission electron microscopy (HRTEM, Fig. 1C) image further revealed the posture of the semi-wrapped embedded rectangular structure with well-organized crystal lattice gap of 0.253 nm. In addition, the Energy-disperse spectroscopy (EDS) characterization further verified the homogeneous distribution of O, C, N, Dy and S elements in the composite (Figs. 1D-I).
The elements of Dy-SCN/FTO were then analyzed by X-ray photoelectron spectroscopy (XPS). As shown in Fig. 2A, the peaks of 531.28, 399.58, (284.88, 286.88, 289.08) and 163.68 eV belong to O 1s, N 1s, C 1s and S 2p respectively, while the peaks of Dy3d3 and Dy3d5 appeared at 1334.78 and 1297.28 eV respectively (Detailed high-resolution XPS pattern for each element was illustrated in Supporting information). These results were in good agreement with the analysis results of HRTEM-DES-Mapping, confirming that the Dy-SCN optoelectronic semiconductor materials have been successfully synthesized.
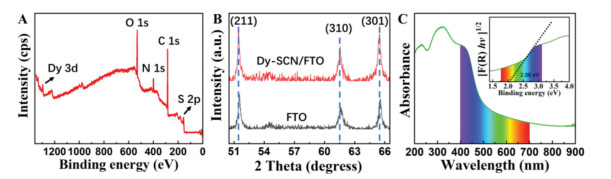
X-ray diffraction measurement results of Dy6-SCN (Fig. S1A in Supporting information) confirmed the successful synthesis of the Dy single crystal [26]. While after sintering at 300 ℃ for 2 h on the FTO substrate, the faint specific peaks of Dy-SCN/FTO were inconspicuous to be observed which might be submerged into the characterized peaks of FTO (Fig. S1B in Supporting information). However, in the high-resolution XRD patterns (Fig. 2B), it was found that the peak angle of Dy-SCN/FTO and FTO is offset to some extent, which indicated that Dy-SCN has successfully grown on the FTO surface with new crystal plane formed and the modified electrode was thus prepared.
As can be seen from Fig. 2C, the UV–visible diffuse reflectance spectrum (DRS) of Dy-SCN/FTO showed two absorption peaks at 234 and 322 nm. Besides this, the electrode material also demonstrated ideal absorption within the whole visible region as well as part of the near-infrared district, which displayed suitable feasibility for further photoelectrical applications. According to the above characterizations, the Kubelka-Munk function curve of the modified PEC electrode was drawn and the direct bandgap of this photoelectric semiconductor material was calculated to be 2.06 eV (presented in the inset of Fig. 2C).
In order to explore the performance of Dy-SCN/FTO photoelectric semiconductor for PEC response of L-lactic acid, different concentrations of the samples were introduced into the photoelectric detection cell. According to Fig. 3A, within the range of 19.6 × 10⁻⁶ ~ 16.31 × 10⁻³ mol/L, the photoelectric potential signal increased proportionally with the promotion of the target concentration (Insert of Fig. 3A), and a good linear relationship between electric potential and L-lactic acid concentration was obtained (R2 = 0.9917). The calculated limit of detection (LOD) achieved 3.20 µmol/L. The results showed that the constructed enzyme-free Dy-SCN/FTO photoelectric semiconductor electrode displayed excellent PEC performance towards L-lactic acid response during a preferable concentration range with high sensitivity. In addition, the stability, repeatability and producibility of such Dy-SCN/FTO PEC sensors have been thoroughly studied, and the results further verified the advisable availability of photo-potential technique adapted in this system (Fig. S10 in Supporting information).
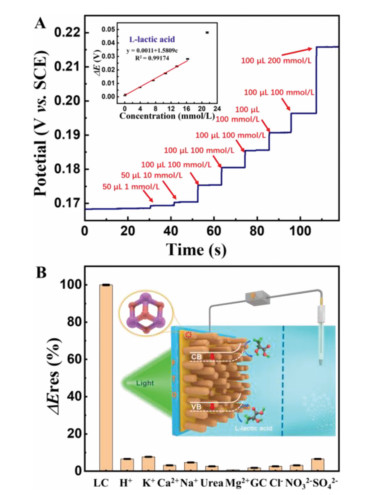
To verify the specificity and selectivity of Dy-SCN/FTO electrode towards L-lactic acid detection, the most commonly co-existed biomolecules and inorganic ions in human sweat were investigated as interferences according to previous reports [27-30]. As depicted in Fig. 3B, with 7.69 mmol/L L-lactic acid in circumstance, 5 times of H+, K+, Ca2+, Na+, Urea, Mg2+, SO42− and Glucose (GC), and 10 times of Cl− and NO3− in concentration had been introduced. When the above substances with far beyond concentration in human sweat were introduced respectively, only indistinctive changes occurred. It meant that these species manifested minimal influence on L-lactic acid recognition and identification at the Dy-SCN/FTO surface, which indicated an excellent specificity of this PEC sensor.
Insert of Fig. 3B proposed the possible analysis mechanism scheme of L-lactic acid on the enzyme-free Dy-SCN/FTO PEC electrode. Generally, during the open-circuit potential detection, Fermi energy levels on both sides of the electrode surface are the same since almost no current flows through the surface. That is, the charge is balanced on both sides of the electrode interface. The amount of charge carried by the holes or electrons at the photoelectric semiconductor interface is equal to that carried by the intentionally adsorbed material on the electrode surface (charge shift of polar molecules) ql = qs (ql stands for the amount of charge specifically adsorbed on the semiconductor surface, and qs is the amount of charge on the semiconductor surface). As the Fermi level inside the semiconductor is higher than that of the solution, part of the electrons move towards the electrode surface. The concentration of the semiconductor carriers on the electrode surface can be calculated according to the formula pSC = NA exp[F(E − Efb)/RT] (pSC is the concentration of charge carriers at the semiconductor interface, NA is the total amount of charge carriers inside the semiconductor and it is a constant, F is Faraday constant, R represents to the ideal gas constant, T is the testing temperature, which is 298 K because the laboratory is conducted at room temperature, and E − Efb represents the potential drop caused by band bending in the semiconductor). Then the charge amount of the semiconductor surface carrier can be expressed as qs = e pSC = e NA exp[F(E − Efb)/RT] (e is the charge of electrons). According to the Freundlich adsorption isothermal equation Γ = kf c^(1/n) (Γ represents to the amount of adsorbed material on the electrode surface, kf is the Freundlich adsorption constant, and n is the adsorption constant of the specific material), the adsorption amount of target molecules on the electrode surface can be calculated according to the concentration of the specific adsorbent in the solution, and the charge of the adsorbent is ql = z Γ = z kf c^(1/n) (z is the charge of the adsorbed substance molecule). According to the charge balance, the equation is e NA exp[F(E − Efb)/(RT)] = e pSC = qs = ql = z Γ = z kf c^(1/n) and ∆φ = E − Efb = (RT/F) ln[z kf/(eNA)] + (RT/F) lnc can be obtained (Since the potential drop caused by the bending of the semiconductor energy band is much larger than that in the double layer, the measured value Δφ can be considered as E − Efb.). When the concentration of the solution is very low, according to the mathematical approximate substitution formula lnx ≈ x, and the constant in the formula is substituted as a = RT/F, b = (RT/F) ln[zk/(eNA)], the expression of potential and concentration is ∆φ = ac + b. It can be seen from the derived expression that the photoelectric semiconductor electrode adopts the open-circuit potential method to record the concentration of the target substance (the concentration is low) and the test potential has a linear relationship with the concentration of the analyte. The results obtained in practical performance are in good agreement with the derived expressions.
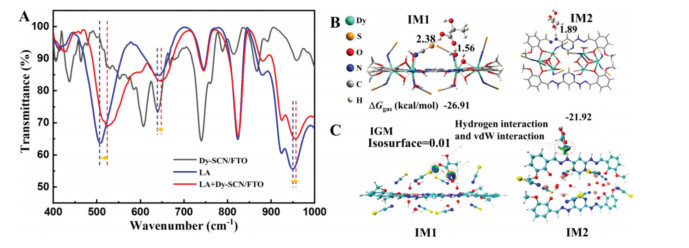
To investigate the specific response principle of this PEC sensor towards L-lactic acid, Dy-SCN/FTO, standard solution of L-lactic acid and Dy-SCN/FTO electrode after testing were inspected by infrared spectroscopy. As shown in Fig. 4A, in the wavenumber range of 500–1000 cm−1, several absorption peaks of L-lactic acid solution and electrode surface appear displacement, which proves that C—O and C—H vibration energy of L-lactic acid molecule changes. It can be concluded that L-lactic acid molecules bind specifically with Dy-SCN/FTO electrode interface and coordination bonds should be formed. In order to investigate the interaction between the complex and L-lactic acid, based on density functional theory (DFT), two compatible structures of IM1 (The carbonyl group in lactic acid is bound to the N—H bond of Dy-SCN by hydrogen bond interaction) and IM2 (Lactic acid is bound to the coordination H2O molecule on Dy-SCN by hydrogen bond interaction) were optimized by VASP. Compared with the complex and L-lactic acid, the free energy data showed that the exothermic properties of IM1 and IM2 were 26.91 and 21.92 kcal/mol, respectively. The interaction of lactic acid with SCN groups was also examined. As shown in Fig. 4B, the O…HO bond length in IM1 is 1.56 Å, the S…HO bond length is 2.38 Å, and the NH…O bond length in IM2 is 1.89 Å. It suggested that the S…H−O hydrogen bond was weak, preferring to form hydrogen bonds with coordination H2O molecule. Multiwfn wave function analysis software was used to understand the weak interaction force. As shown in Fig. 4C, in the molecular binding region, the green part represents van der Waals interaction, and the blue part indicates hydrogen bond formation. It can be seen that the interaction between the complex and L-lactic acid mainly comes from the hydrogen bond interaction between N—H and the coordination water and lactic acid.
In addition, practical applications were carried out where the collected volunteers' extracorporeal sweat samples were introduced into an existing 2.5 mL PBS solution, and the photoelectric potential before and after addition of analytes were recorded. Typically, to monitor endogenous state of human body, sweat samples from the same person in different exercise states (stationary, aerobic exercise 5 min, 10 min, 15 min, and 20 min) were collected and studied. As shown in Table 1, all the samples displayed minor deviations compared with traditional Liquid Chromatogram (LC) means, which further verifies the preferable accuracy and feasibility of this Dy-SCN/FTO PEC platform towards human sweet L-lactic acid analysis.
 DownLoad:
CSV
DownLoad:
CSV

|
In summary, a novel photoelectrochemical potentiometry sensor based on Dy-SCN/FTO system was established in this work, which has been successfully employed for enzyme-free L-lactic acid determination in human sweat. The system photo-potential were recorded under illumination using open circuit potential-time (OCPT) technology, and the effectiveness of such a Dy-SCN/FTO photoelectrochemical sensor was verified by excellent selectivity towards L-lactic acid as well as advisable anti-interference. The probable selectivity essential of L-lactic acid in this system was further discussed and proposed. The mechanism formula was also derived according to the charge balance theory, which should lay the theoretical foundation for the rationality of this strategy. Finally, the practicability of this technique was verified by the performance of actual human sweat samples compared with classical means. Such a Dy-SCN/FTO PEC sensor was expected to be further employed for rapid, non-invasive L-lactic acid level evaluation during human physical condition monitoring. To validate the generality of the principle we proposed for other types of biological samples, in the future study, the effects of more small biomolecules, such as amino acids, are interesting and deserve a careful future investigation.
The authors declare that they have no known competing financial interests or personal relationships that could have appeared to influence the work reported in this paper.
We are grateful to the National Natural Science Foundation of China (Nos. 22172040 and 21974031), the Department of Science and Techniques of Guangdong Province (Nos. 2021A1515010180 and 2019B010933001), Guangzhou Municipal Science and Technology Bureau (No. 202102010449), and Guangzhou Municipal Science and Technology Bureau (No. GZQC20-PZ11-FD084) for their financial support to this work.
Supplementary material associated with this article can be found, in the online version, at doi:
S.P. Mathupala, Y.H. Ko, P.L. Pedersen, Semin. Cancer Biol. 19 (2008) 17–24.
D. Baba, A.S. Nugraha, M. Iqbal, RSC Adv. 8 (2018) 10446–10449. doi: 10.1039/C7RA13026K
J.S. Weiner, R. Van Heyningen, Nature 164 (1949) 351. doi: 10.1038/164351b0
L. Klous, C.J. de Ruiter, S. Scherrer, N. Gerrett, H.A.M. Daanen, Eur. J. Appl. Physiol. 121 (2021) 803–816. doi: 10.1007/s00421-020-04562-8
Y. Mao, W. Yue, T. Zhao, Biosensors 10 (2020) 75. doi: 10.3390/bios10070075
S. Garcia-Rey, E. Ojeda, U.B. Gunatilake, L. Basabe-Desmonts, F. Benito-Lopez, Biosensors 11 (2021) 3–12.
O. Smutok, M. Karkovska, R. Serkiz, Sens Actuators B: Chem 250 (2017) 469–475. doi: 10.1016/j.snb.2017.04.192
S. Biagi, S. Ghimenti, M. Onor, E. Bramanti, Biomed. Chromatogr. 26 (2012) 1408–1415. doi: 10.1002/bmc.2713
S. Sugase, T. Tsuda, Jpn. Soc. Anal. Chem. 6 (2002) 429–435. doi: 10.2116/bunsekikagaku.51.429
Y. Jiang, J. Sun, X. Huang, Analyst 144 (2019) 7017–7023. doi: 10.1039/C9AN01385G
A. Roda, M. Guardigli, D. Calabria, Analyst 139 (2014) 6494–6501. doi: 10.1039/C4AN01612B
J. Li, Y. Zhai, B. Zhang, Polym. Int. 57 (2008) 268–274. doi: 10.1002/pi.2339
W. Dungchai, O. Chailapakul, C.S. Henry, Anal. Chem. 81 (2009) 5821–5826. doi: 10.1021/ac9007573
S. Baek, J. Kwon, T. Mano, S. Tokito, S. Jung, Macromol. Biosci. 20 (2020) e2000144. doi: 10.1002/mabi.202000144
W. Gao, S. Emaminejad, H.Y.Y. Nyein, Nature 529 (2016) 509–514. doi: 10.1038/nature16521
X. Cai, J. Yan, H. Chu, M. Wu, Y. Tu, Sens. Actuators B: Chem. 143 (2010) 655–659. doi: 10.1016/j.snb.2009.10.002
F. Alam, A.H. Jalal, S. Forouzanfar, IEEE Sens. J. 20 (2020) 5102–5109. doi: 10.1109/JSEN.2020.2968278
H. Lee, C. Song, Y.S. Hong, Sci. Adv. 3 (2017) e1601314. doi: 10.1126/sciadv.1601314
G. Baysal, S. Önder, I. Göcek, Textile Res. J. 84 (2014) 1729–1741. · doi: 10.1177/0040517514528565
K. Enomoto, R. Shimizu, H. Kudo, Electron. Commun. Jpn. 101 (2018) 41–46. doi: 10.1002/ecj.12061
F. Han, Z. Song, M. Nawaz, Anal. Chem. 91 (2019) 10657–10662. doi: 10.1021/acs.analchem.9b01889
B. Gao, X. Zhao, Z. Liang, Anal. Chem. 93 (2021) 820–827. doi: 10.1021/acs.analchem.0c03315
L. Liang, N. Shuang, M. Dai, Chem. J. Chin. Univ. Chin. 40 (2019) 2081–2089.
M. Dai, W. Ma, F. Han, Chem. Res. Chin. Univ. 37 (2020) 763–771.
F. Han, M. Dai, Z. Liang, Chem. J. Chin. Univ. Chin. 41 (2020) 591–603.
X. Li, H. Li, D. Chen, Cheng, Dalton Trans. 44 (2015) 20316–20320. doi: 10.1039/C5DT03931B
B. Paul, S. Demuru, C. Lafaye, M. Saubade, D. Briand, Adv. Mater. Technol. 6 (2021) 2000910. doi: 10.1002/admt.202000910
G. Liu, M. Alomari, B. Sahin, Appl. Phys. Lett. 106 (2015) 133702. doi: 10.1063/1.4916831
Y.M. Choi, H. Lim, H.N. Lee, Biosensors 10 (2020) 111. doi: 10.3390/bios10090111
J.Y. Han, M. Li, H. Li, Biosens. Bioelectron. 170 (2020) 112675. doi: 10.1016/j.bios.2020.112675

Figure 1 (A) Schematic diagram of the preparation process of Dy-SCN/FTO photoelectrode for L-lactic acid concentration detection. (B) SEM image of Dy-SCN/FTO. (C) HRTEM mapping image of Dy-SCN. (D-I) HRTEM-DES-Mapping of Dy-SCN.

Figure 2 (A) XPS spectrum of Dy-SCN material. (B) XRD comparison between Dy-SCN/FTO and FTO. (C) UV–vis diffused reflectance spectrum and Kubelka-Munk function curve of Dy-SCN/FTO.

Figure 3 (A) Photo-potential responses of Dy-SCN/FTO electrodes upon different concentrations of L-lactic acid. Inset shows the corresponding liner calibration. (B) Influences of 5 times concentration of H+, K+, Ca2+, Na+, urea, Mg2+, SO42−, and GC, and 10 times concentration of Cl− and NO3− on the photo-potential response of the Dy-SCN/FTO electrodes in 0.1 mol/L PBS (pH7.4) containing 7.69 mmol/L L-lactic acid. Inset illustrates the schematic diagram of the detection process.

Figure 4 (A) Infrared spectra of Dy-SCN/FTO, L-lactic acid standard solution and Dy-SCN/FTO after L-lactic acid testing. (B) Optimized adsorption structures of Dy-SCN and L-lactic acid. (C) Independent Gradient Model (IGM) plot isosurfaces mapped by the values of sign (λ2) ρ for the adsorption complex IM1 and IM2.
Table 1. Comparison of LC and photo-potential analysis results of L-lactic acid concentration in actual human sweat samples.
|
|
 下载: 导出CSV

 扫一扫看文章

扫一扫关注我们