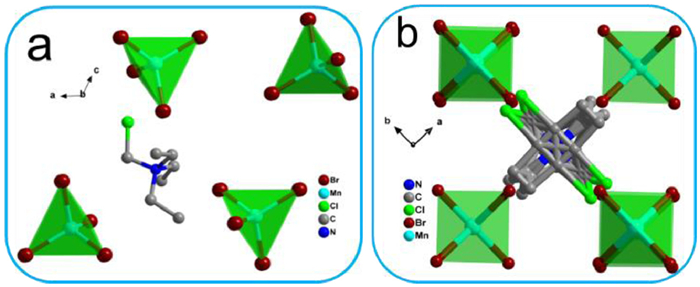
Figure 1.
Molecular structure of compound 1 at (a) 200 K and (b) 380 K.
Magnetic, dielectric and luminescence synergetic switchable effects in molecular material [Et3NCH2Cl]2[MnBr4]
Yan Cheng , Hua-Peng Ruan , Yan Peng , Longhe Li , Zhenqiang Xie , Lang Liu , Shiyong Zhang , Hengyun Ye , Zhao-Bo Hu

As a new class of revolutionary materials, organic–inorganic hybrid multifunctional materials have attracted tremendous attention due to their potential application in fields of integrated optical sensors, signal processors, organic light-emitting diodes, magnetic materials, etc. [1–5]. It is well known that the structure of a material determines its properties, therefore, the work-configuration relationship between its structure and properties is explored using the principles of crystal engineering [6–9]. The structure of multifunctional materials could change significantly with external stimuli such as temperature, light, electric field, magnetic field and pressure, resulting in properties such as electrical properties, magnetic properties, and luminescence [10–15]. However, integrating these independent properties in a compound is quite a challenge [6,16–20].
Using the principle of coordination chemistry to directionally synthesize compounds with specific structures is a promising method to obtain multifunctional materials [21–24]. Organic-inorganic hybrid materials with general formula of A2BX4 (A: organic amine cation, B: metal ion, X: halide ion) with different components can show different properties, such as luminescence, dielectric, ferroelectric, magnetic [25–31]. Among them, the phase transition is mainly derived from the order and disorder of the organic amine cation at the A position [26,32–34]. As shown in previous reports, Fu and co-workers reported two organic–inorganic hybrids (IPTMA)2CdBr4 and (IPTMA)2MnBr4 (IPTMA) = isopropyltrimethylammonium) [29]. Both compounds have phase transitions, and the mechanism of the phase transitions can be attributed to the synergistic effect of order–disorder transitions in organic cations and metal frameworks. Their unique switchable of the dielectric properties make it an excellent dielectric switch. Furthermore, the d-d transition of the transition metal ion at B site makes the compound have luminescent properties, and at the same time, the unpaired electrons in the orbitals are beneficial to the compound to achieve magnetic properties [35–37]. Therefore, organic-inorganic hybrid materials are a potential candidate for multifunctional molecular materials showing luminescence, dielectric and magnetic synergetic switchable effects [33,35–38].
Based on the above description, a compound [Et3NCH2Cl]2[MnBr4] (1) by reaction between chloromethyl-triethylammonium chloride and manganese bromide was synthesized. The single-crystal structure measurements at 200 K and 380 K show that the organic cations in the lattice transform disorder at high temperature. The dielectric anomaly of compound 1 is verified by dielectric measurements, and its dielectric lifetime was further characterized, manifesting that compound 1 is dielectric switching properties. Compound 1 exhibits yellow–green luminescence under UV light irradiation due to the d-d transition of Mn(Ⅱ). Magnetic measurements show that the compound is paramagnetic. Therefore, compound 1 is rare example showing luminescence, dielectric and magnetic synergetic switchable effects in a molecular compound, which provides a new idea for designing multifunctional materials.
The infrared (IR) spectra (Fig. S1 in Supporting information) of 1 was recorded from KBr pellets in the range of 400–4000 cm−1. The thermogravimetric analysis (TGA) curve of the compound 1 is shown in Fig. S2 (Supporting information). It can be seen from the figure that compound 1 is decomposed at about 475 K, which indicates that it has excellent thermal stability.
Single crystal data of compound 1 was collected with X-ray single crystal diffractometer at 200 K and 380 K according to DSC data. For the convenience of analysis, the fraction below 320 K is defined as low temperature phase (LTP) and the fraction above 340 K is defined as high temperature phase (HTP). At 200 K, compound 1 crystallizes in the monoclinic space group P21/n. The asymmetric unit of compound 1 consists of two independent Et3NCH2Cl cations and one [MnBr4]2− anion. Mn(Ⅱ) ion is located at the center of the tetrahedron, which is coordinated by four Br ions. The unit cell parameters of compound 1 are, a = 16.6699 Å, b = 9.8056 Å, c = 16.7496 Å, α = 90°, β = 116.471°, γ = 90°, V = 2450.82 Å3. The Mn-Br bond lengths are in range of 2.4964(3)−2.5216(3) Å, and the Br-Mn-Br angles are in range of 105.98° to 111.88°. While at 380 K, it crystallizes in tetragonal space group P42/nmc with unit cell parameters of a = 9.1959 Å, b = 9.1959 Å, c = 15.738 Å, α = 90°, β = 90°, γ = 90°, V = 1330.8 Å3. The bond lengths and bond angles of [MnBr4]2- are almost the same as those at 200 K. But, as the temperature rises from 200 K to 380 K, the organic cations of compound 1 transform from an order state to a highly disorder state, which can be seen by the significant enhancement of the thermal ellipsoid model of compound 1 at 380 K.
At 200 K, all Br atoms in [MnBr4]2− structure have hydrogen bonds with the H of the adjacent Et3NCH2Cl, and also have weak bonds with Cl (Fig. S3 in Supporting information). These weak bonds lead to an ordered arrangement of [MnBr4]2− and [Et3NCH2Cl]+ in the stacked arrangement. The movement of the molecules is restricted by the rigid structure in an order state. Whereas at 380 K, disorder cations have higher kinetic degrees of freedom in the lattice because of thermal molecular motions. In addition to the significant change in cations, the corresponding distances of the nearest neighbor manganese ions increase slightly from 8.80 Å and 9.81 Å to 9.20 Å and 10.21 Å when the temperature increases from 200 K to 380 K (Fig. 1). This indicates a slight cooperative shift between the Mn2+ ions. From the detail structural comparison mentioned above, it is suggested that the order-disorder transition of the Et3NCH2Cl cations, as well as the relative shift of the tetrahedral [MnCl4]2− are the driving force for structural phase transition of the organic-inorganic hybrid compound from low temperature to high temperature [39]. Compared with the literature, it is found that the distance between adjacent nearest Mn ions change with the difference of NR4 (R = CH3CH2, CH3CH2CH2 and CH3CH2CH2CH2) amine. With the increase of C atom of R, the intermolecular hydrogen bond and inversion barrier increase for NR4, which may increase the phase transition temperature of the compound.
To better understand the structural change of the compound, temperature-variable PXRD was measured. As shown in Fig. S4 (Supporting information), the PXRD patterns of compound 1 does not change at 303 K and 323 K, but when the temperature is 353 K, there are some changes in the PXRD curve. The appearance of new peaks, as well as the change of the diffraction peaks indicate that the structure of compound 1 has changed.
DC magnetic measurements of compound 1 were performed in temperature range of 2–300 K under a DC field of 1000 Oe. As shown in Fig. 2, the χMT value is 4.46 cm3 K/mol at 300 K, which is slightly greater than the expected value of 4.375 cm3 K/mol for one isolated high spin Mn2+ ion. Upon cooling, the χMT value decreases slowly and reaches a minimum value of 3.77 cm3 K/mol at 2 K. The drop in χMT at the low temperature range is caused by weak antiferromagnetic interactions occurring among Mn2+ ions. The graph on the right shows the magnetization (M) versus magnetic field strength (H) at 1.8 K and 2.5 K. Within 2.5 T, the magnetization increases rapidly at 1.8 K, after which the magnetization curve flattens, reaching a maximum value of 4.68 NµB at 7 T. The curve at 2.5 K follows the same trend and its magnetization reaches a maximum of 4.65 NµB, which is below the expected saturation magnetization value of 5 NµB for mononuclear Mn2+. In order to understand the magnetic behavior better, DC susceptibilities plots were fitted using PHI program with Hamiltonian equation as follows:
|
|
(1) |
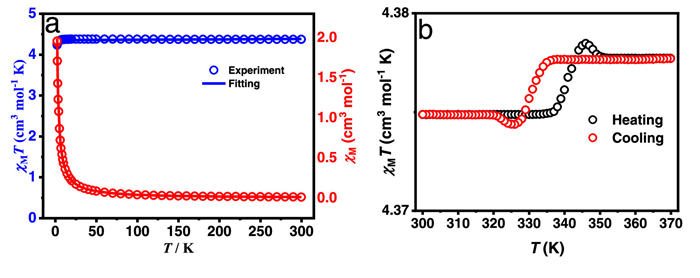
The best fitting gave parameters of D = 0.09 cm−1, g = 2.03 and TIP = 1.23 × 10⁻⁵ cm3/mol as shown by the curves in Fig. 2.
Since a phase transition happens in temperature range of 300–370 K, thus high temperature χMT vs. T during heating/cooling for compound 1 were measured to study the magnetic phase transition. As shown Fig. 2b, upon heating, the χMT value increases slowly before a fast increase at 336 K, reaches the maximum value of 4.3785 cm3 K/mol at 346 K. Then the χMT value decreases fast to 4.3777 cm3 K/mol between 346 K to 352 K with the increase of temperature. When the temperature is above 353 K, the χMT value remains unchange. While for cooling, the χMT value decreases slowly before a fast decrease at 338 K, reaches the minimum value of 4.374 cm3 K/mol at 326 K. Then the χMT value increases fast, reaches the maximum value of 4.375 cm3 K/mol at 318 K with the decrease of the temperature. Next, the value of χMT unchange with decreasing temperature. The magnetic transition temperatures of compound 1 are 346 K and 326 K, leading to a thermal hysteresis loop width of 20 K, which is due to the order-disorder transition of the cation, originated from the coordination geometry change of Mn ion.
During the phase transition, the permittivity changes obviously happen around the phase transition temperature. The permittivity of powder polycrystalline was measured (ε = ε' − iε", where ε' and ε" represent the real and imaginary parts, respectively) at different frequencies in temperature range of 320‒400 K [40]. As shown in Fig. S5 (Supporting information), compound 1 exhibits a distinct reversible dielectric anomaly during the heating-cooling process. During the heating-cooling cycle, the dielectric constant of compound 1 decreases rapidly around 400 K, and then keep a steady. The contrast ratio between the high dielectric state and the low dielectric state of compound 1 is 1.81. The switching of the dielectric response verifies the thermal stability of compound 1. According to the Langevin Debye formula, below the phase transition temperature, the dielectric constant is equal to C0, and its dielectric state belongs to LTP. In the LTP state, the structure of the crystal is completely ordered, thus the dielectric constant value is only related to ionic and electronic displacements. Near the phase transition temperature, compound 1 begins to undergo order-disorder transition, and the anion skeleton also begins to change disorderly. Thus, the sharp change near the phase transition may be due to the change in the orientation of its dipole moment. The sharp change of the phase transition temperature illustrates its potential application in dielectric switches. With the periodic change of temperature, the dielectric signal intensity after 5 cycles hardly changes from the initial value (Fig. 3), indicating that compound 1 possesses reversible dielectric switching properties. This phenomenon makes compound 1 an excellent candidate for dielectric switching materials.
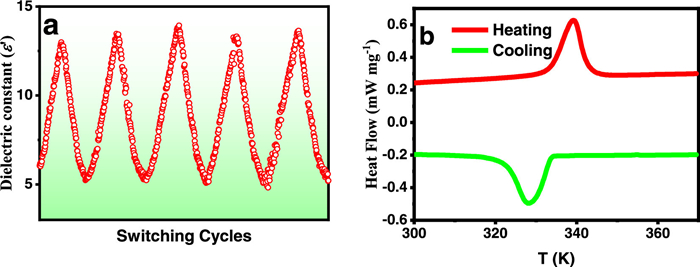
Differential scanning calorimetry measurements are conventional method for detecting phase transitions. The DSC curve shows a pair of thermal anomalies for compound 1 (Fig. 3). During the heating-cooling cycle, compound 1 exhibits endothermic/exothermic peaks at 339.19 K and 327.98 K with a thermal hysteresis wide of 11.21 K. These sharp peaks with large thermal hysteresis indicate that compound 1 undergoes a reversible first-order phase transition. The entropy change (ΔS) corresponding to compound 1 is 12.15 J mol−1 K−1. According to the Boltzmann equation ΔS = R ln(N), R is the gas constant, N is the ratio of the number of the respective geometrically resolvable orientations, which manifests the feature of the order-disorder phase transition of compound 1.
Excitation and emission spectra at room temperature were measured to study the optical properties of compound 1. The excitation (PLE) spectrum of the sample is between 300 nm and 425 nm. Two continuous strong peaks of 363 nm and 376 nm belong to 6A1g(S) → 4E1g(D) and 6A1g(S) → 4T2g(D) transitions, respectively, which are due to the d-d electronic transition of Mn2+ ion. The emission spectrum of compound 1 is shown in Fig. S6a (Supporting information). Under the irradiation of UV light, the emission peak of compound 1 appears at 518 nm, which indicates that compound 1 emits yellow green light under UV light (Fig. 4a). The absolute quantum yield (QY) is 69.34% for 1 at room temperature [41].
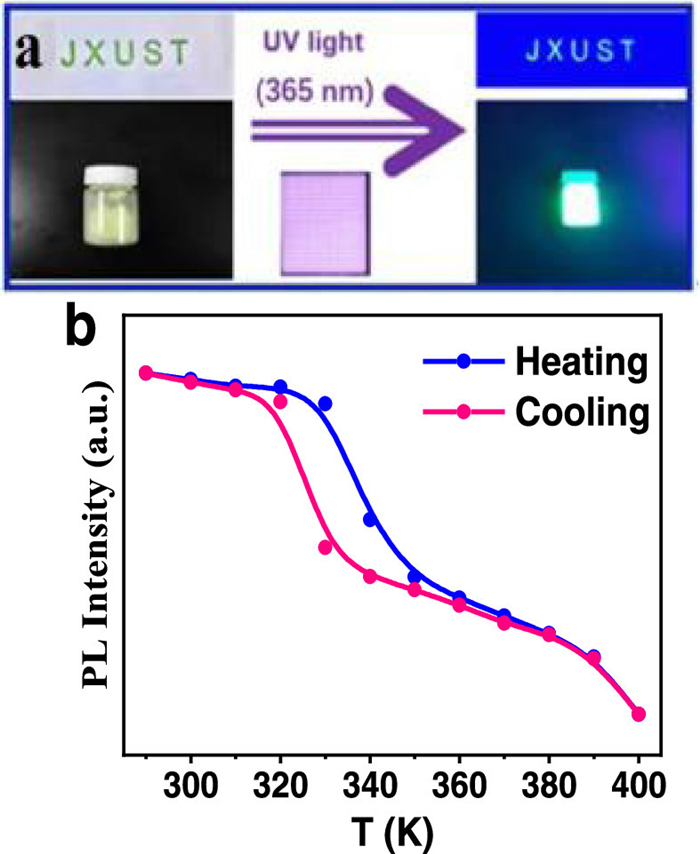
In order to understand the optical, dielectric and magnetic synergistic effect, the luminescence spectra of 1 were performed by heating and cooling between 290 K and 400 K with interval of 10 K. As shown in Fig. S6b (Supporting information), when heating the luminescence intensity decreases. While for cooling, the intensity increases, which makes the luminescence intensity versus temperature plots for a clear hysteresis loop (Fig. 4b) during the phase transition temperature. The hysteresis loop is not wide because the d-d transfer of Mn2+ ions have a weak effect on structure change. The phase transition caused by order–disorder change in cations does not cause a large change in the ligand-field splitting energy of Mn2+ ions in anions. Therefore, the phase transition provides a small effect on luminescence. However, the observed phenomenon shows a good synergistic effect of magnetic dielectric and luminescence within this compound.
In summary, a new compound [Et3NCH2Cl]2[MnBr4] was synthesized and characterized, which exhibits an ordered–disordered structural phase transition in different states at high and low temperature, and the structural phase transition leads to its dielectric anomaly. It is the dielectric signal intensity has almost no change after 5 cycles that with the phase transition changing periodically with temperature. This manifests that the compound has reversible dielectric switching properties. It also exhibits photoluminescence properties, with it being yellow transparent crystals under ambient light, and a bright yellow–green glow under ultraviolet light. Furthermore, compound 1 exhibits paramagnetic behavior. Compound 1 is luminescence, dielectric and magnetic synergetic switchable effects in a molecular compound, which provides new ideas for designing multifunctional materials.
The authors declare no conflict of interest.
This work was supported by the the National Natural Science Foundation of China (Nos. 21875093, 22161002 and 22105089), Natural Science Foundation of Jiangxi Province (Nos. 20224BAB214005, 20204BCJ22015 and 20202ACBL203001), and Jiangxi Provincial Key Laboratory of Functional Molecular Materials Chemistry (No. 20212BCD42018).
Supplementary material associated with this article can be found, in the online version, at doi:
G. Liu, J. Liu, Z. Sun, et al., Inorg. Chem. 55 (2016) 8025–8030. doi: 10.1021/acs.inorgchem.6b01143
M.A. Asghar, Z. Sun, T. Khan, et al., Cryst. Growth Des. 16 (2016) 895–899. doi: 10.1021/acs.cgd.5b01452
C. Chen, W.Y. Zhang, H.Y. Ye, Q. Ye, D.W. Fu, J. Mater. Chem. C 4 (2016) 9009–9020. doi: 10.1039/C6TC02166B
F.F. Wang, C. Chen, Y. Zhang, et al., J. Mater. Chem. C 3 (2015) 6350–6358. doi: 10.1039/C5TC01004G
M. Wuttig, N. Yamada, Nat. Mater. 6 (2007) 824–832. doi: 10.1038/nmat2009
B. Champagne, A.L. Plaquet, J.L. Pozzo, V. Rodriguez, F.D.R. Castet, J. Am. Chem. Soc. 134 (2012) 8101–8103. doi: 10.1021/ja302395f
W. Zhang, R.G. Xiong, Chem. Rev. 112 (2012) 1163–1195. doi: 10.1021/cr200174w
C. Xu, W.Y. Zhang, C. Chen, Q. Ye, D.W. Fu, J. Mater. Chem. C 5 (2017) 6945–6953. doi: 10.1039/C7TC02087B
D.W. Fu, W. Zhang, H.L. Cai, et al., Adv. Mater. 23 (2011) 5658–5662. doi: 10.1002/adma.201102938
D.W. Fu, H.L. Cai, Y. Liu, et al., Science 2013, 339 (6118) 425–428. doi: 10.1126/science.1229675
Q. Guo, W.Y. Zhang, C. Chen, Q. Ye, D.W. Fu, J. Mater. Chem. C 5 (2017) 5458–5464. doi: 10.1039/C7TC01520H
Z. Sun, J. Luo, S. Zhang, et al., Adv. Mater. 25 (2013), 4159–4163. doi: 10.1002/adma.201301685
Z.B. Hu, C.F. Wang, T.T. Sha, et al., Small Methods 6 (2022) 2200421. doi: 10.1002/smtd.202200421
G. Heger, D. Mullen, K. Knorr, Phys. Status Solidi A 35 (1976) 627–637. doi: 10.1002/pssa.2210350225
Z.Q. Liu, Y. Liu, Y. Chen, W.Q. Zhao, W.N. Fang, Chin. Chem. Lett. 28 (2017) 297–301. doi: 10.1109/ICDCM.2017.8001060
K. Wang, J.M. Liu, Z. Ren, Adv. Phys. 2009, 58 (4) 321–448. doi: 10.1080/00018730902920554
W. Eerenstein, N. Mathur, J.F. Scott, Nature 442 (2006) 759–765. doi: 10.1038/nature05023
V.V. Naik, S. Vasudevan, J. Phys. Chem. C 114 (2010) 4536–4543. doi: 10.1021/jp910300v
R. Ramesh, Nature 461 (2009) 1218–1219. doi: 10.1038/4611218a
Z. Sun, J. Luo, T. Chen, et al., Adv. Funct. Mater. 22 (2012) 4855–4861. doi: 10.1002/adfm.201201770
Y. Yu, M. Nakano, T. Ikeda, Nature 425 (2003) 145. doi: 10.1038/425145a
X.H. Lv, W.Q. Liao, P.F. Li, et al., J. Mater. Chem. C 4 (2016) 1881–1885. doi: 10.1039/C5TC04114G
S. Zeng, Z. Sun, C. Ji, et al., CrystEngComm 18 (2016) 3606–3611. doi: 10.1039/C6CE00194G
C. Ji, S. Li, F. Deng, et al., Phys. Chem. Chem. Phys. 18 (2016) 10868–10872. doi: 10.1039/C6CP01073C
A. Jana, S. Zhumagali, Q. Ba, A.S. Nissimagoudar, K.S. Kim, J. Mater. Chem. C 7 (2019) 26504–26512. doi: 10.1039/c9ta08268a
W. Li, C. Han, Y. Wang, H. Liu, J. Struct. Chem. 39 (2020) 31–35.
A. Sen, D. Swain, T.N. Guru Row, A. Sundaresan, J. Mater. Chem. C 7 (2019) 4838–4845. doi: 10.1039/c9tc00663j
P. Theato, B.S. Sumerlin, R.K. O'Reilly, T.H. Epps III, Chem. Soc. Rev. 42 (2013) 7055–7056. doi: 10.1039/c3cs90057f
P.P. Shi, Q. Ye, Q. Li, et al., Chem. Mater. 26 (2014) 6042–6049. doi: 10.1021/cm503003f
M.A.C. Stuart, W.T. Huck, J. Genzer, et al., Nat. Mater. 9 (2010) 101–113. doi: 10.1038/nmat2614
D.X. Liu, Z.H. Yu, X.X. Chen, W.X. Zhang, X.M. Chen, Chin. Chem. Lett. 34 (2023) 107310. doi: 10.1016/j.cclet.2022.03.033
O. Sato, Nat. Chem. 8 (2016) 644–656. doi: 10.1038/nchem.2547
E. Styczeń, Z. Warnke, D. Wyrzykowski, et al., Struct. Chem. 21 (2010) 269–276. doi: 10.1007/s11224-009-9577-y
S. Liu, L. He, Y. Wang, P. Shi, Q. Ye, Chin. Chem. Lett. 33 (2022) 1032–1036. doi: 10.1016/j.cclet.2021.07.039
K. Yosida, Phys. Rev. Lett. 106 (1957) 893–898.
J.A.M. Paddison, M.J. Gutmann, J.R. Stewart, et al., Phys. Rev. B 97 (2018) 014429. doi: 10.1103/PhysRevB.97.014429
X. Feng, Y.P. Shang, L.Y. Wang, et al., Chin. J. Struct. Chem. 40 (2021) 217–224. doi: 10.1007/978-981-13-7993-2_17
Y.Y. Luo, Z.X. Zhang, C.Y. Su, et al., J. Mater. Chem. C 8 (2020) 7089–7095. doi: 10.1039/d0tc00266f
D.C. Han, Z.X. Gong, N. Song, et al., Chem. Commun. 57 (2021) 11225–11228. doi: 10.1039/d1cc04751e
A.S. Tayi, A. Kaeser, M. Matsumoto, T. Aida, S.I. Stupp, Nat. Chem. 7 (2015) 281–294. doi: 10.1038/nchem.2206
A. Jana, S. Zhumagali, Q. Ba, A.S. Nissimagoudar, K.S. Kim, J. Mater. Chem. A 7 (2019) 26504–26512. doi: 10.1039/c9ta08268a

Figure 2 (a) Temperature dependence of χMT and χM for 1. (b) Field dependence of magnetization curves for 1, collected from 1.8 K to 2.5 K. Temperature dependence of χMT during heating/cooling for 1.

Figure 3 Reversible ε' switching of (a) dielectric curve and (b) DSC curve of compound 1.

 扫一扫看文章

扫一扫关注我们
 DownLoad:

 下载:
下载:

 下载:
下载: