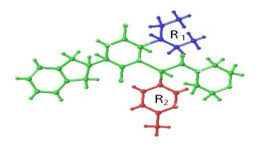
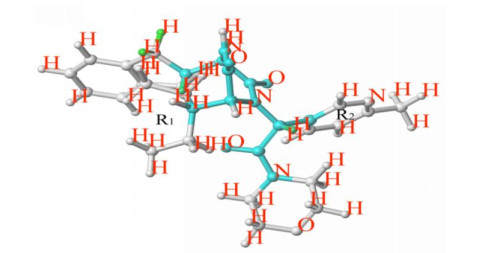
Figure 1.
Cutting style of sample 64

Preterm birth refers to those who give birth between 28~37 weeks after gestation. During this period, newborns are called preterm infants, whose weight ranges from 1000 to 2499 g. Studies show that preterm birth is the leading cause of infant disease and death[1], with about 15 percent of premature infants dying in the neonatal period and more than 75 percent of infant deaths related to preterm birth. Therefore, this problem that threatens the health of the next generation deserves researchers' attention and efforts.
Oxytocin can promote the contraction of uterine smooth muscle during childbirth, which can interact with oxytocin receptors in the body to get pregnant women to give birth. Oxytocin antagonist has the effect of inhibiting uterine contraction and delaying preterm labor. Therefore, oxytocin antagonists have attracted more and more attention in the treatment of preterm labor. Atosiban is currently the only OT antagonist approved by the food and drug administration (FDA) in the United States for clinical observation during pregnancy. Atosiban has been shown to be effective in blocking uterine activity in different animal species (macaques, baboons, guinea pigs and rats). However, because atosiban is a cyclo-9 peptide, it must be given intravenously and cannot be taken orally, which makes it unsuitable for long-term maintenance therapy[2]. Therefore, scientists are still trying to find a more suitable oxytocin antagonist. After screening and clinical trials, only Retosiban and Nolasiban have more potential as oxytocin antagonists to treat premature delivery. Retosiban is a 2,5-diketopiperazine derivatives[3]. Therefore, the quantitative structure-activity relationship of 130 2,5-diketopiperazine derivatives will be studied to provide a useful theoretical basis for preterm delivery treatment.
Three-dimensional quantitative structure-activity relationship (3D-QSAR) is a statistical method that combines three-dimensional structure information with physical and chemical properties, structural parameters and activity[4]. The common methods used in 3D-QSAR are CoMFA (comparative molecular field analysis), CoMSIA (comparative molecular similarity indices analysis) and Topomer CoMFA (topomer comparative molecular field analysis). Topomer CoMFA is a combination of Topomer and CoMFA technology with the advantages to be fast, efficient and easy to use. Hologram QSAR (HQSAR) is a kind of QSAR research method between 2D-QSAR and 3D-QSAR. This method is fast in calculation and convenient in application[5, 6]. In this paper, Topomer CoMFA and HQSAR were used to study the quantitative structure-activity relationship of 130 2,5-diketopiperazine derivatives, and the molecular activity was analyzed by three-dimensional isopotentiometric and colorcoded maps, then the new molecules were designed on the basis of these two methods.
The structure and activity of 130 2,5-diketopiperazine derivatives in this experiment are all derived from literatures[7-12]. Quantitative structure-activity relationships of 2,5-diketopiperazine derivatives have been studied by using CoMFA and CoMSIA in the literature. The emphasis is to accurately predict the biological activities of drug compounds. In this paper, 130 2,5-diketopiperazine derivatives were modeled using Topomer CoMFA and HQSAR quantitative structure-activity relationships, and a stable 3D-QSAR model was established. The relationship between structure and biological activity of the compounds was investigated. Based on this model, new drugs with high activity for preterm delivery were designed. The 30 representative molecular structures and their activity values are listed in supplementary Table S1. The activity values in this experiment are expressed by pKi (–lgKi). Ki value refers to the concentration of inhibitor when 50% inhibition effect is detected. We divide the whole data set of derivatives into two parts: a training set of 99 compounds and a test set of 31 compounds, used to build a 3D-QSAR model and to verify its predictive ability, respectively.
The Sketch module in SYBYL 2.0 was used to construct 130 molecular structures of 2,5-diketopiperazine derivatives. All molecules were optimized using tripos force field[13] and gradient descent method with an energy charge of 0.005 kcal/mol. Partial charges for all the molecules were added using the Gasteiger-Hückel method[14]. The maximum iteration coefficient was 1000, and the other parameters were defaulted by Sybyl2.0-X.
The key of Topomer CoMFA modeling is the way of molecular cutting. In this study, the 64 molecules with the highest activity in the training set was cut as a template to obtain group R1 (blue), group R2 (red) and core (Fig. 1). Molecules in other training centers are automatically identified and cut in this way. Unrecognized molecules need to be cut manually. After cutting, the fragment conformation is adjusted according to empirical rules to generate Topomer model. Generally, when cross-validated q2 > 0.5 and non-cross-validated r2 > 0.6, the model is an ideal Topomer CoMFA model[15]. The electrostatic and stereoscopic parameters of the molecule are taken as independent variables, and the negative logarithm of Ki (pKi) is taken as the dependent variable of the model. Then partial least squares (PLS)[16]was used to fitted the model. This method can effectively verify the internal prediction ability and external prediction ability of the model.
Using SYBYL-HQSAR module to generate molecular hologram, the process is as follows. Firstly, each molecular structure in the training set is divided into molecular fragments containing a certain number of atoms. The structure types contained in the fragments are called fragmentation discrimination parameters. The commonly used fragmentation discrimination parameters include: atoms (A), bonds (B), connections (C), hydrogen atoms (H), chirality (Ch), hydrogen-bonded donors or acceptors (DA), etc[17]. Among these parameters, A is used to distinguish the kinds of atoms, B to distinguish the differences of chemical bonds formed between atoms, C to distinguish the hybridization state of atoms in fragments, Ch to display the stereochemical information of chirality of atoms and chemical bonds in fragments, and DA to show the donor or acceptor of hydrogen bonds in fragments. The number of fragments is called the fragment size parameter which is generally specified by the minimum atomic number N and the maximum atomic number M. Among them, the smaller molecular fragments are 1~3, the medium ones are 4~7 and those larger are 3~10. Then, using the algorithm of cyclic redundancy check (cyclicredundancy check algorithm, CLC) to map each molecular fragment of 0~231 pseudorandom integer, each molecule can be represented as an integer string of a certain length, and then converted into an integer string of the same length by Hashing method that is molecular holography. HQSAR module provides 12 default prime numbers (53~401)[18] for the holographic length by adjusting the parameters of fragment size, fragment structure type, holographic length, and so on. In order to obtain different molecular holograms, the partial least-squares (PLS) method was used for linear regression analysis and the left-one method (LOO) for the cross-validation. The cross-validation correlation coefficient q2 was calculated and the number of principal components when q2 is the largest is the best principal component number (NOC).
The best principal component number is used to construct the model by non-cross validation PLS analysis. The prediction ability, robustness and fitting ability of the model are evaluated by taking into account the parameters of q2, r2 and SEE of the model. The final model of HQSAR is obtained and the color codes of the HQSAR model are obtained. It directly reflects the contribution of atoms or groups to the activity of compounds and obtains useful information for molecular modification.
According to the same rules as Topomer CoMFA, we divide 130 compounds into 99 test sets and 31 training sets to conduct the HQSAR modeling, which is more conducive to compare the modelling results of topomer CoMFA and HQSAR.
Molecular screening was carried out using the Topomer Search technology, an extremely fast ligand-based virtual screening tool that has been demonstrated to be effective for both lead hopping and scaffold hopping. Topomer Search uses topomeric fields in addition to pharmacophoric properties to compare the molecules. Topomer Search allows screening for whole molecules, R groups, or scaffolds using topomer-based similarity. And we also use Topomer CoMFA QSAR models as queries to search for R groups to optimize the activity. The principle is explained as follows: the molecules in the database (ZINC) are incised into fragments, which are compared with the topomer similarity of R groups of the training molecules. Then the Topomer CoMFA model is used to predict their contributions to activity. Finally, a series of R groups will be obtained. In this study, Topomer Search was employed to search for R groups with relatively high activity contribution from drug-like groups in the ZINC (2012)[19] database (130 000 compounds). Topomer distance was set as 185 to evaluate the binding degree, and other parameters were defaulted by Sybyl2.0-X.
Molecular docking studies[20] were performed using Surflex-Dock of Sybyl2.0-X. Surflex-Dock uses an empirical scoring function and a patented search engine to dock ligands into a protein's binding site. The binding pocket is presented by the protomol, an idealized representation of a ligand that makes every potential interaction with the binding site. The protomol can be generated automatically or defined on the basis of a cognate ligand or known active site. Surflex-Dock[21] is particularly successful at eliminating false-positive results and can, therefore, be used to narrow down the screening pool significantly, while still retaining a large number of active compounds. In this study, Surflex-dock technology in SYBYL-X 2.0 was used to study the interaction mode and mechanism of the newly designed molecule with T2R-TTL-Nocodazole three-dimensional crystal (5CA1). Before docking, it is necessary to pretreat protein macromolecules by hydrogenation, charge, extraction of original ligands, removal of water molecules and other residues and end residues, and then verify the feasibility of the prototype molecule and use it as a reference. After that, the newly designed molecule is docked with protein crystals. The scoring function was observed to screen out better molecules.
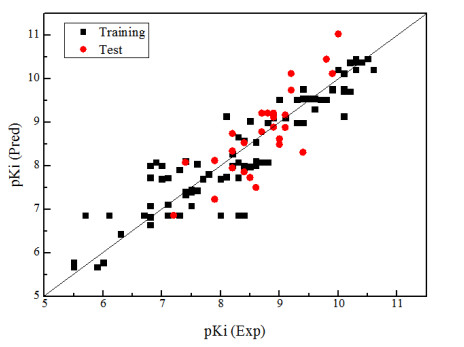
In this experiment, firstly, the 64 molecule with the highest activity was selected as the template molecule from 99 ones. Then the molecule is cut by "2" with the cutting method shown in Fig. 1 and the cutting results listed in Table 1, in which the principal component number (N) is 7, the standard estimation errorsee (SEE) 0.588, the cross-validated coefficient q2 0.710 and the non-cross-validated coefficient r2 0.834. The results show that the model can obtain reliable results, which can not only accurately predict but also retain the core skeleton of 2,5-diketopiperazine derivatives. Fig. 2 is a linear regression diagram of the experimental and predicted values of 2,5-diketopiperazine derivatives molecular training and test groups, showing that the experimental and predicted values are uniformly distributed near the 45º line, which indicates better prediction results for this model.
 DownLoad:
CSV
DownLoad:
CSV
| Cutting method | q2 | r2 | N | F | SEE | Intercept |
| "2" | 0.710 | 0.834 | 7 | 65.338 | 0.558 | 4.83 |
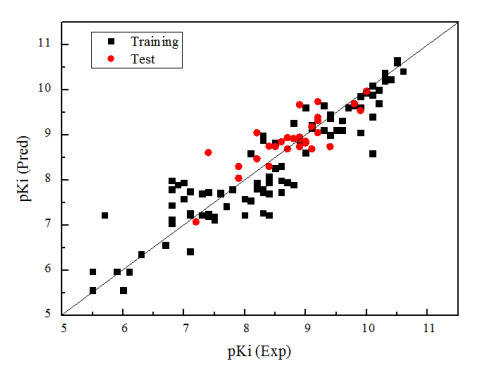
Firstly, the HQSAR model combines the default debris length (4~7) and different debris discrimination parameters. The effects of these parameters combination on the model are investigated, and the results are shown in supplementary Table S2 which shows that good modelling results can be obtained by using debris discrimination parameter B/C. The statistical parameters q2 and r2 of HQSAR model are 0.673 and 0.811, and SEE is 0.564. The optimum principal component number (N) is 6, and the optimum holographic length (HL) is 307. In order to build a better HQSAR model, different debris lengths are selected on the basis of the optimal debris discrimination parameter (B/C), as shown in the supplementary Table S3 that suggests the modelling results are best when the fragment length is 4~11. The statistical parameters q2, r2, SEE, N and HL of the HQSAR model are 0.700, 0.815, 0.574, 6 and 353 correspondingly. Fig. 3 is the correlation diagram between the experimental and predicted values of the compounds in the training and test sets. We can see that all the samples are evenly distributed near the 45º line, which proves the model can better characterize the relationship between the molecular structure and biological activity.
The three-dimensional contour plots of the Topomer CoMFA model are shown in Figs. 4a~4d with sample 64 as the reference structure. The contour maps provide information on factors affecting the activities of the molecules. This is particularly important when increasing or reducing the activity of a compound by changing its molecular structure.
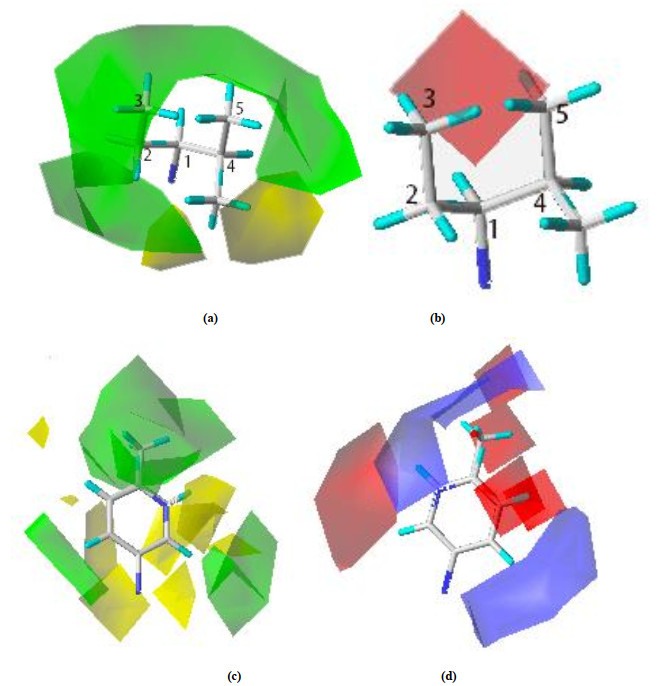
The steric field contours are shown in yellow and green, while the electrostatic field contours in red and blue (Fig. 4). The green contours represent regions where the large or bulky substituent is favorable for the activity. The opposite is true for the yellow contours. The red isopleths indicate regions where the negative-charged substituent is favorable for the activity, and the blue isopleths indicate regions where an increase of the positive-charged substituent enhances the activity.
As shown in Fig. 4a, a large green contour overlapping the plane of the 2-, 3-, 4- and 5-positions of the isohesyl of compound 64 indicates that the bulky substituent is preferred in this region. For instance, molecules 42 with methyl at 4- and 5-positions of the isohesyl have less activity than molecule 64 with ethyl at this position. Meanwhile, a large yellow contour over-lapping the plane of the methyl group of 4-position of isohesyl of compound 64 suggests that the bulky substituent is not preferred in this region. For example, molecules 38 have lower activity compared with molecule 64. In Fig. 4b, there is a large red contour around the 3- and 5-positions of the isohesyl, which suggests that the negative-charged substituent at the 3- and 5-positions may favour the activity. For example, the activity of molecules 31 decreases due to methyl instead of ethyl at the 3-position.
As the steric field of R2 group shown in Fig. 4c, the green contour near the 4-position of the phenyl ring indicates that the bulky substituent in these positions may be favorable for the activity, like molecule 19 with H at the 4-position of phenyl ring, which has lower activities. Meanwhile, a large yellow contour over-lapping the plane of the 2-position of phenyl ring of compound 64 suggests that the bulky substituent is not preferred in this region. For example, molecule 67 has lower activity compared with molecule 64. The blue contour close to the 2- and 5-positions (Fig. 4d) explains the positive charge substituent at the 2- and 5-positions of the phenyl ring would increase the activity. It can show the fact that the activity of molecule 55 with methyl at the 2- and 5-positions decreases significantly compared with molecule 64. Meanwhile, the red contour close to the 4-position (Fig. 4d) illustrates the electronegative substituent at the 4-position of phenyl ring would increase the activity. For example, the activity of molecules 64 with H at the 4-position is higher than that of molecule 58 with -CH3 at the same position.
Fragments that control 2,5-diketopiperazine derivatives activity are further analyzed by HQSAR color coding and fragment analysis (Fig. 5). The most active compound 64 serves as a template. It is found that having some green and blue color atoms on the phenyl ring and -CHRCO group indicates a positive contribution for oxytocin inhibitor activity. The nitrogen atoms in this phenyl ring and -CHRCO group along with three -C=O positively contribute to the biological activity. This HQSAR color coding also indicates the importance of phenyl and -CHRCO group for inhibiting activity. Meanwhile, the atoms in the R1 positions and other substituents in the compound appear white, indicating that they make a neutral contribution to biological activity and can be replaced by a substituent that produces a more potent inhibitory effect. By comparison, the results of this method and the Topomer CoMFA results are consistent.
The results of molecular screening using Topomer Search technology are evaluated by the TOPDIST and the contribution values of R-groups (TOPCOMFA_R). Under normal circumstances, we give priority to TOPCOMFA_R in the same limit of TOPDIST. In this study, 7 R1 and 8 R2 groups with higher TOPCOMFA_R than that of template molecule were selected.
Seven R1 and eight R2 groups were used to replace the R1 and R2 of sample 64 alternatively. Fifty-six new molecules could be formed by their alignment and combination. Then these molecules were optimized and their activity was further predicted by Topomer CoMFA model. Finally, 50 molecules with higher activity than the original template molecule were retained. The analysis of 50 new compounds was carried out. It is shown that all the results are consistent with the 3D contour of Topomer CoMFA model. Molecular structure and predicted activity are shown in the supplementary Table S4.
Surflex-dock technique in SYBYL-X 2.0 was used to study the interaction mode and mechanism of the newly designed molecule with T2R-TTL-Nocodazole three-dimensional crystal (5CA1). The scoring function is observed to screen out the better molecule. These scoring functions generally include total-score, crash, polar and C-score. The higher total-score score, the better. The output constellation higher than 6 is judged to be a better output constellation. The closer the crash to 0, the better; and the larger polar, the better. The C-score is 5 and greater than 4, indicating the docking result and experiment. In general, the more negative, the stronger the characterization bond, and the greater the energy required to break a bond. In addition, if the binding free energy is positive, the bonding can not be spontaneously formed. Therefore, it can be concluded that the greater the negative value of the combined free energy, the higher the biological activity and the greater the interaction force with the ligand. Based on these criteria, we selected the best results for the docking results of molecules 1-2, 1-4, 1-7 and 3-1 for analysis.
In order to verify whether 5CA1 can be docked, the crystal structure extracted from the protein macromolecule is re-inserted into the eutectic ligand. Figs. 6a and 6b show the docking results of the re-coordinated ligand. As can be seen from Fig. 6a, ligands are surrounded by residues D/Leu192, D/Asn195, D/Asp161, D/Met164, D/Ile163, etc. Meanwhile, key residues Asp147 and THR196 interact with inhibitors via hydrogen bonds (Fig. 6b). Some main docking parameters are total_score = 6.15, crash = –0.1986 and polar = 2.2256. The results show that 5CA1 can dock with newly designed molecules.
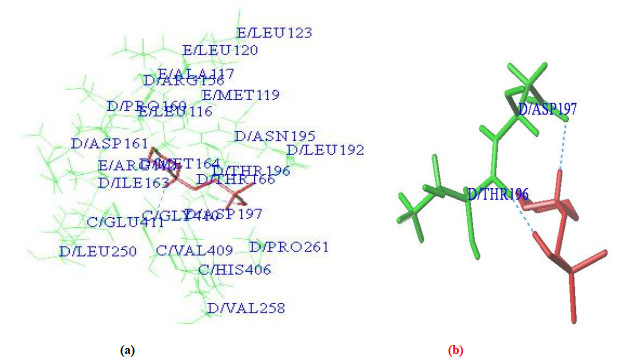
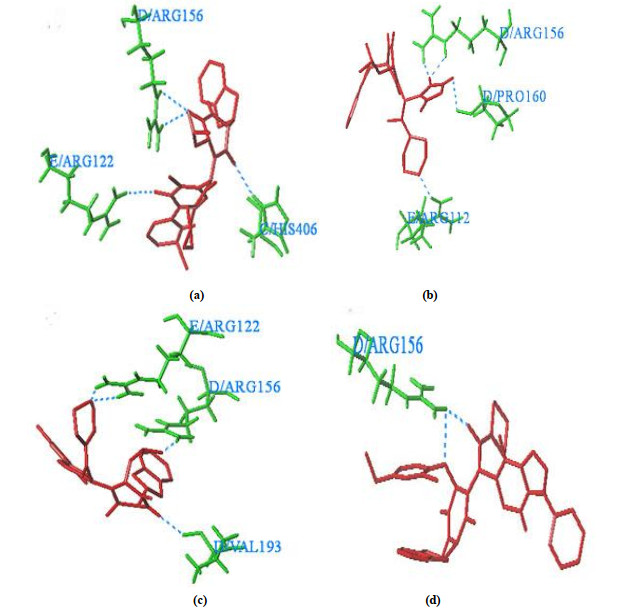
Fig. 7 is the result of the docking of the newly designed molecule. Fig. 7a is the molecular docking diagram of the newly designed molecules 1 and 2. It can be seen from the diagram that four hydrogen bonds are formed between ligand and amino acid residues. Total-score, crash, polar and C-score are 7.1132, –2.2781, 2.4897 and 5 respectively. Fig. 7b is a molecular docking diagram of the newly designed molecules 1~4. It can be seen from the diagram that four hydrogen bonds are formed between ligands and the amino acid residues. Total-score, crash, polar and C-score are 7.8773, –1.6046, 3.6858 and 5, respectively. Fig. 7c is a molecular docking diagram of the newly designed molecules 1~7. Four hydrogen bonds are formed between ligands and amino acid residues. Total-score, crash, polar and C-score are 6.2400, –3.5091, 1.8163 and 5, respectively. Fig. 7d is a molecular docking diagram of the newly designed molecule 3-1. The ligand and amino acid residues form two hydrogen bonds. Total-score, crash, polar and C-score are 7.5987, –3.3859, 1.0799 and 5, respectively.
2.5-Diketopiperazine derivative is considered to be an effective oxytocin inhibitor. In this study, 130 2.5-diketopiperazine derivatives were studied by Topomer CoMFA and HQSAR methods, and a three-dimensional QSAR model was established. The models established by Topomer CoMFA and HQSAR both validate that the training set has good external prediction ability and stability. By comparing the analysis results of Topomer CoMFA and HQSAR, we can see that the former has better prediction ability than the latter. QSAR uses mathematical models to describe the relationship between molecular structure and some biological activity of the molecules. The basic assumption is that the molecular structure of a compound contains information about its physical, chemical and biological properties, which further determine its biological activity. Furthermore, the data of molecular structure and properties of compounds should be related to their biological activities to some extent. Therefore, the better QSAR modeling results can show that these compounds have a better effect on the efficacy. Then, the Topomer search module was used to find some R1 and R2 groups with better contribution value in ZINC database. 65 new molecules were designed according to the groups found, and their activities were predicted. The activity of 50 molecules was higher than that of the most active molecules in the original data set. Finally, four of the newly designed molecules were docked. The docking results indicated that the hydrogen bonding interactions between ligands and D/Arg156 and E/Arg122 of the receptor had great influence on the binding environment. The present work provides references to drug design for oxytocin inhibitors. Meanwhile, it is necessary to verify the activity of the newly designed molecules combined with the pharmaceutical chemistry experiments.
Cruvinel, V. R.; Gravina, D. B.; Azevedo, T. D. Prevalence of dental caries and caries-related risk factors in premature and term children. Braz. Oral. Res. 2010, 24, 329–335. doi: 10.1590/S1806-83242010000300012
Jójárt, B.; Martinek, T. A.; Márki, Á. The 3D structure of the binding pocket of the human oxytocin receptor for benzoxazine antagonists, determined by molecular docking, scoring functions and 3D-QSAR methods. J. Comput. Aid. Mol. Des. 2005, 19, 341–356. doi: 10.1007/s10822-005-7137-0
Liddle, J.; Allen, M. J.; Borthwick, A. D. The discovery of GSK221149A: a potent and selective oxytocin antagonist. Bioorg. Med. Chem. Lett. 2008, 18, 90–94. doi: 10.1016/j.bmcl.2007.11.008
Heravi, Y. E.; Sereshti, H.; Saboury, A. A. 3D QSAR studies, pharmacophore modeling, and virtual screening of diarylpyrazole-benzenesulfonamide derivatives as a template to obtain new inhibitors, using human carbonic anhydrase II as a model protein. J. Enzyme. Inhib. Med. Chem. 2017, 32, 688–700. doi: 10.1080/14756366.2016.1241781
Cheng, Y.; Mei, Z.; Tung, C. H. Studies on two types of PTP1β inhibitors for the treatment of type 2 diabetes: hologram QSAR for OBA and BBB analogues. Bioorg. Med. Chem. Lett. 2010, 20, 3329–3337. doi: 10.1016/j.bmcl.2010.04.033
Tong, J.; Shan, L.; Qin, S. QSAR studies of TIBO derivatives as HIV-1 reverse transcriptase inhibitors using HQSAR, CoMFA and CoMSIA. J. Mol. Struct. 2018, 1168, 56–64. doi: 10.1016/j.molstruc.2018.05.005
Borthwick, A. D.; Davies, D. E.; Exall, A. M. 2,5-Diketopiperazines as potent, selective, and orally bioavailable oxytocin antagonists 2-synthesis, chirality, and pharmacokinetics. J. Med. Chem. 2005, 48, 6956–6969. doi: 10.1021/jm050557v
Wyatt, P. G.; Allen, M. J.; Borthwick, A. D. 2,5-Diketopiperazines as potent and selective oxytocin antagonists 1: identification, stereochemistry and initial SAR. Bioorg. Med. Chem. Lett. 2005, 15, 2579–2582. doi: 10.1016/j.bmcl.2005.03.045
Borthwick, A. D.; Davies, D. E.; Exall, A. M. 2,5-Diketopiperazines as potent, selective, and orally bioavailable oxytocin antagonists. 3. Synthesis, pharmacokinetics, and in vivo potency. J. Med. Chem. 2006, 49, 4159–4170. doi: 10.1021/jm060073e
Borthwick, A. D.; Liddle, J. The design of orally bioavailable 2,5-diketopiperazine oxytocin antagonists: from concept to clinical candidate for premature labor. Med. Res. Rev. 2011, 31, 576–604. doi: 10.1002/med.20193
Borthwick, A. D.; Liddle, J.; Davies, D. E. Pyridyl-2,5-diketopiperazines as potent, selective, and orally bioavailable oxytocin antagonists: synthesis, pharmacokinetics, and in vivo potency. J. Med. Chem. 2012, 55, 783–796. doi: 10.1021/jm201287w
Yang, M.; Luo, J. H.; Zeng, Z. M. In silico profiling the interaction mechanism of 2,5-diketopiperazine derivatives as oxytocin antagonists. J. Mol. Graph. 2019, 89, 178–191. doi: 10.1016/j.jmgm.2019.03.003
Clark, M.; Cramer, R. D.; Opdenbosch, N. V. Validation of the general purpose TRIPOS 5.2 force field. J. Comput. Chem. 2004, 10, 982–1012.
Caballero, J.; Saavedra, M.; Fernández, M. Quantitative structure-activity relationship of rubiscolin analogues as delta opioid peptides using comparative molecular field analysis (CoMFA) and comparative molecular similarity indices analysis (CoMSIA). J. Agric. Food. Chem. 2007, 55, 8101–8104. doi: 10.1021/jf071031h
Jilek, R. J.; Cramer, R. D. Topomers: a validated protocol for their self-consistent generation. J. Chem. Inf. Comput. Sci. 2004, 35, 1221–1227.
Clark, M.; Cramer, R. D.; Opdenbosch, N. V. Validation of the general purpose tripos 5.2 force field. J. Comput. Chem. 2010, 10, 982–1012.
Bhargava, S.; Adhikari, N.; Amin, S. A. Hydroxyethylamine derivatives as HIV-1 protease inhibitors: a predictive QSAR modelling study based on Monte Carlo optimization. SAR. QSAR. Environ. Res. 2017, 28, 1–18. doi: 10.1080/1062936X.2016.1264468
Winkler, D. A.; Burden, F. R. Holographic QSAR of benzodiazepines. QSAR. Comb. Sci. 2015, 17, 224–231. doi: 10.1021/co5001579
Irwin, J. J.; Teague, S.; Mysinger, M. M. ZINC: a free tool to discover chemistry for biology. J. Chem. Inf. Model 2012, 52, 1757–1768. doi: 10.1021/ci3001277
Chen, B.; Han, J.; Wang, Y. Separation, enrichment and determination of ciprofloxacin using thermoseparating polymer aqueous two-phase system combined with high performance liquid chromatography in milk, egg, and shrimp samples. Food. Chem. 2014, 148, 105–111. doi: 10.1016/j.foodchem.2013.10.011
Jain, A. N. Surflex: fully automatic flexible molecular docking using a molecular similarity-based search engine. J. Med. Chem. 2003, 46, 499–511. doi: 10.1021/jm020406h

Figure 4 3D contour of Topomer CoMFA model. (a) Steric field map of R1; (b) Electrostatic field map of R1; (c) Steric field map of R2; (d) Electrostatic field map of R2

Figure 6 Docking result of the redocked ligand. (a) Dock result; (b) Hydrogen bond interaction (The ligand is represented by sticks; The amino acid residues are represented by green lines or green sticks; The hydrogen bonds are represented by blue lines)

Figure 7 (a) Hydrogen bonding between molecules Nos. 1 and 2 and 5CA1; (b) Hydrogen bonding between molecule Nos. 1-4 and 5CA1; (c) Hydrogen bonding with molecules 1~7 and 5CA1; (d) Hydrogen bonding with molecule Nos. 3-1 and 5CA1 (Green bar indicates amino acid residue, and blue dotted lines show the hydrogen bonds)
Table 1. Statistical Results of the Topomer CoMFA
| Cutting method | q2 | r2 | N | F | SEE | Intercept |
| "2" | 0.710 | 0.834 | 7 | 65.338 | 0.558 | 4.83 |
 下载: 导出CSV

 扫一扫看文章

扫一扫关注我们


