Scheme 1.
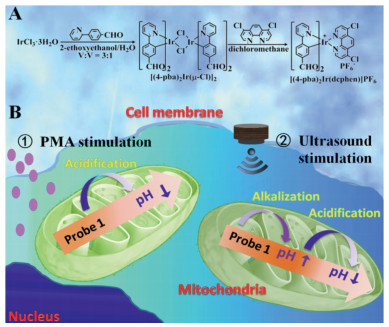
(A) Synthetic route of probe 1. (B) Schematic representation of PL imaging intracellular pH fluctuations under external stimulation using probe 1.
pH-responsive aldehyde-bearing cyclometalated iridium(Ⅲ) complex for tracking intracellular pH fluctuations under external stimulation
Manping Qian , Danyang Zhang , Hetong Qi , Xuebing Yang , Guanjun Yin , Chengxiao Zhang , Jianzhong Guo , Honglan Qi

Intracellular pH undertakes critical functions in various biological and pathological processes [1-4]. There exists a wide pH range in different subcellular compartments of eukaryotic cells and diverse prokaryotic species [5]. Variation of pH in cells can result in many diseases, such as neurodegenerative diseases [6], Reye's syndrome cancers [7], and cardiovascular diseases [8]. Therefore, H+ is one of the most important targets in vivo and real-time monitoring intracellular pH fluctuations is very important for understanding physiological and pathological processes [9].
Fluorescence methods are one of most powerful tools for pH sensing owing to their high sensitivity and good spatiotemporal resolution [10-13]. A series of fluorescent probes for pH detection have been reported, such as pH-sensitive green fluorescent protein mutants [14], organic compounds [15, 16], metal complexes [17, 18], and nanomaterials [19-21]. Some of them were limited in poor photostability, or poor biocompatibility, or slow response time. To real-time track intracellular pH fluctuations, fluorescent probes with good photostability, lower toxicity and fast response time are pressing required [22].
Cyclometalated iridium(Ⅲ) complexes have received increasing attention in pH assay within neutral [17, 18, 23] or weak acidic [24, 25] or extreme acidic [26] range due to their high photoluminescence (PL) efficiencies, large Stokes shifts, high photostability and excellent color tuning capability. pH-responsive iridium(Ⅲ) complexes usually incorporate carboxyl [17], aniline [18, 24], morpholine [23], pyridine [25], and other nitrogenous heterocyclic substituents [26] within main ligands or ancillary ligands. For example, Zhang et al. [17] developed four iridium(Ⅲ) complexes with benzimidazole and carboxyl groups as pH-responsive groups for tracking mitochondrial pH fluctuations during mitochondrial dysfunction. Our group reported one iridium(Ⅲ) complex with carboxyl group as pH-responsive group for PL and electrogenerated chemiluminescence detection of pH under acidic conditions [27]. Aldehyde group is the most common functional group in iridium(Ⅲ) complexes for sensing or labeling [28-30]. However, there is no report on the aldehyde-bearing iridium(Ⅲ) complexes as pH-responsive probe for monitoring intracellular pH fluctuations under external stimulation.
Here, we report the first observation of one new pH-responsive iridium(Ⅲ) complex containing aldehyde group at the 4-position of 4-(2-pyridyl) benzaldehyde (4-pba) ligand for imaging and tracking intracellular pH fluctuations under external stimulation (Scheme 1). The structure of the iridium(Ⅲ) complex, [(4-pba)2Ir(dcphen)]PF6 (probe 1), is shown in Scheme 1A, in which 4-pba was used as main ligand and 4, 7-dichloro-1, 10-phenanthroline (dcphen) was used as ancillary ligand. The photophysical behaviors of probe 1 were investigated in this work. The good photostability, biocompatibility and high cell permeability of probe 1 prompt us to utilize it to real-time image and track pH fluctuations in HeLa cells under external stimulation (Scheme 1B).
The probe 1 was synthesized by using 4-pba as main ligand and dcphen as ancillary ligand with a yield of 65%. The probe 1 was successfully characterized by 1H NMR (Fig. S1 in Supporting information), 1H–1H correlation spectroscopy NMR spectra (Fig. S2 in Supporting information) and mass spectrum (Fig. S3 in Supporting information). The solubility of [(4-pba)2Ir(dcphen)]PF6 was checked in Britton-Robinson (BR) buffer-DMSO (v:v = 99:1) at pH 4.30 [31]. BR buffer-DMSO (v:v = 99:1) was chosen as buffer solution because of its wide buffer range (1.81–11.92) and the probe 1 stock solution (1 mmol/L) in DMSO. The result indicates that solubility of 35 µmol/L is obtained for [(4-pba)2Ir(dcphen)]PF6 (Fig. S4 in Supporting information).
The feasibility of the designed probe 1 for pH detection was studied in BR buffer-DMSO (v:v = 99:1) solution at different pH values. Fig. 1A shows the UV–vis absorption spectra of probe 1 at pH 1.81 and 6.81. Similar absorption waves at 303, 321, 374 and 420 nm were obtained, as typical characterization for iridium(Ⅲ) complexes [17, 27]. Strong absorption bands below 330 nm and weak absorption bands above 330 nm were assigned to the allowed (π-π*) transitions of the ligands, and singlet and triplet MLCT transitions, respectively. At pH 6.81, the probe 1 exhibits an intense, broad and featureless orange emission with maximum wavelength at 587 nm. When the pH is decreased from 6.81 to 1.81, the maximum PL wavelength is slightly blue-shifted from 587 nm to 576 nm while the PL intensity gradually decreased (Fig. 1B). The quantum yield of probe 1 was measured to be 6.50% at pH 6.81 (587 nm) and 1.30% at pH 1.81 (576 nm) in air-saturated BR buffer-DMSO (v:v = 99:1).
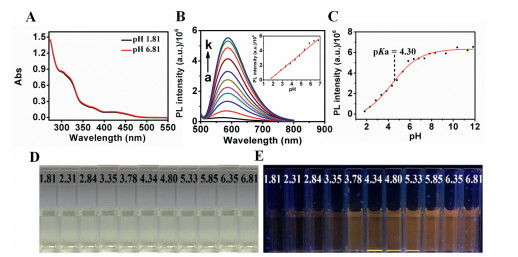
A plot of PL intensity at maximum wavelength vs. pH is linear in the range from 1.81 to 6.81 (R = 0.9965, Fig. 1B). The pKa of probe 1 is 4.30 ± 0.04 (Fig. 1C) calculated using Henderson-Hasselbalch equation (Eq. 1) [32]:
|
|
(1) |
where I is the PL intensity at maximum wavelength. Although there is no obvious change in the bright field images (Fig. 1D), the changes of PL emission of probe 1 at pH 6.81 to 1.81 can be easily visual under UV light (Fig. 1E).
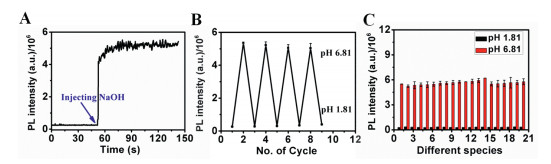
The response time was tested by adding 0.15 mol/L NaOH into BR buffer-DMSO (v:v = 99:1, pH 1.81) containing 10 µmol/L probe 1. The PL intensity increased greatly and kept stable within 25 s (Fig. 2A). The probe also shows good reversibility between pH 1.81 and pH 6.81 (Fig. 2B). The selectivity of probe 1 to pH was examined at pH 6.81 and pH 1.81 over possible interference species, including Na+, K+, Ca2+, Fe3+, Al3+, Zn2+, Pb2+, Mg2+, Co2+, Mn2+, Cr3+, Cd2+ and Hg2+, glucose, valine, leucine, arginine, DL-methionine and serine. As shown in Fig. 2C, at two pH values, there are not obvious changes of PL intensity for the studied ions and biologically species. Therefore, fast response time, good reversibility and excellent selectivity of probe 1 were obtained for pH detection.
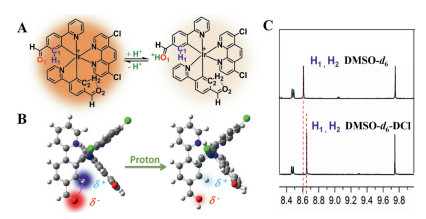
In order to understand the possible sensing mechanism of probe 1 to pH, following experiments were done. 1H NMR experiments were carried out at different pH values by adjusting pH of probe 1 solution in DMSO-d6 using DCl. Upon addition of DCl to the DMSO-d6 solution of probe 1, a downfield chemical shift of H1 and H2 in red (from 8.5 ppm to 8.6 ppm) is observed while chemical shift values of other H remain almost constant (Fig. S5 in Supporting information). Additionally, from the Mulliken charge analysis of probe 1 and possible probe 1 + H+ from DFT analysis, the electron density of C1, O1, and H1 of probe 1 was decreased when H+ bound with aldehyde group (Table S1 in Supporting information), similar with that in Ref. [33].
Pump-probe UV–vis absorption spectra show that there is a strong positive excited state absorption signal at near 404 nm and a wide absorption band at 450–800 nm. Two positive excited state absorption signals at 550 nm and 700 nm become obvious when the pH increased from 1.81 to 6.81 (Fig. S6 in Supporting information). With the increase of recording time, the absorption of excited species at 404 nm and 537 nm (Fig. S7 in Supporting information) decay rapidly at pH 1.81. However, the absorption of excited species at 404 nm (Fig. S7A) kept constant at pH 6.81. The absorption of excited species at 537 nm (Fig. S7B) decreased with the increase of recording time at pH 6.81, which was slower compared with that at pH 1.81. The lifetime (τ) was determined to be 20 µs (12 ns, 0.02%; 98 ns, 0.19%; 69 µs, 99.79%) at pH 6.81 according to a triexponential decay function, and 10 ns (6 ns, 54.89%; 134 ns, 45.11%) at pH 1.81 according to a biexponential decay function (Fig. S8 in Supporting information). The great decrease of lifetime was obtained at lower pH. The different lifetime suggests the different excited states at different pH.
On basis of the fact of the differences of PL intensity, lifetime, 1H NMR, electron density distribution and transient absorption spectra, as well as the fact that aldehyde group is located at 4-position of 4-(2-pyridyl) benzaldehyde, therefore, a new pH sensing mechanism, named as intramolecular hydrogen bonds assisted pH-responsive mechanism, is proposed (Scheme 2). At pH > pKa, an intramolecular C − H…O hydrogen bond between oxygen atom of benzaldehyde unit and ortho hydrogen atom on the benzene ring is formed, thus resulting in bright PL emission. At acidic pH levels, the aldehyde group becomes protonated, there is no an intramolecular C − H…O hydrogen with weak PL emission and blue-shift emission from probe 1. Therefore, the aldehyde group at the C-4 position of phenyl can be used as pH-responsive group for the sensing of H+.
To evaluate the feasibility of the application of probe 1 for tracking intracellular pH fluctuations, following experiments were done. Firstly, the cytotoxicity of probe 1 to living cells was carried with a standard CCK-8 assay (Fig. S9 in Supporting information). The cell viability of HeLa cells was above 80% after HeLa cells were treated with 20 µmol/L probe 1 for 24 h. Therefore, 20 µmol/L probe 1 was chosen because of its high PL intensity and low cytotoxicity. Secondly, the subcellular localization of probe 1 in HeLa cells was investigated via co-localization experiments using a commercially available mitochondria specific fluorescent dye (Mito Tracker Green, MTG) or lysosome specific fluorescent dye (Lyso Tracker Green, LTG). A bright fluorescence of probe 1 (orange channel) was observed, which was overlapped with that of MTG (green channel, Fig. S10 in Supporting information) with a Pearson's coefficient of 0.556 and that of LTG (green channel, Fig. S11 in Supporting information) with a Pearson's correlation coefficient of 0.147. These results indicate that probe 1 can be internalized into HeLa cells and predominantly accumulate in mitochondria, which may be ascribed to that the positive charges of probe 1 make it enter live cell easily and interact easily with mitochondria via electrostatic interaction [34]. Thirdly, the photostability of probe 1 is further tested by measuring the PL intensity in CLSM images of HeLa cells stained with probe 1 or MTG. After placing the HeLa cells stained with probe 1 or MTG on confocal laser scanning microscope, the fluorescence images of HeLa cells were recorded via fluorescence collection windows of 550–630 nm and 510–550 nm, respectively, using excitation wavelengths of 405 and 488 nm at a scan rate for a piece of photo per minute. Bright orange PL emission was observed from all CLSM images and the PL intensity kept almost constant within 20 min. After 20 min, the PL intensity decreased with the increase of the recorded time. In comparison, bright green PL emission was observed from all CLSM images and the PL intensity decreased with the increase of recorded time. At 20 min, the PL intensity of probe 1 and MTG decreased to 88% and 8% of the initial PL intensity, respectively (Fig. S12 in Supporting information). Good photostability was obtained for probe 1 in cells.
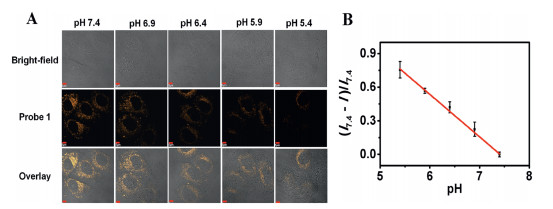
Lastly, the calibration curve of pH in HeLa cells using probe 1 as PL probe was examined. HeLa cells were incubated with probe 1 and then fixed by formaldehyde and next exposed to different pH cell culture medium. From bright fields, it can be seen that the morphology of HeLa cells at different pH cell culture medium basically maintained. Orange PL emission can be clearly observed from all CLSM images at different pH. The PL intensity decreased with the decrease of pH from 7.4 to 5.4. In order to diminish the error coming from different cells, the relative cellular PL intensity (I7.4 – I)/I7.4 was used as analytical signal to quantity the pH value in cells, in which I represent the average cellular PL intensity of probe 1 at different pH, I7.4 represents the average cellular PL intensity of probe 1 at pH 7.4. A good linear relationship was obtained in the range of pH 5.4–7.4. The linear equation is (I7.4 − I)/I7.4 = 2.81 − 0.379 pH (R = 0.9969) (Fig. 3). For comparison, the relative PL intensity (I6.81 − I)/I6.81 was further used as analytical signal to quantity the pH value in BR buffer-DMSO (v:v = 99:1). A good linear relationship was obtained in the range of pH 1.81–6.81 with linear equation of (I6.81 − I)/I6.81 = 1.31 − 0.19 pH (R = 0.9965) (Fig. S13 in Supporting information). It can be seen that pH range is widening to 7.4 and higher sensitivity is obtained in cell media, which is beneficial to assay intracellular pH. The different pH ranges and sensitivity might be caused by the influence of intracellular biomolecules [35] and difference of media [15].
The intracellular pH fluctuation is believed to be crucial for understanding physiological and pathological processes. It was reported that intracellular pH varies from 4.5 (lysosomes) to 8.0 (mitochondria) in normal mammalian cells [11]. In tumor cells, pH in the outer membrane of mitochondria is < 6.8 [36]. Encouraged by the desirable pH-responsive property of probe 1 under neutral and weak acidic conditions, we subsequently exploited the application of probe 1 to monitor intracellular pH fluctuations under external stimulation.
It was reported that phorbol myristate acetate (PMA) can stimulate the endogenous generation of H2O2 through the triggering assembly of NADPH oxidase on the cell membrane, resulting in the acidification to the inhibition of Na+/H+ exchange [9, 37-39]. Here, the intracellular pH fluctuations under PMA stimulation were monitored using CLSM imaging. Firstly, HeLa cells were pretreated with probe 1, propidium iodide (PI) and Annexin V-fluorescein isothiocyanate (Annexin V-FITC), and then co-incubated with 6 µg/mL PMA. As shown in Fig. 4A, upon the addition of PMA into the cell culture medium, CLSM image shows that HeLa cells are well adhered and possessed normal morphology. A slight and punctate green emission from HeLa cell membrane and no red emission were observed, indicating the normal cell status. HeLa cells exhibited bright orange emissions, further confirming that the probe 1 could be internalized into HeLa cells. Under PMA stimulation for 5 min, HeLa cells become bulge and some green emissions from intact cell membrane were obtained from part of cells. There were bright orange emissions but no red emissions from whole HeLa cells. After PMA stimulation from 10 min to 30 min, membrane blebbing was appeared from bright-fields. Green emission intensity increased and orange emission intensity decreased, indicating the beginning of apoptosis (early stage apoptosis) [9]. With the increase of PMA stimulation time from 5 min to 30 min, orange emissions from mitochondria were obtained from all HeLa cells and the emission intensity gradually decreased (Fig. 4B), indicating pH change of mitochondria during apoptosis.
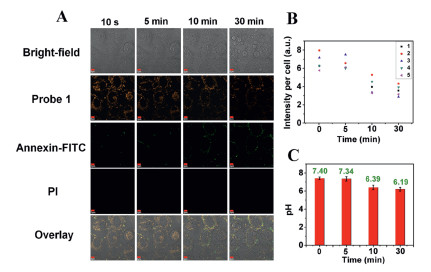
For monitoring intracellular pH fluctuations under external stimulation, the PL intensity of each cell in CLSM images was also obtained using ImageJ. pH of single cell was calculated according to the calibration curve (I7.4 − I)/I7.4 vs. pH in Fig. 3, in which I7.4 and I are corresponding to the PL intensity of same single cell without and with external stimulation, respectively. In this work, the original pH value is defined as 7.4 at first image without external stimulation due to the upper detection limit of pH using probe 1. Fig. 4C shows the intracellular pH change when HeLa cells were treated with PMA for different time. During the PMA stimulation process, the intracellular pH value dropped rapidly in first 10 min and then gradually decreased to the range of 5.83–6.43 with an average of 6.19 with the increase of stimulation time within 30 min. For example, pH is in the range of 7.30–7.57 with an average of 7.34 under PMA stimulation for 5 min. pH is in the range of 6.01–6.69 with an average of 6.39 under PMA stimulation for 10 min.
Ultrasound stimulation of cells is a promising way for cell manipulation with simplicity and without external chemicals [40, 41]. It was reported that ultrasonic stimulation can induce changes in cell morphology [42], cellular content [43], and pH [44] because of ultrasonic cavitation [45], or interaction between bubbles and cells [46] and increased temperature [47]. In this work, the intracellular pH fluctuations under ultrasound stimulation were further monitored using probe 1 as PL probe and CLSM imaging technique. CLSM images of HeLa cells pretreated with probe 1 were recorded under ultrasound stimulation for different time (Fig. S14 in Supporting information) and pH value was calculated according to Fig. 3. Under ultrasound stimulation for 5 min, there are orange emissions from HeLa cells but there is no obvious change in cell morphology from bright fields. In the course of ultrasound stimulation from 5 min to 30 min, HeLa cells are firstly shrinking and gradually becoming round. Orange emission in HeLa cells slightly increased in first 5 min and then gradually decreased with the increase of stimulation time within 30 min (Fig. S14). Under stimulation for 60 min, all HeLa cells become round with membrane blebbing (Fig. S15 in Supporting information), which is typical characteristics of apoptosis. It was also found that the medium temperature kept constant when the ultrasonic time was shorter than 40 min. The medium temperature increased slightly (about 40 ℃) with the ultrasonic stimulation time at 60 min. Although there is no effect of temperature on the PL intensity of probe 1 (Fig. S16 in Supporting information) in the range of 15–40 ℃, intracellular pH fluctuations under ultrasound stimulation within 30 min were studied without the change of medium temperature. The pH value is defined as 7.4 without ultrasound stimulation and pH value increased to 7.56–8.21 with an average of 7.76 under ultrasound stimulation for 5 min. The first increase of pH indicates transient mitochondrial matrix alkalinization in the course of ultrasound stimulation within 5 min, which is similar with that under the oxidative-stress-induced apoptosis [9]. pH then decreased to 6.77 and 6.15 under ultrasound stimulation for 20 min and 30 min, respectively. These results suggest that fluorescence method using probe 1 as pH probe can provide information on intracellular pH fluctuations in the range of neutral and weak acidic conditions under external stimulation, which is promising for the in situ monitoring of treatment effects.
A new pH-responsive cyclometalated iridium(Ⅲ) complex with aldehyde group as pH-responsive group was reported for tracking intracellular pH fluctuations under external stimulation. An intramolecular hydrogen bonds assisted pH-responsive mechanism was proposed for sensing pH, in which an intramolecular C—H…O hydrogen bond between oxygen atom of benzaldehyde unit and ortho hydrogen atom on the benzene ring is formed, thus resulting in bright PL emission. At pH < pKa, the aldehyde group becomes protonated, there is no intramolecular C—H…O hydrogen bond with weak PL emission and blue-shift emission from probe 1. This is the first observation of aldehyde-bearing cyclometalated iridium(Ⅲ) complex with pH-dependent PL behavior. Probe 1 displayed pH-dependent PL emission (in the range of 1.81 to 6.81), fast response time (within 25 s), good photostability and reversibility as well as low cytotoxicity and cell permeability. Furthermore, probe 1 was successfully applied for imaging and tracking pH fluctuations in HeLa cells under external stimulation. Different pH fluctuations were obtained during the course of PMA stimulation and ultrasound stimulation of HeLa cells. During the course of 6 µg/mL PMA stimulation of HeLa cells, pH of mitochondria dropped rapidly in first 10 min and then gradually decreased within 30 min. pH of mitochondria increased within 5 min and then decreased within 30 min during the course of ultrasound stimulation of HeLa cells. This work demonstrates that the aldehyde-bearing iridium(Ⅲ) complex is a promising pH-responsive probe for real-time imaging intracellular pH fluctuations. The new pH sensing concept, intramolecular hydrogen bonds assisted pH-responsive mechanism, provides a promising strategy for pH sensing and the future design of efficient pH-responsive probe in versatile applications.
The authors declare that they have no known competing financial interests or personal relationships that could have appeared to influence the work reported in this paper.
This work was supported by the National Natural Science Foundation of China (Nos. 22074087, 21804106 and 11727813) and the Fundamental Research Funds for the Central Universities (No. 2021TS032). We thank Professor Hongtao Bian from Shaanxi Normal University for his support in transient absorption spectra.
Supplementary material associated with this article can be found, in the online version, at doi:
R.Z. Martinez, B.F. Chinnock, S.H. Wald, et al., Cell. Physiol. Biochem. 6 (1996) 169–184. doi: 10.1159/000154820
M. Lakadamyali, M.J. Rust, H.P. Babcock, X. Zhuang, Proc. Natl. Acad. Sci. U. S. A. 100 (2003) 9280–9285. doi: 10.1073/pnas.0832269100
R.G. Anderson, L. Orci, J. Cell Biol. 106 (1988) 539–543. doi: 10.1083/jcb.106.3.539
D. Wu, W. Qi, W. Nie, et al., Cell Res. 31 (2021) 703–712. doi: 10.1038/s41422-020-00431-3
T.A. Krulwich, G. Sachs, E. Padan, Nat. Rev. Microbiol. 9 (2011) 330–343. doi: 10.1038/nrmicro2549
W.X. Ding, X.M. Yin, Biol. Chem. 393 (2012) 547–564. doi: 10.1515/hsz-2012-0119
J.C. Partin, W.K. Schubert, J.S.N. Partin, Engl. J. Med. 285 (1971) 1339–1343. doi: 10.1056/NEJM197112092852402
D.A. Kubli, A.B. Gustafsson, Circ. Res. 111 (2012) 1208–1221. doi: 10.1161/CIRCRESAHA.112.265819
S. Matsuyama, J. Llopis, Q.L. Deveraux, R.Y. Tsien, J.C. Reed, Nat. Cell. Biol. 2 (2000) 318–325. doi: 10.1038/35014006
X. Tao, Z. Liao, Y. Zhang, et al., Chin. Chem. Lett. 32 (2021) 791–795. doi: 10.1016/j.cclet.2020.07.020
J. Cao, M. Xie, X. Gao, et al., Anal. Chem. 93 (2021) 15159–15166. doi: 10.1021/acs.analchem.1c03629
A. Podder, M. Joseph, S. Biswas, et al., Chem. Commun. 57 (2021) 607–610. doi: 10.1039/D0CC06694J
Y. Wu, L. Zhao, Y. Chang, et al., Chin. Chem. Lett. 32 (2021) 3446–3449. doi: 10.1016/j.cclet.2021.05.034
M.F.C. Abad, G. Di Benedetto, P.J. Magalhães, L. Filippin, T. Pozzan, J. Biol. Chem. 279 (2004) 11521–11529. doi: 10.1074/jbc.M306766200
M.H. Lee, N. Park, C. Yi, et al., J. Am. Chem. Soc. 136 (2014) 14136–14142. doi: 10.1021/ja506301n
B. Feng, Y. Zhu, J. Wu, et al., Chin. Chem. Lett. 32 (2021) 3057–3060. doi: 10.1016/j.cclet.2021.03.074
H. Chen, C. Ge, H. Cao, et al., Dalton Trans. 48 (2019) 17200–17209. doi: 10.1039/C9DT03453F
A. Kando, Y. Hisamatsu, H. Ohwada, et al., Inorg. Chem. 54 (2015) 5342–5357. doi: 10.1021/acs.inorgchem.5b00369
J. Zhao, M. Zou, M. Huang, et al., Chem. Sci. 11 (2020) 3636–3643. doi: 10.1039/D0SC00757A
F. Yuan, Y. Kong, J. You, C. Zhang, Y. Xian, ACS Appl. Mater. Interfaces 13 (2021) 51351–51361. doi: 10.1021/acsami.1c14690
Y. He, Z. Lia, Q. Jia, et al., Chin. Chem. Lett. 28 (2017) 1969–1974. doi: 10.1016/j.cclet.2017.07.027
B. Tang, F. Yu, P. Li, et al., J. Am. Chem. Soc. 131 (2009) 3016–3023. doi: 10.1021/ja809149g
K. Qiu, L. Ke, X. Zhang, et al., Chem. Commun. 54 (2018) 2421–2424. doi: 10.1039/C8CC00299A
S. Aoki, Y. Matsuo, S. Ogura, et al., Inorg. Chem. 50 (2011) 806–818. doi: 10.1021/ic101164g
A. Nakagawa, Y. Hisamatsu, S. Moromizato, M. Kohno, S. Aoki, Inorg. Chem. 53 (2014) 409–422. doi: 10.1021/ic402387b
L. He, Y. Li, C. Tan, et al., Chem. Sci. 6 (2015) 5409–5418. doi: 10.1039/C5SC01955A
M. Qian, Z. Wang, H. Qi, H. Qi, Inorg. Chem. Commun. 106 (2019) 95–98. doi: 10.1016/j.inoche.2019.05.041
S. Abbas, I. Din, A. Raheel, et al., Appl. Organometal. Chem. 34 (2020) 5413–5418.
K.K. Lo, C. Chung, N. Zhu, Chem. Eur. J. 9 (2003) 475–483. doi: 10.1002/chem.200390050
P. Lee, H. Liu, S. Yiu, M. Louie, K.K. Lo, Dalton Trans 40 (2011) 2180–2189. doi: 10.1039/C0DT00501K
S. Xia, D. Han, H. Gao, et al., J. Electroanal. Chem. 777 (2016) 101–107. doi: 10.1016/j.jelechem.2016.07.031
L. Zhou, Z. Jin, X. Fan, et al., Chin. Chem. Lett. 29 (2018) 1500–1502. doi: 10.1016/j.cclet.2018.07.018
W. Niu, L. Fan, M. Nan, et al., Anal. Chem. 87 (2015) 2788–2793. doi: 10.1021/ac504109h
H. Zhu, J. Fan, J. Du, X. Peng, Acc. Chem. Res. 49 (2016) 2115–2126. doi: 10.1021/acs.accounts.6b00292
X. Liu, Y. Su, H. Tian, et al., Anal. Chem. 89 (2017) 7038–7045. doi: 10.1021/acs.analchem.7b00754
D.C. Wallace, Nat. Rev. Cancer 12 (2012) 685–698. doi: 10.1038/nrc3365
Q. Hu, Y. Xia, S. Corda, J.L. Zweier, R.C. Ziegelstein, Circ. Res. 83 (1998) 644–651. doi: 10.1161/01.RES.83.6.644
K.L. Tsai, S.M. Wang, C.C. Chen, T.H. Fong, M.L. Wu, J. Physiol. 502 (1997) 161–174. doi: 10.1111/j.1469-7793.1997.161bl.x
J.R. Casey, S. Grinstein, J. Orlowski, Nat. Rev. Mol. Cell Biol. 11 (2010) 50–61. doi: 10.1038/nrm2820
W.M. Maung, H. Nakata, M. Miura, et al., Tissue Eng. Part A 27 (2021) 1–2.
F. Fontana, F. Iberite, A. Cafarelli, et al., Ultrasonics 116 (2021) 106495. doi: 10.1016/j.ultras.2021.106495
E.S. Ebbini, G.T. Haar, Int. J. Hyperther. 31 (2015) 77–89. doi: 10.3109/02656736.2014.995238
L. Lagneauxa, C. Meulenaer, A. Delforge, Exp. Hematol. 30 (2002) 1293–1301. doi: 10.1016/S0301-472X(02)00920-7
S. Daya, Hum. Reprod. 3 (1988) 727–730. doi: 10.1093/oxfordjournals.humrep.a136773
M.S. Karthikesh, X. Yang, Exp. Biol. Med. 246 (2021) 758–770. doi: 10.1177/1535370220982301
X. Tan, C. Yi, Y. Zhang, Front. Oncol. 11 (2021) 768222. doi: 10.3389/fonc.2021.768222
H.P. Koka, E.N.K. Cressman, W. Ceelenc, Int. J. Hyperther. 37 (2020) 711–741. doi: 10.1080/02656736.2020.1779357

Scheme 1 (A) Synthetic route of probe 1. (B) Schematic representation of PL imaging intracellular pH fluctuations under external stimulation using probe 1.

Figure 1 (A) UV–vis absorption spectra of 50 µmol/L probe 1 in BR buffer-DMSO (v:v = 99:1, pH 1.81 and 6.81). (B) PL emission spectra of 10 µmol/L probe 1 in BR buffer-DMSO (v:v = 99:1) at different pH (a-k, 1.81, 2.31, 2.84, 3.35, 3.78, 4.34, 4.80, 5.33, 5.85, 6.35 and 6.81). Insert: the linear relationship of the PL intensity at 587 nm vs. pH values, λex = 420 nm. (C) Sigmoidal fitting of pH-dependent PL intensity at 587 nm. The bright field (D) and PL (E) images of 10 µmol/L probe 1 in BR buffer-DMSO (v:v = 99:1) at different pH. The error bars mean the standard deviations of three times experiment results under the same condition.

Figure 2 (A) Time course of PL intensity of 10 µmol/L probe 1 before and after adding 0.15 mol/L NaOH solution in BR buffer-DMSO (v:v = 99:1, pH 1.81). (B) PL reversibility of 10 µmol/L probe 1 in BR buffer-DMSO (v:v = 99:1) solution between pH 1.81 and 6.81 by adjusting pH using concentrated HCl and NaOH. (C) PL intensity of 10 µmol/L probe 1 in BR buffer-DMSO (v:v = 99:1) at pH 1.81 and 6.81 in the presence of various species: (1) blank; (2) 20 mmol/L Zn2+; (3) 0.5 mmol/L Pb2+; (4) 20 mmol/L Mg2+; (5) 30 mmol/L K+; (6) 1 mmol/L Co2+; (7) 20 mmol/L Mn2+; (8) 0.1 mmol/L Cr3+; (9) 5 mmol/L Hg2+; (10) 110 mmol/L Na+; (11) 5 mmol/L Cd2+; (12) 1.2 mmol/L Al3+; (13) 20 mmol/L Ca2+; (14) 0.1 mmol/L Fe3+; (15) 25 mmol/L glucose; (16) 2 mmol/L valine; (17) 2 mmol/L leucine; (18) 2 mmol/L DL-methionine; (19) 2 mmol/L arginine; (20) 2 mmol/L histidine. λex = 420 nm.

Scheme 2 (A) The proposed intramolecular hydrogen bonds assisted pH-responsive mechanism for probe 1. (B) Partial electron density distribution of optimized probe 1 and probe 1 + H+ models calculated based on DFT at B3LYP level with the 6–31 G, 6–31G* and LANL2DZ mixed basis set. In this ball-stick model: hydrogen (white), carbon (gray), oxygen (red), nitrogen (blue), chlorine (green). Mulliken charge of H1 is indicated in blue (δ+) and O1 is indicated in red (δ−). (C) Partial 1H NMR spectra of probe 1 in DMSO-d6 (top) and in DMSO-d6-DCl at pH 2.0 (bottom).

Figure 3 CLSM images of HeLa cells at different pH values. HeLa cells were incubated with 20 µmol/L probe 1 for 30 min, and fixed by 4% formaldehyde and exposed to fresh cell culture medium without phenol red at different pH for 20 min. The CLSM images were obtained over the collection windows of 550–630 nm with the excitation at 405 nm. Scale bar = 5 µm. (B) Intracellular pH calibration curve of probe 1 in HeLa cells.

Figure 4 (A) CLSM images of HeLa cells. HeLa cells were firstly pretreated with 20 µmol/L probe 1 for 30 min at 37 ℃, and then treated with 10 µmol/L Annexin-FITC for 10 min and treated with 10 µmol/L PI for another 5 min at 37 ℃. Images were recorded upon addition of 6 µg/mL PMA for different time. Images were recorded using an excitation wavelength of 405 nm (probe 1), 488 nm (FITC) and 515 nm (PI), and the emission filters at 560–610 nm (probe 1), 510–550 nm (FITC) and 615–655 nm (PI). Scale bar = 5 µm. (B) PL intensity of probe 1 in per HeLa cell treated with 6 µg/mL PMA for different time. (C) Intracellular pH in the HeLa cells during 6 µg/mL PMA stimulation for different time. The error bars mean the standard deviations of PL intensity of all intact cells in one CLSM images under the same conditions.

 扫一扫看文章

扫一扫关注我们
 DownLoad:
 下载:
下载: