Scheme 1.
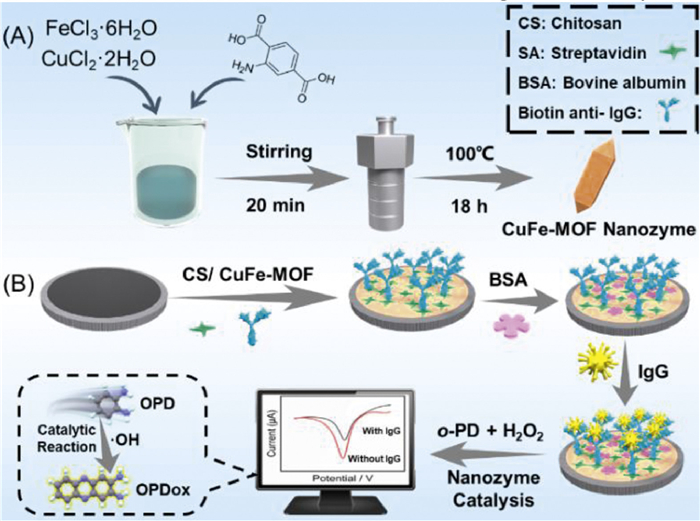
Schematic illustration for synthesis of CuFe-MOF (A), fabrication of label-free electrochemical immunosensor and immunoassay procedure for IgG (B).
Universal MOF nanozyme-induced catalytic amplification strategy for label-free electrochemical immunoassay
Ruixin Liu , Feng Shi , Yanping Xia , Haibing Zhu , Jiawen Cao , Kai Peng , Chuanli Ren , Juan Li , Zhanjun Yang

Researches on exploitation of electrochemical immunoassay have attracted considerable attention, particularly in the development of various immunosensors based on nanomaterial-modified sensing interface [1–3]. As an important branch of electrochemical immunoassay, label-free electrochemical immunosensors have become an attractive and promising approach for the direct detection of disease markers because of simple procedure, ease of use, rapid assay, low cost, without secondary antibody compared to labeled immunosensors [4–7]. However, traditional label-free immunosensors have the problems in the detection of very low concentration target molecules because low catalytic ability of modified materials toward the electroactive probe (potassium ferricyanide) [8]. Therefore, it is of significance to develop functional materials with high catalytic properties modified on the electrode interface for effectively catalyzing electroactive molecules, which can enhance the sensitivity for detection of target analytes via label-free electrochemical immunosensor [9–11].
Metal-organic frameworks (MOFs) are widely recognized as star materials and extensively utilized across various fields due to their exceptional properties [12–17]. In the past few years, a few MOF materials have been discovered to exhibit biomimetic catalytic functions similar to enzymes [18–22], which can be attributed to their exceptional physical and chemical properties, low cost, remarkable stability, and convenient storage characteristics [23]. In comparison with nanozymes based on carbon materials [24,25], noble metals [26,27] or transition metal compounds [28,29], MOF nanozymes show some unique features arising from their versatility and structural adjustability, in addition to the inherent advantages of facile synthesis and customizable design [30,31]. Bimetallic MOFs not only possess the advantages of metal-organic framework materials but also exhibit excellent conductivity, structural stability and catalytic activity [32–35]. Therefore, the attractive bimetallic MOFs with versatile nature meet the need for designing MOF nanozyme with multi-active sites, which will endow them with growing applications, especially in the biosensing field. At present, MOF nanozymes have been not reported in label-free electrochemical immunoassay to the best of our knowledge. With the continuous development of nanozymes and biosensor technology, the combination of label-free immunosensors and MOF nanozymes holds great potential for advancing the sensitivity of disease markers detection.
In this work, a spindle-shaped copper-iron bimetallic metal-organic framework (CuFe-MOF) nanozyme with excellent peroxidase (POD)-like activity was synthesized (Scheme 1A). Here, an effective label-free electrochemical immunosensor was developed based on MOF nanozyme-induced catalytic amplification (Scheme 1B) benefiting from oxidative activity of hydroxyl radicals generated by the decomposition of H2O2 catalyzed by nanozyme. Immunoglobulin G (IgG) was exploited as a model analyte to investigate the performance of the label-free immunosensor. The CuFe-MOF nanozyme can catalyze hydrogen peroxide oxidizing 1,2-phenylenediamine (o-PD) to produce intense differential pulse voltammetry (DPV) signal. Based on the inhibition of antibody-antigen reaction toward the DPV signals of o-PD, a sensitive label-free electrochemical immunoassay was achieved for quantitative detection of IgG. The fabricated electrochemical immunosensor exhibits high sensitivity, excellent specificity, and satisfactory reproducibility for detection of IgG.
The morphology characterization of the prepared CuFe-MOF nanozyme was conducted using scanning electron microscope, transmission electron microscope and X-ray diffraction (XRD). Based on the scanning electron microscope (SEM) image (Fig. 1A), it is evident that the CuFe-MOF nanozyme displays a homogeneous spindle-shaped morphology with an average length of approximately 600 nm and a remarkably smooth surface, which is further confirmed by the transmission electron microscope (TEM) image of CuFe-MOF (Fig. 1B). The XRD pattern (Fig. 1C, curve b) shows that the crystal structure of CuFe-MOF nanozyme remains unaffected by the Cu doping, and no additional impurity diffraction peaks were found. In addition, XRD pattern of CuFe-MOF is basically consistent with the results reported by the literature (curve a) [36], indicating that the CuFe-MOF nanozyme was successfully prepared accompanying with high purity. The element mapping characterization was shown in Fig. 1D, which shows that the elements (including C, N, Cu, and Fe) are uniformly distributed in CuFe-MOF nanozyme. Additionally, the energy dispersive X-ray (EDX) spectrogram (Fig. S1 in Supporting information) depicts the component elements of CuFe-MOF, which confirm the presence of carbon, nitrogen, iron, and copper in the material and further evidence of the successful synthesis of CuFe-MOF nanozyme. SEM and X-ray photoelectron spectra (XPS) were used to characterize the sensing interface throughout the immunosensor fabrication process (Fig. S2 in Supporting information).
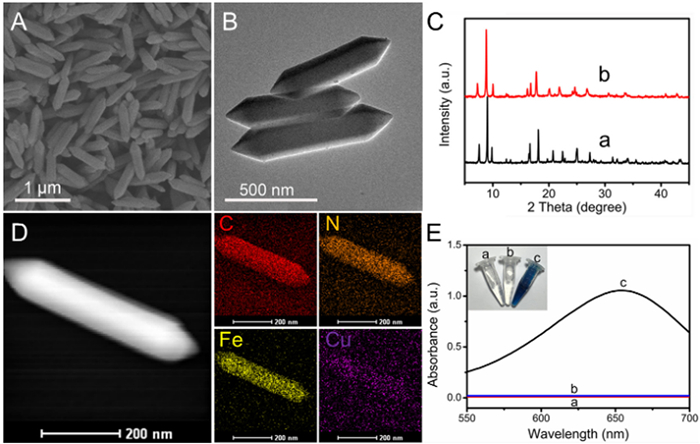
To explore the POD-like activity of CuFe-MOF nanozyme, the chromogenic substrate 3,3′, 5,5′-tetramethylbenzidine (TMB) was employed in the experiment. The progression of the reaction was tracked using ultraviolet-visible (UV–vis) spectroscopy at a specific wavelength of 652 nm. As shown in Fig. 1E, there was no apparent UV absorption and color change in the separate TMB solution and TMB + H2O2 solution (curve and insets a and b). However, upon the addition of CuFe-MOF nanozyme to the TMB + H2O2 solution, a distinct blue color was observed (inset c), accompanied by a prominent absorption peak (curve c). The phenomenon powerfully shows excellent the POD-like catalytic capability of CuFe-MOF nanozyme. In the presence of H2O2 and nanozyme with POD-like activity, TMB could be catalyzed into oxidized TMB (oxTMB) exhibiting characteristic peaks at 652 nm, which can be ascribed to the strong catalytic oxidation of hydroxyl radicals that originated from H2O2 catalyzed by nanozyme. The superior POD-like properties of the synthesized CuFe-MOF nanozyme is mainly attributed to the synergistic effect of copper and iron.
In order to further illuminate the peroxidase like catalytic activity of CuFe-MOF, the steady-state catalytic kinetics tests were conducted. When H2O2 was the substrate, the experiment was conducted at room temperature in an acetate buffer solution (pH 4.5), with a constant concentration of TMB achieved by varying the concentration of H2O2. The Michaelis-Menten curve (Fig. 2) was obtained by plotting the relationship between various concentrations of H2O2 and their respective v0, following the Michaelis-Menten equation (Eq. 1).
|
|
(1) |

where Vm is the maximum velocity, [S] is the substrate concentration, and Km is the Michaelis constant. Subsequently, catalytic kinetic parameter values were calculated, including the Km and Vm for CuFe-MOF, which were determined to be 0.14 mmol/L and 4.13 × 10⁻⁸ mol L−1 s−1, respectively, with H2O2 as the substrate for the Lineweaver-Burk double reciprocal plot (Fig. 2). Correspondingly, under unchanged reaction conditions with a constant H2O2 concentration, varying the concentration of TMB, the Km and Vm for CuFe-MOF were found to be 0.41 mmol/L and 4.56 × 10⁻⁸ mol L−1 s−1, respectively. Additionally, the Km and Vm values were compared with those of other typical nanozymes, as outlined in Table S1 (Supporting information). This comparison demonstrates the exceptional peroxidase-like properties of the CuFe-MOF.
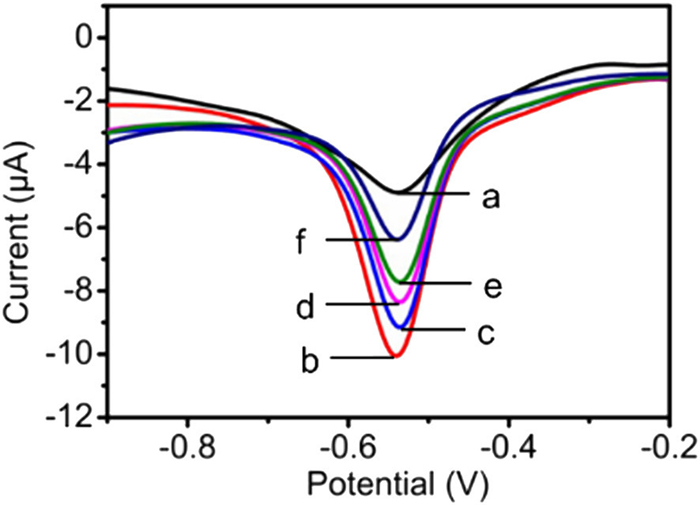
The feasibility of the proposed electrochemical immunosensor for label-free detection was investigated using DPV in pH 7.0 phosphate buffer solution (PBS) containing 20.0 mmol/L o-PD and 6.0 mmol/L H2O2. As seen from Fig. 3 that the CuFe-MOF/chitosan (CS)/glassy carbon electrode (GCE) (curve b) exhibited the much higher current signal at −0.55 V than of bare GCE (curve a), which can be ascribed to the catalytic oxidation reaction of o-PD induced by MOF nanozyme. Concretely, o-PD is oxidized by •OH with highly oxidative activity to produce 1,2-phenylenediamine oxidized (o-PDox) resulting high DPV signal, in which •OH are originated from the conversion of H2O2 catalyzed by MOF nanozyme. With the entrapment of streptavidin (SA) on the composite film, the peak current of SA/CuFe-MOF/CS/GCE exhibited a significant decrease due to the low conductivity of SA (curve c). When the immobilization of biotinylated anti-IgG onto the electrode, the immunosensor (biotin-anti-IgG/SA/CuFe-MOF/CS/GCE) showed a further reduction in peak current (curve d). Additionally, the peak current displayed the successive decreases upon the incubation of 0.1 (curve e) and 10 ng/mL (curve f) of IgG with the immunosensor, which can be attributed to the blocking effect exerted by the immunocomplex molecules on electrode surface. Therefore, this label-free electrochemical immunosensor based on MOF nanozyme-induced catalytic amplification strategy can effectively achieve rapid detection of IgG by utilizing the changes in peak current versus the concentration of IgG antigen.
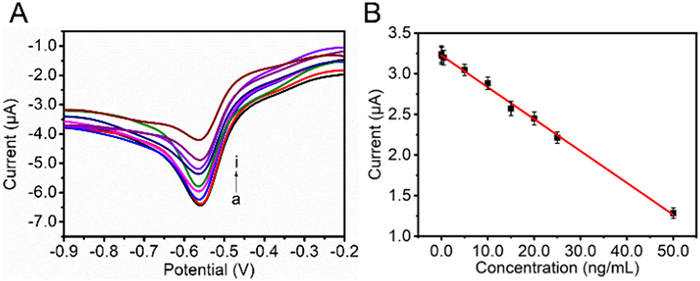
As shown in Fig. 4A, the DPV current response exhibited successive decreases with increasing IgG concentration. The calibration plot (Fig. 4B) demonstrated a favorable linear relationship between the reduction of peak currents and IgG concentrations within the range of 0.001 ng/mL to 50 ng/mL with a low detection limit of 0.45 pg/mL (S/N = 3), indicating the potential of the proposed label-free immunosensor for sensitive detection of tumor marker. The fitted linear regression equation was Y (µA) = 3.22631–0.03923X (ng/mL) with a linear regression coefficient of R2 = 0.9969. The detection limit of the proposed method is significantly lower than that of other reported methods [37–40], which is ascribed to the high catalytic ability toward electrochemical substrates of the excellent POD-like CuFe-MOF nanozyme. The analytical performance of the immunosensor was compared with that of other reported immunosensors and is listed in Table S2 (Supporting information). By comparing with other immunosensors, it was observed that the CuFe-MOF immunosensor exhibited a sufficient detection range and a low limit of detection (LOD) for recognizing IgG.
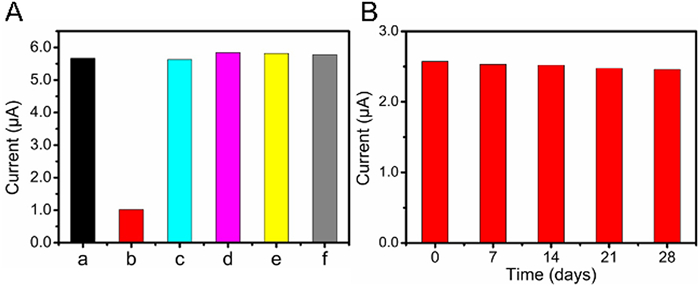
For the purpose of evaluating specificity, the CuFe-MOF-based immunosensor was utilized to detect IgG (50 ng/mL) and interfering antigens including CA125 (50 ng/mL), CEA (50 ng/mL), AFP (50 ng/mL), and IgM (50 ng/mL). As shown in Fig. 5A, the label-free immunosensor exhibited a substantial change in current response only in the presence of target IgG, which indicates that the label-free immunoassay with high specificity can be effectively employed for the selective determination of IgG. The reproducibility of the label-free immunosensor was examined by calculating coefficients of variation (CVs) within the same group and between different groups. Intra-CV is 2.4% by repetitive testing of IgG (15 ng/mL) using the same immunosensor five times, and inter-CV is 4.9% by the parallel determination of IgG (15 ng/mL) using five different immunosensors. This analysis confirms the excellent reproducibility of the prepared label-free immunosensor. In addition, the stability of the label-free immunosensor was investigated by assessing its current responses periodically after a period of storage (shown in Fig. 5B). The immunosensor was measured weekly, and the current response retained 96% of its initial value after being stored at 4 ℃ in 0.01 mol/L PBS (pH 7.4) for 4 weeks, demonstrating that the label-free immunosensor exhibits acceptable stability under this storage condition.
To assess the accuracy and practical value of the CuFe-MOF-based immunosensor, actual serum samples were spiked with standard concentrations of IgG and then subjected to analysis of recovery. Ethical approval was obtained from the Institutional Ethics Committee. Written informed consent was obtained from all the participants prior for the publication of this study. By adding IgG standard solutions of 0.05 ng/mL, 5.0 ng/mL, 15 ng/mL, 20 ng/mL, and 25 ng/mL to human serum samples, the measurement results are summarized in Table S3 (Supporting information). As shown in the table, the recovery rates range from 94.38% to 106.3%, suggesting that the label-free immunosensor exhibits excellent detection capability for actual samples.
In this study, a universal MOF nanozyme-induced catalytic amplification strategy was developed and utilized to fabricate high-performance label-free electrochemical immunoassay. In detail, a novel bimetallic CuFe-MOF nanozyme with excellent POD-like activity, large specific surface area and excellent conductivity was synthesized as a model. Taking o-PD as electroactive substrate, CuFe-MOF nanozyme with exceptional POD-like properties can catalyze H2O2 to produce •OH with intensive oxidability that can oxidize o-PD to o-PDox with high electrochemical signal. Utilizing IgG as analyte, the constructed label-free electrochemical immunosensor demonstrates a wide linear range, low detection limit, and remarkable selectivity, and can be successfully applied in detection of IgG in clinical serum samples. The MOF nanozyme-induced catalytic amplification strategy for constructing label-free electrochemical immunosensor presented in this study holds promising potential for applications in clinical diagnosis and other fields.
The authors declare that they have no known competing financial interests or personal relationships that could have appeared to influence the work reported in this article.
This work was financially supported by National Natural Science Foundation of China (Nos. 21575125, 82172345 and 81573220), the National Natural Science Foundation of Jiangsu Province (No. BK20221370, BK20221281), Key University Natural Science Foundation of Jiangsu-Province (No. 20KJA150004), the Project for Science and Technology of Yangzhou (Nos. YZ2022074, YZ2020076), Project for Yangzhou City and Yangzhou University corporation (No. YZ2023204), Cross cooperation project of Subei Peoples’ Hospital of Jiangsu Province (No. SBJC220009), Open Research Fund of State Key Laboratory of Analytical Chemistry for Life Science (No. SKLACLS2405) and Postgraduate Research & Practice Innovation Program of Jiangsu Province (No. KYCX22_3462).
Supplementary material associated with this article can be found, in the online version, at doi:
J.X. Zhang, C.L. Lv, C. Tang, et al., Sens. Actuat. B: Chem. 382 (2023) 133497. doi: 10.1016/j.snb.2023.133497
T. Dong, N.M.M. Pires, Z.C. Yang, Z.D. Jiang, Adv. Sci. 10 (2023) 2205429. doi: 10.1002/advs.202205429
C.X. Zhao, Y.J. Li, J.J. Zhao, et al., ACS Nano 17 (2023) 13296–13309. doi: 10.1021/acsnano.3c01158
Q.C. Lan, H.F. Shen, J. Li, et al., Chem. Communn. 56 (2020) 699–702. doi: 10.1039/C9CC07934C
Z.J. Yang, Q.C. Lan, J. Li, et al., Biosens. Bioelectron. 89 (2017) 312–318. doi: 10.1016/j.bios.2016.09.026
Q.C. Lan, C.L. Ren, A. Lambert, et al., ACS Sustain. Chem. Eng. 8 (2020) 4392–4399. doi: 10.1021/acssuschemeng.9b06858
Y.P. Xia, H. Chen, R.X. Liu, et al., J. Anal. Test. 7 (2023) 295–303. doi: 10.1007/s41664-023-00255-1
H.H. Rao, X. Xue, M.Y. Luo, H.X. Liu, Z.H. Xue, Chin. Chem. Lett. 32 (2021) 25–32. doi: 10.1016/j.cclet.2020.09.017
H.N. Chen, Y.Y. Li, Y.C. Song, et al., Biosens. Bioelectron. 223 (2023) 115029. doi: 10.1016/j.bios.2022.115029
D.S. Zhang, W.X. Li, H.Q. Wang, Z.F. Ma, Sens. Actuat. B: Chem. 258 (2018) 141–147. doi: 10.1016/j.snb.2017.11.085
Y.F. Dai, L.Y. Chiu, Y.N. Chen, et al., ACS Sens. 4 (2019) 161–169. doi: 10.1021/acssensors.8b01126
H. Wang, X.L. Wang, R.M. Kong, L. Xia, F.L. Qu, Chin. Chem. Lett. 32 (2021) 198–202. doi: 10.1016/j.cclet.2020.10.017
J.B. Ouyang, J. Chen, S.Q. Ma, et al., Particuology 62 (2022) 71–78. doi: 10.1016/j.partic.2021.04.012
Z.H. Li, T.M. Rayder, L.S. Luo, J.A. Byers, C.K. Tsung, J. Am. Chem. Soc. 140 (2018) 8082–8085. doi: 10.1021/jacs.8b04047
K. Suresh, A.J. Matzger, Angew. Chem. Int. Ed. 58 (2019) 16790–16794. doi: 10.1002/anie.201907652
X.J. Liu, X. Gao, L.M. Yang, Y.C. Zhao, F. Li, Anal. Chem. 93 (2021) 11792–11799. doi: 10.1021/acs.analchem.1c02286
J.L. Guo, H.J. Xu, J.J. Zhao, et al., Chem. Sci. 13 (2022) 9993. doi: 10.1039/D2SC03198A
J.L. Guo, L.L. Yang, Z.D. Gao, et al., ACS Catal. 10 (2020) 5949–5958. doi: 10.1021/acscatal.0c00591
N. Cheng, C.Z. Zhu, Y.L. Wang, et al., J. Anal. Test. 3 (2019) 99–106. doi: 10.1007/s41664-018-0079-z
J.L. Guo, X.A. Liu, J.J. Zhao, et al., Chem. Sci. 14 (2023) 1742. doi: 10.1039/D2SC05784K
T. Hou, N.N. Xu, X. Song, L.M. Yang, F. Li, Chin. Chem. Lett. 34 (2023) 107907. doi: 10.1016/j.cclet.2022.107907
D.D. Wang, H.H. Wu, W.Q. Lim, et al., Adv. Mater. 31 (2019) 1901893. doi: 10.1002/adma.201901893
J.Y. Zhao, Y.Y. Long, C.J. He, et al., Chem. Eng. J. 479 (2024) 147513. doi: 10.1016/j.cej.2023.147513
M. Saeed, L.Y. Deng, Int. J. Greenh. Gas Control 53 (2016) 254–262. doi: 10.1016/j.ijggc.2016.08.017
X.L. Wang, Z.L. Cheng, Y. Zhou, S.K. Tammina, Y.L. Yang, Microchim. Acta 187 (2020) 350. doi: 10.1007/s00604-020-04322-7
Y.W. Mao, J.X. Zhang, D.N. Chen, A.J. Wang, Sens. Actuat. B: Chem. 370 (2022) 132416. doi: 10.1016/j.snb.2022.132416
J.M. Xu, J. Ma, Y. Peng, et al., Chin. Chem. Lett. 34 (2023) 107527. doi: 10.1016/j.cclet.2022.05.041
J.Y. Zhan, F. Shi, J. Li, et al., Chin. Chem. Lett. 34 (2023) 108791. doi: 10.1016/j.cclet.2023.108791
J.J. Luo, R.L. Liu, S.C. Zhao, Y. Gao, J. Anal. Test. 7 (2023) 53–68. doi: 10.1007/s41664-022-00241-z
S.Y. Yin, G.S. Song, Y. Yang, et al., Adv. Funct. Mater. 29 (2019) 1901417. doi: 10.1002/adfm.201901417
Y.H. Xia, K.M. Sun, Y.N. Zuo, S.Y. Zhu, X.E. Zhao, Chin. Chem. Lett. 33 (2022) 2081–2085. doi: 10.1016/j.cclet.2021.08.083
C.C. Ma, Y. Guo, H.O. Liu, X.F. Zhang, Micropor. Mesopor. Mater. 322 (2021) 111153. doi: 10.1016/j.micromeso.2021.111153
J. Zeng, K.C. Devarayapalli, S.V.P. Vattikuti, J. Shim, Mater. Lett. 309 (2022) 131305. doi: 10.1016/j.matlet.2021.131305
X. Zhang, X.D. Zhang, Y.P. Cai, S.G. Wang, Chem. Eng. J. 443 (2022) 136412. doi: 10.1016/j.cej.2022.136412
Q.S. Jiang, Y.C. Xiao, A.N. Hong, et al., ACS Appl. Mater. Interfaces 14 (2022) 41800–41808. doi: 10.1021/acsami.2c12115
P.K. Cao, K. Zhao, X. Quan, S. Chen, H.T. Yu, Sep. Purif. Technol. 238 (2020) 116424. doi: 10.1016/j.seppur.2019.116424
Y. Qu, L. Chen, H.P. Deng, C.Y. Li, J. Solid State Electr. 21 (2017) 3281–3287. doi: 10.1007/s10008-017-3641-0
S.C. Barman, M.A. Zahed, M. Sharifuzzaman, et al., Adv. Funct. Mater. 30 (2020) 1907297. doi: 10.1002/adfm.201907297
G.L. Hong, C.P. Su, Z.N. Huang, et al., Anal. Chem. 93 (2021) 13022–13028. doi: 10.1021/acs.analchem.1c02850
S. Chanarsa, J.J. akmunee, K. Ounnunkad, Front. Chem. 9 (2021) 631571. doi: 10.3389/fchem.2021.631571

Scheme 1 Schematic illustration for synthesis of CuFe-MOF (A), fabrication of label-free electrochemical immunosensor and immunoassay procedure for IgG (B).

Figure 1 (A) SEM images of CuFe-MOF. (B) TEM image of CuFe-MOF. (C) XRD of CuFe-MOF. (D) HAADF-STEM image and element mappings images. (E) UV–vis spectra of (a) TMB, (b) TMB + H2O2, (c) TMB + H2O2 + CuFe-MOF. The insets are colorimetric photographs corresponding to curves a, b and c.

Figure 2 Steady-state kinetic analysis using Michaelis-Menten and Lineweaver-Burk plot for CuFe-MOF. (A) Plot of v with the concentration of H2O2. (C) Plot of v with the concentration of TMB. (B) and (D) were double-reciprocal plots of (A) and (C), respectively.

Figure 3 DPV responses of bare GCE (a), CuFe-MOF/CS/GCE (b), SA/CuFe-MOF/CS/GCE (c), biotin-anti-IgG/SA/CuFe-MOF/CS/GCE (d), IgG (0.1 ng/mL)/biotin-anti-IgG/SA/CuFe-MOF/CS/GCE (e), and IgG (10 ng/mL)/biotin-anti-IgG/SA/CuFe-MOF/CS/GCE (f) in pH 7.0 PBS solution containing 20 mmol/L o-PD and 6.0 mmol/L H2O2.

Figure 4 (A) DPV responses of the label-free immunosensor toward different concentrations of IgG (from a to i: 0.001, 0.05, 0.5, 5, 10, 15, 20, 25, 50 ng/mL IgG), (B) linear relation between current response and IgG concentration.

 扫一扫看文章

扫一扫关注我们
 DownLoad:
 下载:
下载:
