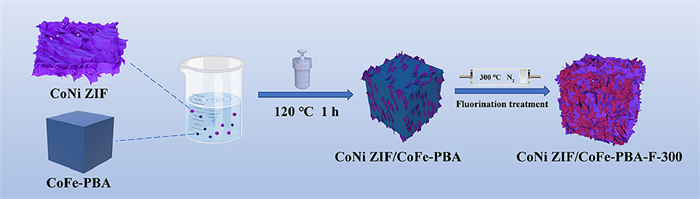
Figure 1.
Schematic illustration of the preparation of CoNi ZIF/CoFe-PBA-F-300.

Under the backdrop of environmental issues induced by a large amount of traditional fossil fuels consummation, there is an urgent need to develop renewable energy sources, while the intermittent supply of renewable energy such as solar energy and wind energy makes it necessary to develop efficient and stable energy conversion and storage technologies [1-4]. Electrochemical water splitting is a cost-efficient and sustainable approach to realize energy conversion and storage in hydrogen, which is an ideal energy carrier with high calorific value and environmental friendliness [5-8]. In the water splitting technique, the slow kinetics of anode oxygen evolution reaction (OER) inevitably reduce the energy conversion efficiency since the multi-step proton-coupled electron transfer involved in OER requires a considerable overpotential to generate the desired current density [9-12]. At present, precious metal oxides (such as RuO2, and IrO2) are considered the best electrocatalysts for OER, but their large-scale application is limited by the high cost and small reserves [13-16]. To overcome this problem, current attention is mainly directed to the development of OER catalysts with high-cost effectiveness based on transition metal-based catalysts [17,18].
As a porous coordination polymer, the metal-organic framework (MOF) can be flexibly combined with various functional ligands and metal centers, which plays a significant role in efficient OER catalyst fabrication [19,20]. Specifically, the catalyst systems derived from MOF could easily expose active sites and improve the conductivity by combining the metal active species and the carbon materials [21,22]. For example, Co3O4@C nanostructured catalysts derived from two different MOF-ligands via a wet chemical process showed unique morphologies of donuts and nanorods over a carbon layer resulting in the active sites increasing for OER with a small overpotential of 320 mV to reach 10 mA/cm2 [23]. However, most of the MOF precursor materials adopted relatively simple configurations, such as porous or hollow MOF crystals with single composition, which reduced the accessibility of unsaturated metal sites and the intrinsic activity of the active sites [24,25]. To synthesize the ideal functional materials, complex MOF composites have been proposed to enrich the metal centers and increase the synergistic effect for catalysis by combining their unique advantages [26,27]. Various metal centers and ligands can enrich the structural diversity of MOF, regulate the specific surface area and porosity of catalysts, and promote the mass transfer process [28]. Among the MOFs, the zeolitic imidazolate framework (ZIF) has the unique advantages of high specific surface area, large pore volume and easy functionalization, and the Prussian blue analog (PBA), a typical MOF-like material, has the unique three-dimensional (3D) open framework and adjustability of metal cations which can increase the specific surface area of the catalyst material and charge transfer [29,30]. So, both of them have been employed as precursors to fabricate electrocatalytic materials [31-34]. For example, Co3O4/Co-Fe oxide shell nano boxes were fabricated using ZIF and PBA as precursors by MOF hybridization, which showed stronger electrocatalytic performance in OER in alkaline solution [35]. The ZIF-67 framework templated PBA-derived hollow nano-box was found highly efficient for OER after the partial fluorination at different temperatures [36]. Therefore, the combination of ZIF and PBA to form a composite with a multi-component mixed structure would be an effective method to improve the electrochemical performance, while this kind of derivative is still rarely seen in the literature. It was well known that the further handling of MOFs derivatives by nonmetallic heteroatoms functionalization like phosphatization, sulfidation, etc., can further improve the catalytic performance of composites because they can adjust the electronic structure, modify the active sites or create an unsaturated coordination environment [37-39]. In particular, F is the most electronegative element, and the metal-F bond formed by F has a strong ionic bond that is beneficial to the formation of active sites [40]. At the same time, the defect structure formed by fluoride etching is beneficial to ion diffusion and mass transfer [41,42].
Based on the above considerations, we tried to get a catalyst derived from the full fluoridation of the multi-component mixed structure by combining ZIF-derived nanosheets with a PBA cubic structure. The multicomponent composites of the CoNi ZIF/CoFe-PBA hybrid were prepared by a simple hydrothermal method, and the multi-component derivative materials obtained by fluoridation at different temperatures were optimized for OER. Because of the multi-component mixed structure of nanoparticles and nanocubes, the derived fully fluorinated CoNi ZIF/CoFe-PBA-F-300 possessed high conductivity, larger surface area and active site exposure, which promoted the mass and charge transfer. The synergistic effect among the components and the easy active phase formation from the highly polar metal fluorides thus largely improved OER performance compared to some reference samples. The optimal catalyst of CoNi ZIF/CoFe-PBA-F-300 required a low overpotential of 250 mV to reach 10 mA/cm2 loaded on the glassy carbon electrode, with a Tafel slope of 47.4 mV/dec, and good stability. The current work showed a novel effective composite catalyst fabrication and its potential application in the energy-relevant water-splitting technique.
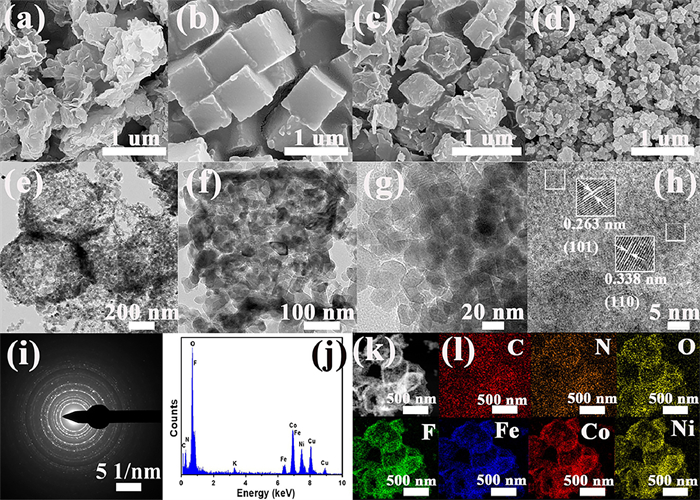
The multi-component composite materials consisting of CoNi ZIF nanosheets and CoFe-PBA nanocubes were first synthesized by hydrothermal method, and then they were further completely etched by fluoridation using NH4F at 300 ℃ to obtain the final catalyst of CoNi ZIF/CoFe-PBA-F-300 (Fig. 1). The morphology evolution from the precursors to the final catalyst was investigated by scanning electron microscope (SEM). The synthesized CoNi ZIF was assembled by some distinct nanosheets because of its instability by hydrolysis in an aqueous solution (Fig. 2a and Fig. S1a in Supporting information). The CoFe-PBA had a uniform cube morphology with a thickness of about 500 nm (Fig. 2b and Fig. S1b in Supporting information). After further hydrothermal recombination, the combination of the CoNi ZIF and CoFe-PBA was indicated by the formed hybrid morphology with nanosheet and nanocube; and the surface of the nanocube became much rougher and some were connected by the nanosheets (Fig. 2c and Fig. S1c in Supporting information). While after low-temperature fluorination, the hybrid morphology was broken, and some more nanoparticles derived from the nanocube or nanosheets were generated due to the strong fluoridation etching process (Fig. 2d and Fig. S1d in Supporting information). The local morphology of the catalyst was further observed by transmission electron microscope (TEM), and the profiles derived from the CoFe-PBA nanocubes were clearly observed, which were interconnected by some particles generated by the CoNi ZIF derivatives (Fig. 2e). The profile of the nanocube was indicated by the further magnification of the surface, they were composed of some irregular nanoparticles and some irregularly distributed pores can be observed (Figs. 2f and g); this morphology would be beneficial to the charge and mass transfer, thus improving the catalytic performance as it increases the exposure of the active site. According to Brunauer-Emmett-Teller (BET) analysis, the surface area of CoNi ZIF/CoFe-PBA-F-300 catalytic material was about 112.86 m2/g, and the average pore size was 10.03 nm, which indicated that the sample had mesoporous structure (Fig. S2 in Supporting information). In the high-resolution TEM (HRTEM) images (Fig. 2h and Fig. S3 in Supporting information), some lattice spacing of 0.263 nm and 0.338 nm were observed, which can be assigned to the (101) and (110) planes of CoF2, respectively. Several diffraction rings were observed in the selected area electron diffraction (SAED) pattern (Fig. 2i), reflecting the polycrystalline structure of the CoNi ZIF/CoFe-PBA-F-300 material. The energy-dispersive X-ray spectroscopy (EDS) of the CoNi ZIF/CoFe-PBA-F-300 material showed the presence of elements for C, N, O, F, Fe, Co, Cu and Ni elements (Fig. 2j), where the Cu elements observed in EDS come from the copper mesh used to support the catalyst in the test, and these elements were uniformly distributed in the hybrid catalyst (Figs. 2k-l).
The crystal structure of the catalyst materials and their reference samples (CoNi ZIF, CoFe-PBA, CoNi ZIF/CoFe-PBA, CoNi ZIF-F-300, CoFe-PBA-F-300 and CoNi ZIF/CoFe-PBA-F-300) were characterized by X-ray diffraction (XRD). The crystal structure changes from precursor to the corresponding fluorinated derivatized were compared, and because of the poor crystallinity of CoNi ZIF, no obvious diffractions peaks were observed (Fig. 3a). The formation of CoFe-PBA was well confirmed by the characteristic diffraction peaks corresponding to the standard PDF card (JCPDS No. 46–0907). For the hybrid CoNi ZIF/CoFe-PBA precursor, the diffraction peaks of CoFe-PBA were shifted slightly to the high direction compared to those of the pure CoFe-PBA, probably due to the structure mixing by CoNi replacing part of CoFe in the system. After fluorination at low temperatures, the crystal structure of all the precursors was changed obviously. For the CoNi ZIF-F-300, some new peaks were observed with the main peaks sitting very close to the tetragonal structure of the CoF2 phase (JCPDS No. 33–0417). Note that the crystal structure of NiF2 and CoF2 was very similar, the NiF2 might be also formed in the catalyst as indicated by these characteristic peaks located slightly between pure CoF2 and NiF2 phase (JCPDS No. 74–0917). A similar case was found in the characteristic peaks in CoFe-PBA-F-300, where several typical peaks can be attributed to hybrid peaks of FeF2 (JCPDS No. 74–0915) and CoF2 (JCPDS No. 33–0417) accompanying some minor position shifts. While for the hybrid catalyst of CoNi ZIF/CoFe-PBA-F-300, the main peaks attributed to the CoF2 phase were observed in the XRD pattern, probably due to the high amount of Co in the system. The presence of NiF2 and FeF2 might be also indicated by the wide peaks for the (101) and (211) planes of CoF2.
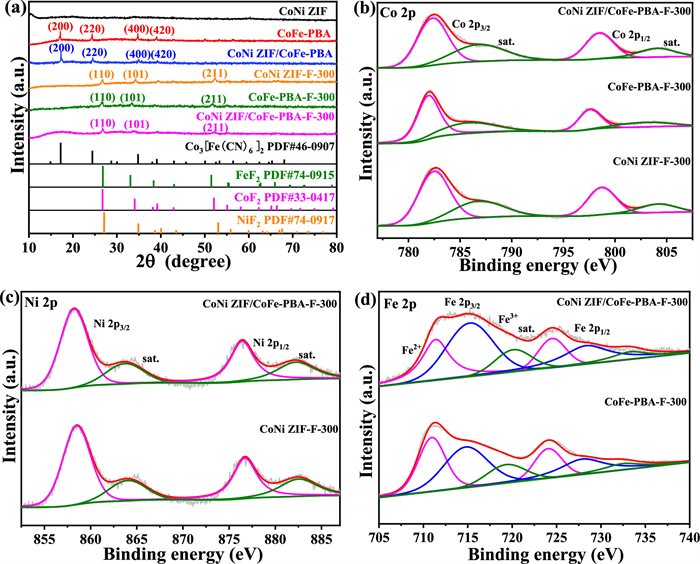
The surface chemical states of CoNi ZIF/CoFe-PBA-F-300, CoFe-PBA-F-300 and CoNi ZIF-F-300 were further analyzed by X-ray photoelectron spectroscopy (XPS) to probe the interaction of the different derivatized components, and all the binding energy were calibrated by C 1s peak at 284.8 eV (Fig. S4a in Supporting information) [43]. For Co 2p, the high-resolution spectrum had two bands of 2p3/2 and 2p1/2 due to the spin-orbit-split [44], and each band can be deconvoluted into two peaks for Co2+ and the satellite peaks (Fig. 3b). The electronegativity of element F is much larger than that of metal atoms that can extract electrons from adjacent metal atoms, which is conducive to the formation of active intermediates in the electrocatalytic process [45]. The Co–F bond was thus observed in CoNi ZIF/CoFe-PBA-F-300, CoNi ZIF-F-300 and CoFe-PBA-F-300. It can be seen that the Co 2p peak generated by CoFe-PBA-F-300 was shifted to the low binding energy direction, which indicated that the addition of Ni had an electronic effect on the chemical state change in the CoNi ZIF/CoFe-PBA-F-300 system. In the same way, the Ni 2p3/2 spectrum for CoNi ZIF/CoFe-PBA-F-300 and CoNi ZIF-F-300 samples were compared by fitting the spectrum with the Ni2+ peak accompanying the satellite peaks in Fig. 3c. The presence of the Ni-F bond was observed in both catalysts [46]. Because of the multi-component substances produced by fluoridation, the Ni 2p3/2 spectrum of CoNi ZIF/CoFe-PBA-F-300 was shifted by 0.3 eV towards the low binding energy direction compared with that of CoNi ZIF-F-300. The Fe 2p spectra for CoNi ZIF/CoFe-PBA-F-300 and CoFe-PBA-F-300 samples were also compared by fitting the spectrum with Fe2+ and Fe3+ peaks accompanying the satellite peaks (Fig. 3d). Specifically, the positions at a binding energy of 711.4 eV and 715.2 eV can be attributed the Fe2+ and Fe3+, respectively. For the high resolution of O 1s (Fig. S4b in Supporting information), the peak positions at 530.1 eV, 531.6 eV and 533.3 eV were corresponding to metal–oxygen, oxygen in the hydroxyl group, and oxygen in the surface of the adsorbed water. The N-doped carbon derived from the ZIF precursor can be further confirmed by the N 1s spectra, which can be deconvoluted pyridinic–N (398.5 eV), pyrrolic–N (399.9 eV), graphite–N (400.9 eV) as shown in Fig. S4c (Supporting information) [47]. The role of N-doped carbon could improve the electrical conductivity and stability of materials, thus improving the catalytic performance of the material [48]. The strong metal–F bond can be indicated by the peak at ca. 684.7 ± 0.2 eV in the F 1s spectrum (Fig. S4d in Supporting information) [49]. Therefore, the hybrid precursors of CoNi ZIF/CoFe-PBA were successfully transformed into metal fluorides, and the chemical environmental changes induced by the multi-component structure possessed the combined advantages such as improved conductivity, electronic effect, which would be conducive to improving the catalytic activity and stability of the catalyst.
A typical three-electrode system was utilized to examine the OER performance of the catalysts in a 1 mol/L KOH solution by loading the catalyst over the inert glassy carbon electrode (loading: 0.20 mg/cm2) (Fig. 4a). It can be seen that the precursors of CoNi ZIF and CoFe-PBA have very low activity for OER, due to less exposure of active metals and low intrinsic activity. Even though the performance can be much better for the hybrid precursor of the CoNi ZIF/CoFe-PBA, it still required a large overpotential of 320 mV to reach the kinetic current density of 10 mA/cm2. The performance can be further improved for the derivatives, where CoNi ZIF-F-300 and CoFe-PBA-F-300 required an overpotential of 310 and 280 mV to provide the current density of 10 mA/cm2, respectively. Furthermore, a significant performance boosting was found on the CoNi ZIF/CoFe-PBA-F-300 electrode which exhibited the overpotential of only 250 mV to reach 10 mA/cm2, about 70 mV and 60 mV less compared to the hybrid CoNi ZIF/CoFe-PBA electrode and commercial RuO2 (310 mV), respectively. Specifically, compared to other transition metal-based catalysts (Fe, Co and Ni) measured in similar conditions, CoNi ZIF/CoFe-PBA-F-300 electrode also displayed excellent catalytic performance (Table S1 in Supporting information). To get fair kinetic behaviors, iR compensation was done by corrected by 85% of the uncompensated resistance for CoNi ZIF/CoFe-PBA-F-300 polarization curves (Fig. S5 in Supporting information). And only 5 mV less was required to drive the kinetic current density of 10 mA/cm2 compared to the performance without iR-correction. The sensitivity of the current response to the applied potential was analyzed by Tafel slope analysis, which can be correlated to the information about the rate-determining step [50]. The CoNi ZIF/CoFe-PBA-F-300 electrode showed the lowest Tafel slope of 47.4 mV/dec (Fig. 4b), which was accorded with the catalytic step of metal oxide producing metal oxy/hydroxide through hydroxyl radical reaction [51,52]. The charge transfer kinetics was further measured through the electrochemical impedance technique (EIS) at 1.48 V (Fig. 4c), and the Nyquist plot was fitted using the Randel model equivalent to reveal the charge transfer resistance (Rct) (Fig. S6 in Supporting information). The uncompensated solution resistance (Rs) was found to be ca. 9.0 Ω, indicating a similar measurement condition. And the smallest R was no doubt observed on the CoNi ZIF/CoFe-PBA-F-300 electrode, indicating the fastest catalytic kinetic performance. Specifically, the value of Rct was 25 Ω, which was much smaller than that of CoNi ZIF (1600 Ω), CoFe-PBA (900 Ω), CoNi ZIF/CoFe-PBA (336 Ω), CoNi ZIF-F-300 (471 Ω), CoFe-PBA-F-300 (150 Ω) (Table S2 in Supporting information). This was consistent with the performance order, where the ZIF and PBA precursors had very low charge transfer ability but the fluorinated derivatives improved largely, and the hybrid derivatives of CoNi ZIF/CoFe-PBA-F-300 showed the fastest catalytic kinetics due to the improved multi-component effect and more active sites formation.

The catalytic activity of the catalyst was determined by the surface active sites, which can be estimated by the electrochemical active surface area (ECSA) and the surface roughness factor (Rf) (Fig. S7 in Supporting information) [53]. Herein, the ECSA was obtained from the electrochemical double-layer capacitance (Cdl) obtained from the cyclic voltammetry (CV) curves at various scan rates, and the R was obtained by normalizing ECSA into the geometric surface area of the electrode. Consistent with the order of the performance, the ZIF and PBA precursors showed very low Cdl, namely the low surface area; and these values of fluorinated derivatives were increased largely and CoNi ZIF/CoFe-PBA-F-300 showed the highest Cdl of 0.62 mF/cm2 corresponding to the ECSA value of 1.09 cm2 (Fig. 4d and Table S3 in Supporting information). The Rf was calculated, by comparing the fluorinated derivatives to the ZIF and PBA precursors, it was found CoNi ZIF-F-300 and CoFe-PBA-F-300 showed the Rf of 7.5 and 12.5, much higher than that of CoNi ZIF (4.75) and CoFe-PBA (5.75); furthermore, the CoNi ZIF/CoFe-PBA-F-300 showed the largest Rf (15.50) due to the combined advantages from the ZIF and PBA which offered more active sites for ready exposure to electrolytes and charge and mass transfer. In light of the different amounts of active sites and ECSA, the specific activity was calculated by normalizing the current to the corresponding ECSA to evaluate the intrinsic activity. It can be seen that the CoNi ZIF/CoFe-PBA-F-300 still showed the highest specific activity among all samples (Fig. 4e). Specifically, the current density was 1.3 mA/cm2 at 1.5 V for CoNi ZIF/CoFe-PBA-F-300 catalyst, which was about 2.2 and 4.3 times of CoFe-PBA-F-300 (0.6 mA/cm2) and CoNi ZIF-F-300 (0.3 mA/cm2). Meanwhile, the high intrinsic activity was still well supported by the turnover frequency (TOF), an important indicator of catalytic efficiency. For example, at the overpotential of 300 mV, the TOF value of CoNi ZIF/CoFe-PBA-F-300 was 0.070 s−1, which was about 23.3 times that of CoNi ZIF or CoFe-PBA (0.003 s−1), 8.8 times that of CoNi ZIF/CoFe-PBA or CoNi ZIF-F-300 (0.008 s−1) and 2.5 times of CoFe-PBA-F-300 (0.028 s−1) (Fig. 4f). The above measurements showed that the fully fluorinated CoNi ZIF/CoFe-PBA could combine the advantages of the ZIF and PBA for catalyst fabrication, which greatly increased the electrochemical surface area and active sites exposure as well as conductivity improvement.
The electrochemical stability of catalyst materials is very crucial in the potential application. Consecutive CV and chronoamperometry (CA) techniques are effective methods to evaluate performance. The polarizations before and after 1000 CV cycles were compared, and the results showed no significant performance decline in its catalytic activity, indicating good dynamic catalytic stability (Fig. 5a). The steady-state ability was probed by CA test at 1.48 V and very good stability was also observed during the operation of 14 h (inset of Fig. 5a). The current efficiency was also evaluated by comparing the theoretical amount of oxygen produced with the actual amount of oxygen produced during the electrolysis for 60 min (Fig. 5b). The results showed that the actual amount of oxygen produced was similar to the theoretical amount, indicating a current efficiency of oxygen evolution close to 100%.

In addition, the influence of fluorination temperature on the catalytic performance of the catalyst was also discussed. For easy comparison, the CoNi ZIF/CoFe-PBA fluorinated at 200 and 400 ℃ were prepared and the crystal structure was analyzed by XRD (Fig. S8 in Supporting information). It was found that CoNi ZIF/CoFe-PBA-F-200 was not well fluorinated as indicated by some characteristic peaks of the Co3[Fe(CN)6]2 (JCPDS No. 46–0907) from the CoFe-PBA; while by increasing the temperature, the impurity peaks disappeared, and the crystal structure was changed to the fully fluorinated production with the main species of CoF2 phase; and no significant difference was found in the samples of CoNi ZIF/CoFe-PBA-F-400 and CoNi ZIF/CoFe-PBA-F-300, indicating the complete fluorination of the precursors. Among them, CoNi ZIF/CoFe-PBA-F-300 still showed the lowest overpotential (Fig. S9a in Supporting information), Tafel slope (Fig. S9b in Supporting information) and charge transfer impedance (Fig. S9c and Table S4 in Supporting information) for OER, indicating the best approach to obtain the final catalyst. It also showed the largest ECSA and Rf values (Fig. S10 and Table S5 in Supporting information), indicating the optimal fluorination temperature for the catalyst fabrication; namely, the higher temperature might lead to the over-destruction of the samples resulting in low surface area and roughness, and the lower temperature would cause partial fluorination leading to insufficient active sites formation and low intrinsic activity.
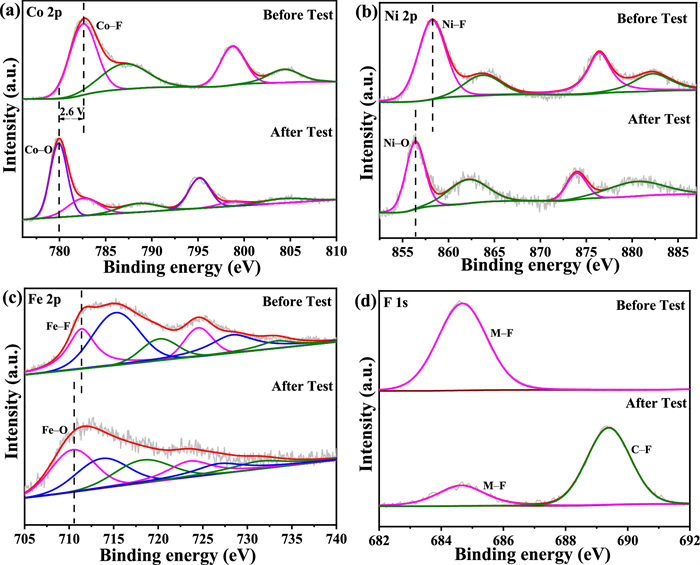
Finally, the crystal structure, morphology and surface chemical environment of the catalyst after the long-term electrochemical stability test were studied. The crystal structure was characterized by XRD. Fig. S11 (Supporting information) shows that the intensity of the characteristic peak related to fluoride is obviously weakened after the OER reaction, which indicates that metal fluoride changes to oxide during high potential oxidation. During the OER process, the surface of the catalyst becomes rougher and rougher due to surface oxidation, and some neat surfaces would be destroyed as indicated in the TEM images (Fig. 6a and Fig. S12 in Supporting information). The lattice spacing corresponding to CoF2 (110) and (200) planes were still found in the HRTEM images, indicating some fluorides present in the system but the surface changes due to oxidation indeed occurred (Figs. 6b and c). The polycrystalline structure was still visible in the SAED pattern, while the diffraction spots or rings became much weaker probably due to the surface oxide species formation (Fig. 6d). The presence of Fe, Co and Ni elements was still clearly shown in the EDS spectrum and the elemental mapping images (Figs. 6e-g). The chemical state of these metal elements was further probed by XPS spectra (Fig. S13a in Supporting information). The profile of the Co 2p peak was changed obviously after the stability test (Fig. 7a). Specifically, the dominant peak of Co 2p3/2 was observed at 780.0 eV, which was about 2.6 eV less than the peak of the Co–F bond at 782.6 eV, indicating the surface structure transformation from Co–F bond to Co oxy/hydroxide species during the electrochemical test driven by the chemical dissociation and electrochemical oxidation at high potentials [54-56]. This change enhances the conductivity of the catalyst, thus further improving its catalytic performance [57]. Similar case was also found in the Ni 2p spectrum (Fig. 7b): The Ni–F bond was shifted towards the lower binding energy direction after the stability test, due to the breaking of Ni–F bonds and the formation of Ni–O bonds [58]. A similar situation also occurred in the Fe element, where the main peak was shifted to the low binding energy direction by transferring the Fe–F bonds to the Fe–O species (Fig. 7c). The above analysis shows that the metal–F bond will be easily transformed into the corresponding MO and MOOH (M = metal) driven by the high potentials, and the in situ generated metal oxy/hydroxide species will become the active phase to promote the catalytic performance [59]. The fluorine has strong electronegativity and the formed metal fluoride has strong metal–F ionic bonds which will be easy to dissociate in the alkaline electrolyte to form metal oxy/hydroxide over the surface, thus promoting the OER process. Due to the surface oxidation at high potential and surface passivation in a strongly alkaline solution, a large decrease in peak intensity of the metal–F bond was observed in the F 1s spectrum (Fig. 7d) [60]. The new peak located at around 689.3 eV was assigned to the C–F bond from the Nafion solution used as a binder in the catalyst ink preparation. The transformation from the metal–F bonds to the metal–O bonds was also indicated in the O 1s spectra, where more amount of metal–O, and metal–OH peaks were indicated (Fig. S13b in Supporting information). Herein, it can conclude that the facile surface reconstruction of the high polar fluoride catalyst would be easy to form the active phase for OER.

In summary, the fully fluorinated multi-component composite of CoNi ZIF nanosheets and CoFe-PBA nanocubes was demonstrated as an efficient catalyst for OER in the alkaline electrolyte due to the combined advantages. Specifically, the good conductivity of N-doped carbon derived from the CoNi ZIF and the facile active site exposure and large roughness factor derived from the CoFe-PBA synergistically promoted the catalytic activity and kinetics for OER. Experimental results showed that CoNi ZIF/CoFe-PBA-F-300 exhibited the excellent OER performance of only 250 mV overpotential to reach 10 mA/cm2, with a small Tafel slope of 47.4 mV/dec and high catalytic stability. The combined advantages of multicomponent composite by full fluoridation were also demonstrated compared to their precursors of the single component and their fluoridation derivatives. The high catalytic performance can be attributed to the high electrochemical surface area induced by the multi-component mixed structure and fluorination etching, more exposed metal active sites, and the formation of high-valence-state metal active phases induced by the high polarity of ionic bonds in the metal fluoride. This work further expands the application of ZIF-derived multi-component composite materials in electrocatalysis for energy conversion and storage.
The authors declare no conflict of interest.
The author appreciated the finical support of the National Natural Science Foundation of China (Nos. 21972124, 22272148), a project funded by the Priority Academic Program Development of Jiangsu Higher Education Institution.
Supplementary material associated with this article can be found, in the online version, at doi:
M. Jamesh, M. Harb, J. Energy Chem. 56 (2021) 299–342. doi: 10.1016/j.jechem.2020.08.001
M. Li, L. Feng, Chin. J. Struc. Chem. 41 (2022) 2201019–2201024.
L. Lu, Q. Li, J. Du, et al., Chin. Chem. Lett. 33 (2022) 2928–2932. doi: 10.1016/j.cclet.2021.10.090
F. Gao, J. He, H. Wang, et al., Nano Res. Energy 1 (2022) e9120029. doi: 10.26599/nre.2022.9120029
Y. Zhou, Q. Wang, X. Tian, et al., J. Energy Chem. 75 (2022) 46–54. doi: 10.1117/12.2644115
S. Wang, J. Zhu, X. Wu, et al., Chin. Chem. Lett. 33 (2022) 1105–1109. doi: 10.1021/acs.orglett.2c00084
Y. Zhou, Y. Kuang, G. Hu, et al., Mater. Today Phys. 27 (2022) 100831. doi: 10.1016/j.mtphys.2022.100831
Z. Yin, R. He, Y. Zhang, et al., J. Energy Chem. 69 (2022) 585–592. doi: 10.1016/j.jechem.2022.01.020
M. Li, F. Yang, J. Chang, et al., Acta Phys. Chim. Sin. 39 (2023) 2301005. doi: 10.3866/pku.whxb202301005
S. Wang, L. Zhao, J. Li, et al., J. Energy Chem. 66 (2022) 483–492. doi: 10.1016/j.jechem.2021.08.042
C. Wang, A. Schechter, L. Feng, Nano Res. Energy 2 (2023) e9120056. doi: 10.26599/nre.2023.9120056
Y. Zhao, M. Xi, Y. Qi, et al., J. Energy Chem. 69 (2022) 330–337. doi: 10.1016/j.jechem.2022.01.030
Y. Liu, L. Bai, Q. Jia, et al., Chin. Chem. Lett. 34 (2023) 107855. doi: 10.1016/j.cclet.2022.107855
J. Xie, X. Zhang, N. Yu, et al., Mater. Today Phys. 27 (2022) 100778. doi: 10.1016/j.mtphys.2022.100778
X. Li, L. Zheng, S. Liu, et al., Chin. Chem. Lett. 33 (2022) 4761–4765. doi: 10.1016/j.cclet.2021.12.095
K. Sun, Y. Zhao, J. Yin, et al., Acta Phys. Chim. Sin. 38 (2022) 2107005.
L. Lv, B. Tang, Q. Ji, et al., Chin. Chem. Lett. 34 (2023) 107524. doi: 10.1016/j.cclet.2022.05.038
L. Bai, C. Hsu, D.T.L. Alexander, et al., J. Am. Chem. Soc. 141 (2019) 14190–14199. doi: 10.1021/jacs.9b05268
M. Xiao, C. Zhang, P. Wang, et al., Mater. Today Phys. 24 (2022) 100684. doi: 10.1016/j.mtphys.2022.100684
L. Jiao, J.Y.R. Seow, W.S. Skinner, et al., Mater. Today 27 (2019) 43–68. doi: 10.1016/j.mattod.2018.10.038
M. Liu, M. Peng, B. Dong, et al., Chin. J. Struct. Chem. 41 (2022) 2207046–2207052.
M. Li, L. Feng, J. Electrochem. 28 (2022) 2106211.
K. Karuppasamy, R. Bose, D. Vikraman, et al., J. Alloy. Compd. 934 (2023) 167909. doi: 10.1016/j.jallcom.2022.167909
Q. Zhang, H. Wang, W. Han, et al., Nano Res. 16 (2023) 3695–3702. doi: 10.1007/s12274-022-4832-2
X. Hou, T. Jiang, X. Xu, et al., Chin. J. Struc. Chem. 41 (2022) 2207074–2207080.
S. Kouser, A. Hezam, M.J.N. Khadri, et al., J. Porous Mater. 29 (2022) 663–681. doi: 10.1007/s10934-021-01184-z
C. Chen, D. Xiong, M. Gu, et al., ACS Appl. Mater. Interfaces 12 (2020) 35365–35374. doi: 10.1021/acsami.0c09689
C. Liu, L. Lin, Q. Sun, et al., Chem. Sci. 11 (2020) 3680–3686. doi: 10.1039/d0sc00417k
H. Zou, X. Liu, K. Wang, et al., Chem. Commun. 57 (2021) 8011–8014. doi: 10.1039/d1cc02224e
C. Xuan, W. Lei, J. Wang, et al., J. Mater. Chem. A 7 (2019) 12350–12357. doi: 10.1039/c9ta02761k
N. Ma, R. Ohtani, H.M. Le, et al., Nat. Commun. 13 (2022) 4023. doi: 10.1038/s41467-022-31658-w
A. Shahzad, F. Zulfiqar, M. Arif Nadeem, Coordin. Chem. Rev. 477 (2023) 214925. doi: 10.1016/j.ccr.2022.214925
S.S. Selvasundarasekar, T.K. Bijoy, S. Kumaravel, et al., ACS Appl. Mater. Interfaces 14 (2022) 46581–46594. doi: 10.1021/acsami.2c12643
S. Ghoshal, S. Zaccarine, G.C. Anderson, et al., ACS Appl. Energy Mater. 2 (2019) 5568–5576. doi: 10.1021/acsaem.9b00733
X. Wang, L. Yu, B. Guan, et al., Adv. Mater. 30 (2018) 1801211. doi: 10.1002/adma.201801211
X. Gu, Z. Liu, H. Liu, et al., Chem. Eng. J. 403 (2021) 126371. doi: 10.1016/j.cej.2020.126371
Y. Tian, H. Wu, A. Hanif, et al., Chin. Chem. Lett. 34 (2023) 108056. doi: 10.1016/j.cclet.2022.108056
M. Li, X. Pan, M. Jiang, et al., Chem. Eng. J. 395 (2020) 125160. doi: 10.1016/j.cej.2020.125160
G.H. Jeong, S.P. Sasikala, T. Yun, et al., Adv. Mater. 32 (2020) 1907006. doi: 10.1002/adma.201907006
M. Zha, C. Pei, Q. Wang, et al., J. Energy Chem. 47 (2020) 166–171. doi: 10.1016/j.jechem.2019.12.008
H. Liu, M. Zha, Z. Liu, et al., Chem. Commun. 56 (2020) 7889–7892. doi: 10.1039/d0cc03422c
B. Zhang, K. Jiang, H. Wang, et al., Nano Lett. 19 (2019) 530–537. doi: 10.1021/acs.nanolett.8b04466
L. Zhong, Y. Bao, L. Feng, Electrochim. Acta 321 (2019) 134656. doi: 10.1016/j.electacta.2019.134656
L. Zhuang, L. Ge, Y. Yang, et al., Adv. Mater. 29 (2017) 1606793. doi: 10.1002/adma.201606793
M. Li, H. Liu, L. Feng, Electrochem. Commun. 122 (2021) 106901. doi: 10.1016/j.elecom.2020.106901
H. Liu, Z. Liu, L. Feng, Nanoscale 11 (2019) 16017–16025. doi: 10.1039/c9nr05204f
J. Wen, J. Xie, H. Zhang, et al., ACS Appl. Mater. Interfaces 9 (2017) 14031–14042. doi: 10.1021/acsami.7b02701
Q. Lv, W. Si, J. He, et al., Nat. Commun. 9 (2018) 3376. doi: 10.1038/s41467-018-05878-y
C. Pei, H. Chen, B. Dong, et al., J. Power. Sources 424 (2019) 131–137. doi: 10.1016/j.jpowsour.2019.03.089
S. Divanis, T. Kutlusoy, I.M. Ingmer Boye, et al., Chem. Sci. 11 (2020) 2943–2950. doi: 10.1039/c9sc05897d
Y. Zhou, H. Liu, X. Gu, et al., Carbon Energy 4 (2022) 924–938. doi: 10.1002/cey2.206
K. Fan, H. Chen, Y. Ji, et al., Nat. Commun. 7 (2016) 11981. doi: 10.1038/ncomms11981
R. He, M. Li, W. Qiao, et al., Chem. Eng. J. 423 (2021) 130168. doi: 10.1016/j.cej.2021.130168
Y. Kuang, R. He, X. Gu, et al., Chem. Eng. J. 456 (2023) 141055. doi: 10.1016/j.cej.2022.141055
G. Moon, M. Yu, C.K. Chan, et al., Angew. Chem. Int. Ed. 58 (2019) 3491–3495. doi: 10.1002/anie.201813052
Z. Liu, H. Liu, X. Gu, et al., Chem. Eng. J. 397 (2020) 125500. doi: 10.1016/j.cej.2020.125500
M.B. Stevens, L.J. Enman, A.S. Batchellor, et al., Chem. Mater. 29 (2017) 120–140. doi: 10.1021/acs.chemmater.6b02796
Q. Qian, Y. Li, Y. Liu, et al., Adv. Mater. 31 (2019) 1901139. doi: 10.1002/adma.201901139
Q. Qian, Y. Li, Y. Liu, et al., Appl. Catal. B: Environ. 266 (2020) 118642. doi: 10.1016/j.apcatb.2020.118642
Z. Liu, H. Yu, B. Dong, et al., Nanoscale 10 (2018) 16911–16918. doi: 10.1039/c8nr05587d

Figure 2 SEM images of (a) CoNi ZIF, (b) CoFe-PBA, (c) CoNi ZIF/CoFe-PBA and (d) CoNi ZIF/CoFe-PBA-F-300 samples. (e-g) TEM images, (h) HRTEM image, (i) SAED, (j) EDS spectrum (k) STEM image and (l) elemental mappings of CoNi ZIF/CoFe-PBA-F-300 catalyst.

Figure 3 (a) XRD patterns of CoNi ZIF, CoFe-PBA, CoNi ZIF/CoFe-PBA, CoNi ZIF-F-300, CoFe-PBA-F-300 and CoNi ZIF/CoFe-PBA-F-300 samples. The high-resolution spectrum of (b) Co 2p, (c) Ni 2p and (d) Fe 2p of the corresponding CoNi ZIF/CoFe-PBA-F-300, CoFe-PBA-F-300 and CoNi ZIF-F-300 samples.

Figure 4 (a) The polarization curves recorded at scan rate 5 mV/s in 1 mol/L KOH solution (No iR correction). (b) Tafel slopes. (c) Nyquist plots at an overpotential of 250 mV. (d) Linear plots of capacitive current density vs. scan rate, (e) The specific activity and (f) TOF value of CoNi ZIF, CoFe-PBA, CoNi ZIF/CoFe-PBA, CoNi ZIF/CoFe-PBA-F-300, CoNi ZIF-F-300 and CoFe-PBA-F-300 samples.

Figure 5 (a) Polarization curves before and after the durability test. Inset: Time-dependent current curve for CoNi ZIF/CoFe-PBA-F-300 at 1.48 V vs. RHE. (b) Faradic efficiency and corresponding current efficiency of OER for CoNi ZIF/CoFe-PBA-F-300 sample.

Figure 6 (a) TEM image, (b, c) HRTEM images, (d) SAED pattern, (e) EDS spectrum, (f) STEM image and (g) elemental mappings of CoNi ZIF/CoFe-PBA-F-300 catalyst after electrochemical test stability to OER.

 扫一扫看文章

扫一扫关注我们
 DownLoad:

 下载:
下载:
