Figure 1.
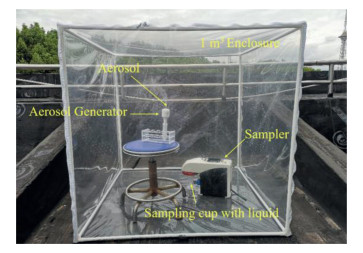
Sampling scene.
Novel aerosol detection platform for SARS-CoV-2: Based on specific magnetic nanoparticles adsorption sampling and digital droplet PCR detection
Hui Chen , Xinye Ma , Xinyu Zhang , Gui Hu , Yan Deng , Song Li , Zhu Chen , Nongyue He , Yanqi Wu , Zhihong Jiang

Since the infection of Covid-19 in 2019, it has caused a large-scale spread of the epidemic due to its strong transmissibility, bringing inconvenience and irreparable losses to people all over the world. This ferocious virus has attracted more and more attention [1-4]. Some scholars boldly speculate that the novel coronavirus is transmitted through aerosols, and many researchers have verified this conjecture through experiments [5-8]. Trisha Greenhalgh et al. cited ten pieces of evidence together to support Covid-19 mainly through the air propagation hypothesis, from the super-transmission events, indoor propagation was higher than outdoor, in the air to detect viable novel coronavirus, etc. [9]. Lednicky et al. had detected novel coronavirus by collecting the air at a distance of 480 m near the patients, thus confirming that aerosols could be used as the transmission route of novel coronavirus [10].
Research shows that novel coronavirus is mainly spread in densely populated and closed places, such as aircraft cabins, trains, classrooms, where high concentrations and high survivability of novel coronavirus aerosols can be detected [11-13]. Therefore, it is very important to carry out routine aerosol detection in these places. Air sampling and microbial detection are important links in aerosol detection, so efficient sampling and high-sensitivity detection methods are the guarantees for effective microbial aerosol detection [14-17].
There are many methods for airborne microbial aerosol sampling, such as: natural sedimentation method, solid impact method, liquid impact method, centrifugal method, cyclone method, electrostatic adsorption method [18]. Liquid-phase cyclone aerosol samplers are usually used to collect virus aerosols, and molecular detection can be performed directly without culture counting after sampling. Compared with other samplers, it is simple to operate, and can effectively collect aerosol particles of various sizes, which is very suitable for the recent collection of SARS-CoV-2 aerosols.
Magnetic nanoparticles (MNPs) are new materials with rapid development and great application value in many fields of modern science, such as biomedicine, magnetic fluid, catalysis, nuclear magnetic resonance imaging, data storage and environmental protection [19-21]. With the rapid development of different technologies and molecular biological detection, people are no longer constrained to observe the morphology of microorganisms with the original microscope, but have begun to identify smaller molecular structures and molecular biology, and magnetic nanomaterials have been more widely used in them [22-24]. In daily detection, researchers often use culture counting method, nucleic acid detection and immunological detection technology [25-27].
At present, magnetic nanoparticles are mainly used in biomedicine in magnetic separation [28, 29], magnetic transfection, nucleic acid/protein/virus/bacteria detection [30-32], immunoanalysis [33] magnetic drug targeting [34], tumor hyperthermia [35, 36], magnetic resonance imaging and sensors. After the outbreak of COVID-19, people are also pursuing rapid detection, trying to identify the virus and its content quickly and accurately. Currently, we mainly adopted reverse transcriptase quantitative polymerase chain reaction (RT-qPCR) to detect SARS-CoV-2 in clinic [37]. With the development and mutation of SARS-CoV-2, false negative results will appear from time to time during detection, so the use of more sensitive and accurate diagnostic techniques is advocated. Digital PCR technology is the third generation PCR technology, and it is also a highly sensitive detection method for the direct detection and quantification of DNA and RNA targets. It can realize the absolute quantification of nucleic acid molecules, and is the basic supporting technical means of precision medicine. Due to its wide application prospects, it has attracted the attention of various countries in recent years [38-41].
Due to the relatively low concentration of airborne microbial novel coronavirus aerosols, its detection requires high efficiency at every step. Based on this requirement, in this study, we built a platform for aerosol detection and conducted a simulation experiment on the novel coronavirus aerosol in the air. The novel coronavirus aerosols with known different concentration gradients were simulated in a custom-made 1 m3 closed cover, and a cyclone air sampler was used for aerosol sampling. Extracted and purified the sampling liquid, and then ddPCR (Digital droplet PCR), and compared with the results of real-time fluorescence PCR. According to the results of ddPCR, the detection efficiency of the platform is evaluated, which provides a basis for applying the platform to the actual detection of novel coronavirus aerosols, and further provides a theoretical basis for estimating the concentration of novel coronavirus aerosols in the air.
We customized a 1 m3 closed cover in order to simulate aerosols in a fixed volume area. One side of the closed cover could be opened by zipper to facilitate the placement of aerosol generator and sampler inside. Liu et al.'s research [42] mentioned that the particle size distribution of SARS-CoV-2 aerosols was mainly in two size ranges, one in the submicron range (0.25–1.0 µm) and the other in the supermicron range (greater than 2.5 µm). Submicron aerosols may initially come from the direct deposition of droplets in the patient's respiratory tract or the deposition of SARS-CoV-2 in the air. The aerosol generator we selected produced a nano-scale fine mist, which conformed to the particle size of the novel coronavirus aerosol in the sub-micron range. A cyclone air sampler (ASP-200p, Shenzhen Lemniscare Medical Technology Co., Ltd., China) was used for sampling, and the sampling flow and time were set to 200 lpm, 15 min, and 15 mL of sampling liquid, respectively.
The sampling scene was shown in Fig. 1. The sampling process was carried out on the roof terrace of the laboratory with good ventilation. Opened the closed hood for ventilation for half an hour, then put the aerosol generator and the air sampler together into the closed hood and turned on. After 5 min, turned off the aerosol generator, and continued to sample for another 10 min. After sampling completed, the air sampler stopped automatically. Opened the closed cover, took out the sampler, took off the sampling cup and tightened the cover with the matching cover, wiped the inner wall of the closed cover with water and 75% alcohol twice each, and then ventilated for half an hour, and cleaned the sampler at the same time. After sampling, nucleic acid extraction by magnetic bead method was performed on the sampling liquid in the sampling cup, and then ddPCR and fluorescent reverse transcription-Polymerase Chain Reaction detection were performed.
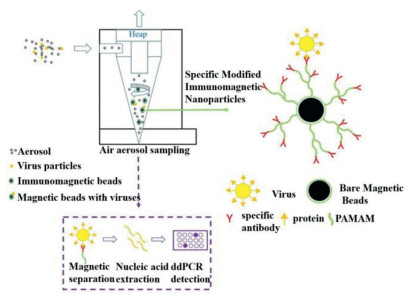
The final sample solution is 10–15 mL. If all of the sample is used for nucleic acid extraction, the sample volume will be relatively large and the operation will be cumbersome; if only a small part is taken for nucleic acid extraction, it may not be detected for low-concentration samples, which will affect detection sensitivity of the system. In order to perform nucleic acid extraction and detection in all the sampling solution, we added specifically modified immunomagnetic nanoparticles to the sampling solution, which can absorb the collected virus particles during the sampling process [43, 44]. After the sampling is completed, the sampling solution is subjected to magnetic separation, the supernatant is removed, and 300 µL of the sampling solution is retained to mix the magnetic particles, and nucleic acid extraction is performed on the sampling magnetic bead mixture. The principle of virus adsorption by specific magnetic nanoparticles and the sampling and detection process of the whole system are shown in Fig. 2.
In order to test the detection efficiency of the system and the detection effect and linearity of the digital PCR and real time fluorescent PCR, we separately configured 6 different concentration gradients (106, 105, 104, 103, 102 and 101 copies/mL) of the novel coronavirus pseudo virus solutions with 15 mL each, and sampled each pseudo virus solution for testing. The concentration factor of the pseudo virus solution was 2.5. Took 200 µL of 108 copies/mL pseudo virus solution to a centrifuge tube, added 19.8 mL of deionized water to constant volume to 106 copies/mL, then took 15 mL for sampling and standby, took 2 mL from the remaining 5 mL solution to the centrifuge tube, added 18 mL deionized water to constant volume to 105 copies/mL, and diluted the following concentration gradients in sequence, and took 15 mL each for standby. We have prepared two closed covers, one for the sampling of 106, 105 and 104 copies/mL and the other for the sampling of 103, 102 and 101 copies/mL. The sampling sequence in each enclosure was from low to high concentration. After each sampling, replaced the cotton core in the aerosol generator with a new one, cleaned and ventilated the closed cover, and cleaned the sampler. The spray volume of the aerosol generator was 35 mL/h, and the pseudovirus solution produced in 5 min of work is approximately 3 mL. Therefore, 3 mL of pseudovirus aerosol was generated in the 1 m3 enclosure for each sampling.
Firstly, the sampled liquid was automatically extracted by the instrument (Shenzhen Lemniscare Medical Technology Co., Ltd., China) according to the instructions of the magnetic bead method RNA extraction kit (Magnetic Bead Method-RNA Extraction Kit, Shenzhen Lemniscare Medical Technology Co., Ltd., China). The extracted nucleic acid was finally stored in 100 µL of eluate for subsequent amplification. ddPCR was performed on a digital PCR instrument OsciDrop® (Beijing Da Wei Biotechnology Co., Ltd., China). The system was divided into three parts: droplet generator, PCR amplification instrument and fluorescence reader, which could complete the detection of digital PCR within two and a half hours. Real-time PCR was performed on Lightcycler 96 (Roche, Switzerland).
Primer and probe sequences of ORF1ab gene of 2019-nCoV recommended by Chinese Center for Disease Control and Prevention (China CDC) was synthesized and checked by Sangon Biotech Company (Shanghai, China). The primer and probe sequences for the ORF1ab gene are: 5′-CCCTGTGGGTTTTACACTTAA-3′ (forward), 5′-ACGATTGTGCATCAGCTGA-3′ (reverse) and 5′-FAM-CCGTCTGCGGTATGTGGAAAGGTTATGG-BHQ1-3′ (probe).
Reaction solution components: Mix buffer: 12.5 µL; reverse transcriptase and DNA polymerase mixture 0.6 µL; primer and probe mix 1.25 µL; template 6.25 µL, total system 25 µL, the rest is filled with deionized water. The actual reaction system used to generate microdroplets was 20 µL, and the template proportion was 5 µL.
Reaction conditions: Perform reverse transcription at 55 ℃ for 15 min, pre-deformation at 95 ℃ for 30 s, and then the PCR cycle process. PCR cycling consisted of a denaturation step at 95 ℃ for 5 s followed by annealing/extension at 60 ℃ for 30 s, 45 cycles. Fluorescence detection after annealing in each cycle.
The total reaction system of real-time fluorescent PCR was 20 µL, and the components and conditions were the same as those of digital PCR.
Took 200 µL of pseudovirus solutions of 106, 105 and 104 copies/mL for nucleic acid extraction, respectively. Then 6.25 µL were taken from the 100 µL extraction solution for ddPCR and RT-PCR detection. The efficiency of nucleic acid extraction was calculated from the detection results. RT-PCR results were used for comparison.
First, 15 mL of 104 copies/mL pseudo virus solution was sampled for 15 min, then nucleic acid extraction was performed, and ddPCR detection was performed after extraction. By analyzing and calculating the detection results of 104 copies/mL concentration, the sampling volume per 1 m3 can be obtained, and then the sampling efficiency of the whole system can be calculated.
In addition, 15 mL of pseudovirus solutions of 106, 105, 104, 103, 102 and 101 copies/mL were sampled for 15 min, respectively. After sampling, the six sampling solutions with different concentration gradients were extracted, and then ddPCR and RT-PCR were performed, respectively. Compare the detection results to determine the sensitivity of the two detection methods. The actual detected copy number is calculated as follows (Eq. 1):
|
|
(1) |
where C is the actual detected copy number; c is the concentration detected by the digital PCR instrument; T is total reaction system; t is amount of template added; e is volume of eluent.
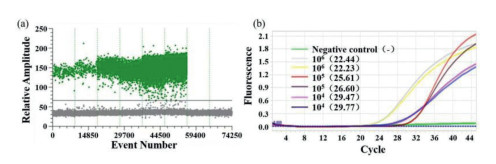
The extraction efficiency of the extraction process was obtained by divided the original copy number and multiplied by the percentage. So, depending on the experimental system, C = c × 20/5 × 100. The ddPCR detection results of 106, 105 and 104 copies/mL were shown in Table S1 (Supporting information) and Fig. 3a, and the RT-PCR detection results were shown in Fig. 3b. As can be seen from Fig. 3, the number of positive droplets detected by digital PCR of high-concentration was significantly higher, and the detected concentrations in Table S1 were basically 10 times different. From the CT value difference of RT-PCR in Fig. 3b, it was found that the detection results were basically in a 10-fold relationship.
By calculating the mean concentration of two parallel samples of each concentration in Table S1 to obtain c, the extraction efficiencies of pseudovirus solutions of 106, 105 and 104 copies/mL can be obtained as 99.52%, 98.31%, and 97.88%, respectively. So the average extraction efficiency was 98.57%. 3 mL of 104 copies/mL pseudovirus solution were sampled and extracted, and the detected concentration after ddPCR were 55.02 copies/µL. The sampling volume of the whole system for the pseudovirus solution of 104 copies/mL is 55.02 × 20/5 × 100 = 22, 008 copies, the number of copies before sampling is 3 × 2.5 × 104 copies, the detection efficiency of the whole system is 29.344%, detection efficiency is the product of extraction efficiency and sampling efficiency, so the sampling efficiency within 1 m3 is 29.344%/98.57% × 100% = 29.77%.
The RT-PCR results of 106, 105, 104, 103 and 102 copies/mL after sampling are shown in Fig. S1a (Supporting information). According to the amplification curve and CT value, it can be seen that the detection limit of RT-PCR is 103 copies/mL. The fitted curve of the CT value and the original concentration was shown in Fig. S1b (Supporting information), which is linear as a whole and has a good linearity.
The ddPCR results are shown in Table S2 (Supporting information) and Fig. 4. According to the scatter plot of ddPCR (Fig. 4) and the concentration shown in the Table S2, it can be concluded that the detection limit of ddPCR was 102 copies/mL. Since the sampling volume in the sampling process cannot be strictly controlled and precise, the gradient concentration of ddPCR does not show linearity. We extracted the collected 106 copies/mL sampling solution and diluted it to 101 copies/mL with a 10-fold gradient concentration, and then performed ddPCR. The number of viruses detected at each concentration is shown in Table S3 (Supporting information). The linear relationship between the detection amount and the original concentration is shown in Fig. S2 (Supporting information). The detection results were linear, indicating that the detection consistency of ddPCR was good.
Comparing the detection limits of the two detection methods for aerosol collection in the air, the detection limit of ddPCR is better than that of RT-PCR, which reflects the advantages of digital PCR for the detection of samples with low copy concentration.
For the sampling of aerosols in the air, various sampling methods have their own unique advantages and disadvantages, and the appearance of various samplers has greatly promoted the research of airborne microbial aerosols. Although the natural sedimentation method can maintain good biological activity, it will leak the outside air when collecting microorganisms in the air, so it is not suitable for virus sampling. Compared with the natural sedimentation method, the active sampling method is more practical and the collection volume is higher. Compared with the solid impact sampler, the liquid impact sampler has a larger flow rate and can also reduce the damage to the microbial morphology, and does not require complicated secondary culture technology, and can be directly added to the liquid medium for culture. However, based on the requirements of portability, rapidity and convenience of subsequent detection, the cyclone-type sampler has obvious advantages. In terms of nucleic acid detection, digital PCR is increasingly used in infectious disease environment, especially because it can consistently and reliably detect several copies of virus genome. Regardless of the need to detect the presence of low levels and/or residual virus, quantitative data obtained by ddPCR are more informative than those provided by standard RT-PCR assays.
This detection system combines the two technologies to simulate the detection of SARS-CoV-2 aerosols. First, the feasibility of aerosol detection is verified, and the influencing factors in the detection process, such as sampling efficiency and extraction efficiency, were experimentally tested. The detection limit of aerosol concentration was tested on the basis, which was an order of magnitude higher than the gold standard method RT-PCR. In addition, in order to improve the sensitivity of sample detection, immunomagnetic nanoparticles were used to adsorb aerosol viruses during the sampling process, which facilitated the extraction of all samples.
The system for air aerosol detection in this paper, that is, cyclone air sampling combined with magnetic bead method nucleic acid extraction and ddPCR detection, the minimum detection limit per unit volume of aerosols is 250 copies (102 copies/mL, concentration factor 2.5), and the extraction efficiency and sampling efficiency in the whole system are obtained by determination. These results can provide a certain theoretical basis and calculation basis for the actual air sample detection and result judgment. Of course, this system is not only used for the detection of novel coronavirus aerosols, but also for other pathogenic bacteria in the air. The place of application can be the outdoor environment, but also the densely populated or aerosol infection-prone places such as hospitals and railway stations.
For the detection of lower concentrations of aerosols, it is necessary to perform multiple repeated tests according to the characteristics of digital PCR to determine the results. We will complete this part of the work later, and will continue to test the entire system for actual air samples, not limited to the SARS-CoV-2, but also other infectious disease pathogens, such as respiratory viruses in the hospital infection department, in order to provide more methods and measures for the prevention and control of nosocomial infections.
The authors declare that they have no known competing financial interests or personal relationships that could have appeared to influence the work reported in this paper.
This work is supported by the NSFC (Nos. 61701176 and 62071119), Macao FDCT (No. 0065/2020/A2), Natural Science Foundation of Hunan Province of China (Nos. 2022JJ50052, 2018JJ3130 and 2020JJ5145), Hunan Key R & D Projects (No. 2021SK2003), Nanjing Important Science & Technology Specific Projects (No. 2021-11005), 2022 Special Project for the Construction of Innovative Provinces to Fight the COVID-19 Outbreak (No. 2022SK2115) and Open Funding of State Key Laboratory of Oral Diseases (No. SKLOD2022OF05).
Supplementary material associated with this article can be found, in the online version, at doi:10.1016/j.cclet.2022.07.044.
V. Vuorinen, M. Aarnio, M. Alava, et al., Saf. Sci. 130 (2020) 104866. doi: 10.1016/j.ssci.2020.104866
T. Kustin, N. Harel, U. Finkel, et al., Nat. Med. 27 (2021) 1379–1384. doi: 10.1038/s41591-021-01413-7
N.A. Kennedy, J.R. Goodhand, C. Bewshea, et al., Gut 70 (2021) 865–875. doi: 10.1136/gutjnl-2021-324388
Z. Bi, W. Hong, J. Yang, S. Lu, X. Peng, MedComm 2 (2021) 548–568. doi: 10.1002/mco2.98
L. Comber, E.O. Murchu, L. Drummond, et al., Rev. Med. Virol. 31 (2021) e2184.
J.T. Borges, L. Nakada, M.G. Maniero, et al., Environ. Sci. Pollut. Res. 28 (2021) 40460–40473. doi: 10.1007/s11356-021-13001-w
S. Tang, Y. Mao, R.M. Jones, et al., Environ. Int. 144 (2020) 106039. doi: 10.1016/j.envint.2020.106039
P.Y. Chia, K.K. Coleman, Y.K. Tan, et al., Nat. Commun. 11 (2020) 2800. doi: 10.1038/s41467-020-16670-2
T. Greenhalgh, P. Thompson, S. Weiringa, et al., BMJ Open. 10 (2020) e042626. doi: 10.1136/bmjopen-2020-042626
J.A. Lednicky, M. Lauzardo, Z.H. Fan, et al., Int. J. Infect. Dis. 100 (2020) 476–482. doi: 10.1016/j.ijid.2020.09.025
D. Pba, B. Lz, D. Sla, et al., Environ. Res. 198 (2021) 111200. doi: 10.1016/j.envres.2021.111200
B. Dxza, J. Hosp. Infect. 105 (2020) 577–579. doi: 10.1016/j.jhin.2020.05.001
B.L. Augenbraun, Z.D. Lasner, D. Mitra, et al., J. Occup. Environ. Hyg. 17 (2020) 447–456. doi: 10.1080/15459624.2020.1805117
Z. Chen, K.X. Zhao, Z.Y. He, et al., Chin. Chem. Lett. 33 (2022) 4053–4056. doi: 10.1016/j.cclet.2022.01.072
S. Liu, X.L. He, T. Zhang, et al., Chin. Chem. Lett. 33 (2021) 1933–1935. doi: 10.3390/w13141933
Y. Xu, T. Wang, Z. Chen, et al., Chin. Chem. Lett. 32 (2021) 3675–3686. doi: 10.1016/j.cclet.2021.06.025
C. Tang, Z. He, H. Liu, et al., J. Nanobiotechnol. 18 (2020) 62. doi: 10.1186/s12951-020-00613-6
H. Yun, J. Yang, J.H. Seo, et al., Indoor Built Environ. 31 (2022) 1234–1241. doi: 10.1177/1420326x20980160
Z. Xiao, H. Chen, H. Chen, et al., J. Biomed. Nanotechnol. 15 (2019) 1113–1134. doi: 10.1166/jbn.2019.2782
X. Mou, Z. Chen, T. Li, et al., J. Biomed. Nanotechnol. 15 (2019) 1832–1838. doi: 10.1166/jbn.2019.2802
H. Chen, Y. Wu, Z. Chen, et al., J. Biomed. Nanotechnol. 13 (2017) 1619–1630. doi: 10.1166/jbn.2017.2478
L. He, H. Yang, P. Xiao, et al., J. Biomed. Nanotechnol. 13 (2017) 1243–1252. doi: 10.1166/jbn.2017.2422
H.W. Yang, M. Liu, H.R. Jiang, et al., J. Biomed. Nanotechnol. 13 (2017) 655–664. doi: 10.1166/jbn.2017.2386
S. Li, H.N. Liu, Y. Deng, et al., J. Biomed. Nanotechnol. 9 (2013) 1254–1260. doi: 10.1166/jbn.2013.1610
I. Torres, E. Albert, D. Navarro, J. Med. Virol. 92 (2020) 2306–2307. doi: 10.1002/jmv.25971
C. Bat-Ochir, Y.S. Kim, H.G. Kim, et al., Sci. Rep. 11 (2021) 20471. doi: 10.1038/s41598-021-00041-y
D.H. Gerco, R.M. Schepp, K. Marjan, et al., J. Infect. Dis. 222 (2020) 1452–1461. doi: 10.1093/infdis/jiaa479
Y. Fang, H. Liu, Y. Wang, et al., J. Biomed. Nanotechnol. 17 (2021) 407–415. doi: 10.1166/jbn.2021.3028
Z. He, Z. Tong, B. Tan, et al., J. Biomed. Nanotechnol. 17 (2021) 1364–1370. doi: 10.1166/jbn.2021.3111
H. Dong, C. Tang, Z. He, et al., Chin. Chem. Lett. 31 (2020) 1812–1816. doi: 10.1016/j.cclet.2020.03.002
H. Zhao, E. Su, L. Huang, et al., Chin. Chem. Lett. 33 (2022) 743–746. doi: 10.3390/ijerph20010743
X. Mou, D. Sheng, Z. Chen, et al., J. Biomed. Nanotechnol. 15 (2019) 2393–2400. doi: 10.1166/jbn.2019.2862
H. Zhao, X. Qiu, E. Su, et al., Anal. Chim. Acta. 1192 (2022) 339379. doi: 10.1016/j.aca.2021.339379
L. Guo, H. Chen, N. He, et al., Chin. Chem. Lett. 29 (2018) 1829–1833. doi: 10.1016/j.cclet.2018.10.038
X. Mou, T. Li, J. Wang, et al., J. Biomed. Nanotechnol. 11 (2015) 2057–2066. doi: 10.1166/jbn.2015.2113
H. Zhu, B. Zhang, N. Zhu, et al., Chin. Chem. Lett. 32 (2021) 1220–1223. doi: 10.1016/j.cclet.2020.09.003
H. Jayakody, D. Rowland, C. Pereira, et al., Sci. Rep. 12 (2022) 5369. doi: 10.1038/s41598-022-09254-1
A. Yj, A. Hw, A. Sh, et al., Clin. Chim. Acta. 511 (2020) 346–351. doi: 10.1016/j.cca.2020.10.032
Y. Sun, Y. Huang, T. Qi, et al., ACS Omega 7 (2022) 1819–1826. doi: 10.1021/acsomega.1c05082
A.P. Tedim, R. Almansa, M. Domínguez- Gil, et al., Eur. J. Clin. Microbiol. Infect. Dis. 51 (2021) e13501.
R.D. Kock, M. Baselmans, V. Scharnhorst, et al., Eur. J. Clin. Microbiol. Infect. Dis. 40 (2020) 807–813.
Y. Liu, Z. Ning, Y. Chen, et al., Nature 582 (2020) 557–560. doi: 10.1038/s41586-020-2271-3
Q. Han, Y. Sun, K. Ding, et al., J. Chromatogr. B 1158 (2020) 122341. doi: 10.1016/j.jchromb.2020.122341
M.S. Ali, M.J. Uttinger, S. Romeis, et al., Colloids Surf. B 214 (2022) 112466. doi: 10.1016/j.colsurfb.2022.112466

Figure 2 The principle of adsorption of viruses by specific magnetic nanoparticles and the sampling and detection process of the whole system.

Figure 3 106, 105 and 104 copies/mL ddPCR and RT-PCR results: (a) Scatter plot of ddPCR, (b) amplification curves and CT values.

 扫一扫看文章

扫一扫关注我们
 DownLoad:

 下载:
下载:
