College of Chemistry and Materials Science, Guangdong Provincial Key Laboratory of Functional Supramolecular Coordination Materials and Applications, Jinan University, Guangzhou 510632, China
Received Date:
14 March 2022 Accepted Date:
18 April 2022 Available Online:
15 January 2023
Abstract:
Due to the abundant sodium reserves and high safety, sodium ion batteries (SIBs) are foreseen a promising future. While, hard carbon materials are very suitable for the anode of SIBs owing to their structure and cost advantages. However, the unsatisfactory initial coulombic efficiency (ICE) is one of the crucial blemishes of hard carbon materials and the slow sodium storage kinetics also hinders their wide application. Herein, with spherical nano SiO2 as pore-forming agent, gelatin and polytetrafluoroethylene as carbon sources, a multi-porous carbon (MPC) material can be easily obtained via a co-pyrolysis method, by which carbonization and template removal can be achieved synchronously without the assistance of strong acids or strong bases. As a result, the MPC anode exhibited remarkable ICE of 83% and a high rate capability (208 mAh/g at 5 A/g) when used in sodium-ion half cells. Additionally, coupling with Na3V2(PO4)3 as the cathode to assemble full cells, the as-fabricated MPC//NVP full cell delivered a good rate capability (146 mAh/g at 5 A/g) as well, implying a good application prospect the MPC anode has
With the continuous advancement of technology, the consumption of energy is increasing rapidly. Undoubtedly, using fossil energy will have a negative impact on the living environment and there has been an urgent demand for the development of clean energy [1, 2]. Many eco-friendly energy sources have been exploited, such as solar, wind, tidal energy. However, their intermittent feature is not convenient for directly using in electronic equipment. Scientists are striving to develop energy storage systems (EES) such as batteries, supercapacitors, so as to provide sustainable energy for various electronic devices [3, 4]. Since commercialization, lithium ion batteries (LIBs) have quickly occupied the electronic market relying on its relatively high energy density and outstanding reversibility of charge and discharge reaction. However, problems like shortage of lithium and poor security still impede their development [[5-8]. Therefore, ever-increasing attention has been paid to sodium ion batteries (SIBs) with richer reserve, lower cost and higher safty. While, the larger radius of Na+ compared to Li+ results in low diffusion rate of Na+ and tremendous volume change of the electrode materials during the repeated charge/discharge process [9]. At present, sodium vanadium phosphate (NVP) is a nice alternative as cathode materials for SIBs [10], and its commercial products are already on sale. For anode, many compounds like alloys [11], oxides [12] and organic materials [13] have been expored. However, due to their high redox potentials, poor long cycle performance, and unsatisfactory electrical conductivity, they still faces daunting challenges to build high-performance SIBs [14]. Therefore, it is exceedingly pivotal to design a more suitable and well-performed anode material for SIBs.
Thanks to its considerable ion storage capacity, great conductivity and distinguished thermal/chemical stability, carbon materials have been studied as anode for many kinds of ion batteries to a great extent [15, 16]. Although graphite exhibits good capacity in LIBs, its not adequate layer spacing and the unstable C/Na compound limite the exploitation of it in SIBs [17]. By contrast, hard carbon behaves stable sodiation/desodiation performance and possesses considerable sodium storage capacity (~300 mAh/g) [18]. Two common explanations for the capacity contribution of hard carbon as the anode of SIBs are as follows: (i) capacitive adsorption, (ii) intercalation [19]. Some studys use atomic doping to provide more defect sites to enhance the contribution of adsorption capacity and expand the interlayer spacing to increase the intercalation capacity [20, 21]. Others create porous structure to promote sodium ion diffusion channel and increase adsorption sites [22, 23]. Some studies that synthesize hard carbon into various nanospheres, nanorods and other special morphologies have also achieved good performance [[24-26]. Generally, it is important to design a porous structure for hard carbon to abtain high capacity in SIBs [27]. Many nano-scale templates have been used to generate pores in materials, such as NaCl [28], MgO [29], SiO2 [30]. Among them, commercially available SiO2 template with uniform morphology and optional size is a more favourable pore-forming agent to create porous with diameters ranging from several to hundreds of nanometers. However, the elimination of SiO2 normally requires strong acids or strong bases, and even the assistance of heating, which are loth choices in manufacturing.
Herein, a multi-porous carbon (MPC) material has been designed and fabricated through an efficient and facile method with gelatin and polytetrafluoroethylene (PTFE) as carbon sources and spherical nano SiO2 as pore-forming agent. The hard template removal using PTFE is very straightforward, and easy to handle [31]. A variety of characterization proved that the MPC had a high specific surface area, big pore volume and enlarged interlayer spacing, which provided it with excellent electrochemical sodium storage capacity and quick shuttle knietics. When employed in sodium-ion half cells, the MPC exhibited a high rate capability (208 mAh/g at 5 A/g) and distinctive fast charge/discharge cycle performance. Even after 5000 cycles at 5 A/g, the charge capacity remained 200 mAh/g. Moreover, the MPC anode was used to construct a full cell for SIBs with the commercialized NVP as cathode, and its outstanding rate capability (146 mAh/g at 5 A/g) significantly indicated the applicability of the MPC.
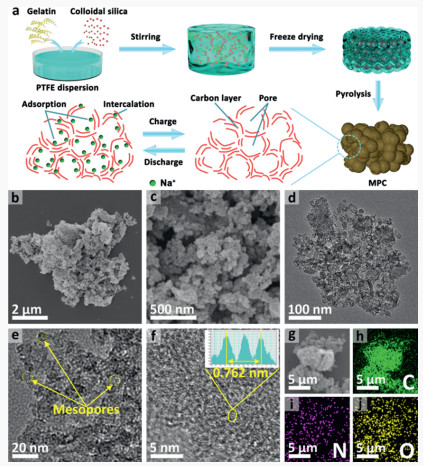
Fig. 1a shows the synthetic route and charge/discharge transition of the MPC anode. Generally, gelatin, colloid silica were added to the PTFE dispersion. After vigorous stirring under heating, a uniformly dispersed mixture was abtained. The gelatin could be well wrapped on the surface of SiO2 particles by freeze drying. Thus, via straightforward high temperature pyrolysis, the gelatin can be converted to a multi-porous carbon containing a large number of mesopores. Meanwhile, the SiO2 template would be removed with the release of SiF4 gas. The etching process is as follows:
(1)
(2)
(3)
Figure 1
Figure 1.
(a) Schematic diagram of the synthetic route and charge/discharge transition process of the MPC anode. (b, c) SEM images of the MPC. (d, e) TEM images of the MPC. (f) HRTEM image of the MPC. (g-j) SEM image and corresponding EDS mappings of the MPC.
When the temperature rises to 450 ℃, PTFE begins to crack to produce small molecular compounds such as C2F4, and it will react with H2O released by organic matter to form HF [32]. C4F8 can react with silica to produce SiF4, CO2 and carbon deposition. It should be mentioned that C4H8 can also be obtained from C2H4 by annulation reaction [33]. The as-prepared MPC can provide enlarged interlayer channels to accommodate sodium ions and supply a large number of pores and surface active sites to adsorb sodium ions, which is beneficial to balance the sodium storage capacity and structural stability of the material as well as the reaction kinetics.
The morphology and microstructure of the MPC were probed by scanning electron microscope (SEM) and transmission electron microscope (TEM). Figs. 1b and c display the SEM images of the MPC. Obviously, the MPC exhibits a grape bunch-like structure. The TEM images of the MPC can more clearly show its mesoporous structure and thin carbon shells (Figs. 1d and e). The tightly connected mesoporous structure provides better conditions for the rapid transfer of electron and sodium ions, and the large specific surface area can provide more sodium ion adsorption sites, both of which thus brings the MPC anode a high capacity and fast dynamic. Additionally, Fig. S1 (Supporting information) displays the SEM and TEM images of the gelatin-derived carbon (GDC). Compared with the MPC, the GDC has a large flaky structure with less pores, and such structural feature is not conducive to rapid diffusion of sodium ions and prone to inferior reaction kinetic and less capacity. Furthermore, the high resolution transmission electron microscope (HRTEM) image of the MPC in Fig. 1f reveals that the carbon layer spacing in the ordered regions of the shells is approximately 0.381 nm. Besides, Figs. 1g-j show the SEM image and corresponding energy dispersive spectroscopy (EDS) mappings of the MPC, displaying the even distribution of the main elements in the material.
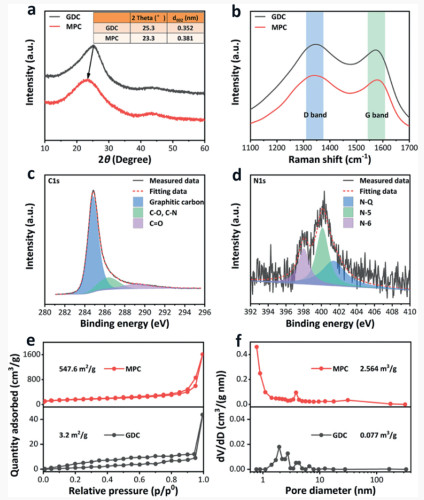
To further analyze the properties of the MPC and GDC, several methods are used in combination. The X-ray diffraction (XRD) patterns of the MPC and GDC are shown in Fig. 2a. Clearly, in the MPC pattern, no characteristic peak belonging to SiO2 is observed and only a broad peak at 24° corresponding to the (002) diffraction of carbon materials stands [30], which means the thorough removal of silica template. Specially, the (002) peak of the MPC has a significant shift to left compared with that of the GDC, which could be explained by the reason that more micropores and defects lower the graphitization degree of the MPC [33]. As the inset sheet in Fig. 2a shown, the value of the (002) peak of the MPC is about 23.3° and the calculated layer spacing is 0.381 nm, consistent with the results of HRTEM. On the other hand, the similar value of the GDC is about 25.5° and the calculated layer spacing is 0.352 nm which smaller than that of the MPC. Fig. 2b displays the Raman spectra of the two carbon materials, and two peaks at about 1350 cm−1 and about 1580 cm−1 were observed, corresponding to the two typical peak bands of carbon materials (D, G bands) [34]. The calculated ID/IG values from the Raman spectra of MPC and GDC are 1.09 and 1.07, respectively. The higher ID/IG value of MPC indicates that the disorder degree of MPC is larger, which may be caused by the porous structure of MPC. Moreover, X-ray photoelectron spectroscopy (XPS) is used to analyze the existing form of the main elements of the MPC. Fig. 2c displays the C 1s spectrum. After peak fitting by Avantage, three peaks are obtained at 284.8, 286.4, and 289.2 eV, corresponding to graphitic carbon, C–C/C–N, and C=O species [22], respectively. Fig. 2d displays the N 1s spectrum, in which three peaks at 398.1, 400.1 and 401.3 eV correspond to N-6, N-5 and N-Q species [35], respectively. Additionally, the nitrogen adsorption/desorption measurements is used to analyze the specific surface area and pore size distribution of the MPC and GDC (Figs. 2e and f). Among them, the isotherms of the MPC shows typical I/IV shape, corresponding to the mesoporous structure [36]. And the Barrett-Joyner-Halenda (BJH) pore size distributions of the MPC shows a peak around 3.8 nm (due to carbon deposition, the pore size is smaller than the template size), impling the existence of a mountain of mesopores after template removal. Specifically, the Brunner Emmet Teller (BET) specific surface areas of the MPC is 547.6 m2/g, pore volume is 2.564 cm3/g. By contrast, not a lot porous structures can be observed in the GDC and its BET specific surface areas and pore volume are much smaller than that of MPC (only 3.2 m2/g and 0.077 cm3/g, respectively).
Figure 2
Figure 2.
(a) XRD patterns and (b) Raman spectra of the MPC and GDC. XPS spectra of (c) C 1s and (d) N 1s of the MPC. (e) Nitrogen adsorption/desorption isotherms and (f) BJH pore size distributions of the MPC and GDC.
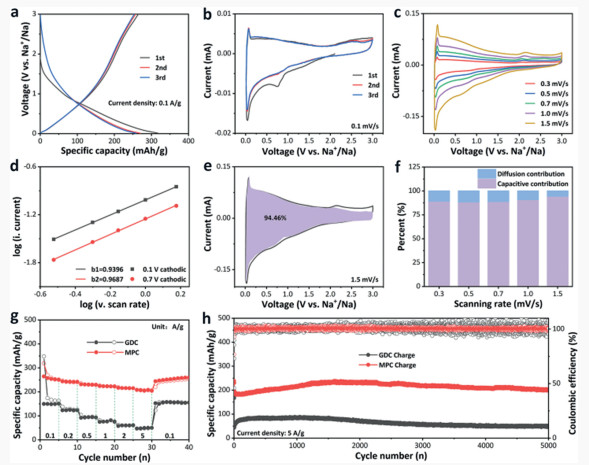
To investigate the electrochemical properties of the MPC, sodium-ion half cells were first assembled. The galvanostatic charge and discharge (GCD) tests was first investigated. Fig. 3a displays the GCD curves of the MPC anode from 1st to 3rd cycles at 0.1 A/g, and the reversible charge specific capacity and initial coulombic efficiency (ICE) are found to be 264 mAh/g and 83% (43% of the GDC anode), respectively. Moreover, the coulombic efficiency of the second and third cycles have reached 95% and 98%, respectively, demonstrating the new sodium storage system has outstanding reversibility. The sodium storage characteristics of the MPC anode were investigated by cyclic voltammetry (CV) measurements. The CV curves of the MPC anode from 1st to 3rd cycles at 0.1 mV/s are shown in Fig. 3b. The irreversible cathodic peak is surveyed around 0.6 V in the 1st cycle, and it is generally explained that the peak is caused by the formation of the solid-electrolyte interphase (SEI) film in initial discharge process [37]. Besides, a spiked cathodic peak around 0.1 V and a wide cathodic peak around 0.7 V show in the 2nd and 3rd cycles, which reflect different reaction mechanisms. The cathodic peak around 0.1 V is interpreted as the intercalation behavior of sodium ions, and the cathodic peak around 0.7 V is described as the pseudocapacitive adsorption behaviour [38]. Apparently, the CV curves of the 2nd cycle and the 3rd cycle matched perfectly, implying the superior reversibility of the system. Furthermore, Fig. 3c displays the CV curves of the MPC anode at different scan rates. Based on these test data, the following formula can be used to analyze the electrochemical kinetics of the MPC anode [39]:
(4)
Figure 3
Figure 3.
(a) GCD curves of the MPC anode. (b, c) CV curves of the MPC anode. (d) b values of the MPC anode. (e, f) Capacitive contribution of the MPC anode. (g, h) Rate and cyclic performance of the MPC and GDC anodes.
The b values could be calculated from the drawing of ln(v) and ln(i) plot. Fig. 3d shows the b values of the MPC anode. Specifically, the b value for the cathodic peak at 0.1 V is 0.9396 (b1), and another one for the cathodic peak at 0.7 V is 0.9687 (b2). Due to the large specific surface and the abundant pores in the material, the values are all close to 1, suggesting that the sodium storage process is dominated by capacitive behavior [40], which is more conducive to the achievement of a good rate performance. However, for the GDC anode, the b values are calculated to be 0.8120 and 0.7275 at 0.1 and 0.7 V, respectively, suggesting that the capacitive behavior contributes ordinary sodium storage capacity (Fig. S5c in Supporting information) [38]. Moreover, the ratio of capacitive contribution could be calculated using the formula [41]:
(5)
where v is the scan rate of the CV tests, i(V) is the current intensity at diffirent voltage in a certain scan rate. The k1v stands for the contribution of the capacitive behavior, and the k2v1/2 represents the contribution of diffusion behavior. For the MPC anode (the relationship between i/v1/2 and v1/2 are shown in Fig. S12 in Supporting information), the surface-induced capacitive contribution is about 94.46% at 1.5 mV/s (Fig. 3e), while at other scan rate (0.3, 0.5, 0.7, 1.0 mV/s) they are 89.20%, 88.45%, 88.93%, 90.90%, respectively (Fig. 3f). On the contrary, the lesser capacitive contributions (40.41%, 43.83%, 47.70%, 52.87%, 59.54% at 0.1-1.5 mV/s, respectively) of the GDC anode are shown in Fig. S5i (Supporting information). The above data pithily illustrate that the sodium storage strategy of the MPC anode is mainly about quick capacitive behavior.
Fig. 3g displays the rate performance of the MPC and GDC anodes. Remarkably, the MPC anode delivers excellent capacities of 264, 244, 232, 224, 217 and 208 mAh/g at current densities of 0.1, 0.2, 0.5, 1, 2 and 5 A/g, respectively. The capacity retention reach up to 78.8% (compared with the data at 5 and 0.1 A/g). On the contrary, the GDC anode delivers ordinary capacities of 150, 123, 92, 75, 58 and 47 mAh/g at current densities of 0.1, 0.2, 0.5, 1, 2 and 5 A/g, respectively. Its capacity retention is only 31.1%. Furthermore, when the test condition return to 0.1 A/g after cycling at 5 A/g, the charge capacity of the MPC anode restored to 244 mAh/g and maintain a certain upward trend in the following cycles. Fig. 3h displays the cyclic performance of the MPC and GDC anodes. To the cells were cycled 3 times at 0.1 A/g first, and then continued to cycle at target current. The MPC anode shows high capacity and good retention rate at 5 A/g (200 mAh/g after 5000 cycles), and the cell still runs stably to more than 10000 cycles (Fig. S6 in Supporting information). While the GDC anode shows poor capacity (~50 mAh/g) during cyclic test. It is worth noting that in the early stages, there is a gradual increase in capacity, which also appears in some reports [17, 42, 43]. Due to the inferior wettability of the electrolyte sometimes, the reaction degree of the porous material in the first cycle is not sufficient. As the cycle number increases, the electrolyte gradually penetrates into the tiny pores or defects inside the material, so that the capacity gradually increases [44]. Testing at higher current densities exacerbates this under-reaction phenomenon and therefore prolongs the activation period. As for GDC, due to its lack of pores, the activation process is completed in just a few cycles.
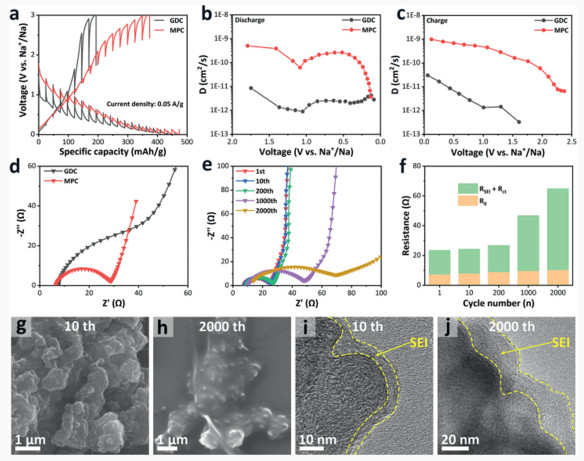
To further investigate the Na+ diffusion coefficient of the MPC and GDC electrodes, the galvanostatic intermittent titration technique (GITT) was used, during which the pulse current was set to 0.05 A/g, and the durations of the constant current and relaxation process were set to 30 min and 2 h, respectively (Fig. 4a). In order to explain the selection of various parameters more conveniently, a schematic diagram is made (Fig. S13 in Supporting information). The diffusion coefficient could be calculated by the following formula [45]:
(6)
Figure 4
Figure 4.
(a) GITT curves of the MPC and GDC electrodes. (b, c) Na+ diffusion coefficient of the MPC and GDC electrodes. (d) EIS of the fresh MPC and GDC half cells. (e) EIS of the MPC electrode after different cycles and corresponding fitted impedance distribution (f). (g-j) SEM and TEM of the MPC anode after different cycles.
where τ(s), mB(g), S (m2/g), ΔEτ and ΔES stand for the duration of the constant current process, the loading mass of active materials on the electrode, the geometric area of the electrode, the transient voltage change during each step of the constant current pulse process, and the voltage change between the two relaxation end points before and after the corresponding constant current process, respectively. Additionally, VM (cm3/mol) and MB (g/mol) are the molar volume and molecular weight. The value of MB/VM can be obtained by calculating the density with the formula:
(7)
where ρ (g/cm3) refers to the density of the prepared carbon material, Vtotal (cm3/g) is the total pore volume (since the micropore volume is relatively small, here we use the pore volume in the BJH analysis to calculate), and ρcarbon is the true density of carbon [46]. As shown in Figs. 4b and c, obviously, there is an order of magnitude difference in the ion diffusion coefficient of the two electrodes. The MPC electrode shows superior ion diffusion performance, while the GDC electrode is more inferior. Besides, the charge transfer resistance of the MPC and GDC electrodes were investigated by electrochemical impedance spectroscopy (EIS). The Nyquist plots (Fig. 4d) are consists of two parts: A semi-circular arc that appears in the mid-to-high frequency range corresponds to the SEI film resistance (RSEI) and charge transfer resistance (Rct), and a oblique line that appears in the low frequency range accounts for the Warburg diffusion (Zw) [40]. Clearly, the curve of the MPC electrode has the smaller semicircle benefiting from multi-porous structure compared with the GDC electrode, implying a fast charge transfer process in the MPC electrode. To further probe the changes of impedance for the MPC electrode after repeated charge and discharge, the EIS data (Fig. 4e) were collected after 1, 10, 200, 1000, 2000 cycles (current density was set to 2 A/g). Additionally, resistance distribution of different cycles for the MPC electrode are shown in Fig. 4f. Fig. S8 (Supporting information) shows the corresponding equivalent circuits model, where R0 represents for the internal resistance of a cell. The rise in RSEI + Rct can be interpreted by the evolution of SEI film [47], which should be associated with the capacity decay after 1000 cycles (Fig. S7 in Supporting information). Figs. 4g-j display the SEM and TEM images of the MPC anode after 10 cycles and 2000 cycles. Compared with 10 cycles, a thicker SEI film with sticky surface was observed in the 2000 cycles sample, which is consistent with the EIS tests. Some researches revealed that combining ester-based and ether-based electrolyte was conducive to the construction of more stable SEI, so as to increase the capacity retention [47, 48].
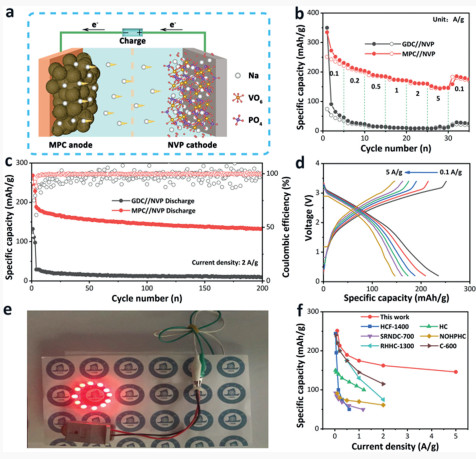
To further evaluate the practical application potential of the MPC anode in SIBs, full cells were fabricated using commercialized NVP as cathode (Fig. 5a) [49]. The CV curve (Fig. S10 in Supporting information) of the full cell shows a anodic peak around 2.8 V, and this value exactly matches the difference between the anodic peak at ~3.5 V of the NVP cathode and cathodic peak at ~0.7 V of the MPC anode in their respective half cells (Fig. S9b in Supporting information and Fig. 3c). Furthermore, the charge/discharge curves of the MPC//NVP full cell at current densities from 0.1 A/g to 5 A/g are shown in Fig. 5d, and the platform around 2.8 V during the charge process corresponds to the anodic peak in the CV curve. Fig. 5b displays the rate performance of the MPC//NVP and GDC//NVP full cells. Remarkably, the MPC//NVP full cell delivers excellent capacities of 251, 213, 190, 175, 162 and 146 mAh/g at various current densities of 0.1, 0.2, 0.5, 1, 2, and 5 A/g, respectively, proving that the excellent rate performance of the MPC anode can be well retained in the full cells. In contrast, the GDC//NVP full cell exhibits poor capacity (44, 26, 15, 11, 9 and 8 mAh/g at current densities of 0.1, 0.2, 0.5, 1, 2 and 5 A/g, respectively). Affected by the matching degree of positive and negative electrode materials and other factors, the performance of electrode in the full cell test is often worse than that in the half cell test. Furthermore, the cyclic performance of the MPC//NVP and GDC//NVP full cells are shown in Fig. 5c. The test condition is set to first cycle 3 times at 0.1 A/g, and then continued to cycle at target current. The MPC//NVP full cell shows high capacity retention (134 mAh/g after 200 cycles at 2 A/g), and the coulombic efficiency is stable around 100%. Besides, the reversible capacity of the MPC//NVP full cell was 100 mAh/g at 5 A/g after 2000 cycles (Fig. S11 in Supporting information). The aforementioned data demonstrate that the MPC anode materials is reliable for full cells of SIBs and can be used in practical applications. Intriguingly, a circle composed of 12 light-emitting diode (LED) bulbs can be lit by only one cell (Fig 5e). Comparing with other full cells whose works focus on the hard carbon materials as SIBs anode (NVP as the cathode), the rate capabilities of the MPC//NVP full cell was obviously in an advantageous position (Fig. 5f) [[50-55].
Figure 5
Figure 5.
(a) Schematic diagram of the MPC//NVP full cell. (b, c) Rate and cyclic performance of the MPC//NVP and GDC//NVP full cells. (d) GCD curves of the MPC//NVP full cell. (e) The photo of practical application of the MPC//NVP full cell. (f) Comparison chart of different full cells.
In summary, a multi-porous hard carbon material has been synthesized safely and efficiently via co-pyrolysis, achieving carbonization and template removal in one step. Benefiting from its multi-porous structure, thin carbon shells and enlarged interlayer spacing, the MPC anode displayed a quick sodium adsorption/desorption mechanism. When used in half cells, the MPC anode exhibited a extraordinary high ICE of 83% at 0.1 A/g and an excellent rate capability (208 mAh/g at 5 A/g) as well as a good cycling stability (200 mAh/g at 5 A/g after 5000 cycles). Moreover, when used in full cells, the constructed MPC//NVP full cell delivered a outstanding rate capability (146 mAh/g at 5 A/g) as well. This work is anticipated to provide a new idea to synthesize hard carbon materials as high-performance anode for commercial sodium ion batteries.
Declaration of competing interest interest
The authors declare that they have no known competing financial interests or personal relationships that could have appeared to influence the work reported in this paper.
Acknowledgments
This work was financially supported by the Start-up Funding of Jinan University (No. 88016105), the Discipline Construction Outstanding Young Backbone Project (No. 12819023), and the Fundamental Research Funds for the Central Universities (No. 21620317), and the Guangdong Basic and Applied Basic Research Foundation (Nos. 2020A1515110611 and 2021A1515010362), and the Guangzhou Basic and Applied Basic Research Foundation (No. 202102020995) and also supported by the Open Fund of Guangdong Provincial Key Laboratory of Functional Supramolecular Coordination Materials and Applications (No. 2020B121201005).
Supplementary materials
Supplementary material associated with this article can be found, in the online version, at doi: 10.1016/j.cclet.2022.04.041.
N. Wang, Y. Wang, X. Xu, et al., ACS Appl. Mater. Interfaces 10 (2018) 9353-9361 doi: 10.1021/acsami.7b17893
Figure 1
(a) Schematic diagram of the synthetic route and charge/discharge transition process of the MPC anode. (b, c) SEM images of the MPC. (d, e) TEM images of the MPC. (f) HRTEM image of the MPC. (g-j) SEM image and corresponding EDS mappings of the MPC.
Figure 2
(a) XRD patterns and (b) Raman spectra of the MPC and GDC. XPS spectra of (c) C 1s and (d) N 1s of the MPC. (e) Nitrogen adsorption/desorption isotherms and (f) BJH pore size distributions of the MPC and GDC.
Figure 3
(a) GCD curves of the MPC anode. (b, c) CV curves of the MPC anode. (d) b values of the MPC anode. (e, f) Capacitive contribution of the MPC anode. (g, h) Rate and cyclic performance of the MPC and GDC anodes.
Figure 4
(a) GITT curves of the MPC and GDC electrodes. (b, c) Na+ diffusion coefficient of the MPC and GDC electrodes. (d) EIS of the fresh MPC and GDC half cells. (e) EIS of the MPC electrode after different cycles and corresponding fitted impedance distribution (f). (g-j) SEM and TEM of the MPC anode after different cycles.
Figure 5
(a) Schematic diagram of the MPC//NVP full cell. (b, c) Rate and cyclic performance of the MPC//NVP and GDC//NVP full cells. (d) GCD curves of the MPC//NVP full cell. (e) The photo of practical application of the MPC//NVP full cell. (f) Comparison chart of different full cells.

 DownLoad:

 下载:
下载:


