State Key Laboratory for Organic Electronics and Information Displays & Institute of Advanced Materials IAM, Nanjing University of Posts & Telecommunications, Nanjing 210023, China
b.
State Key Laboratory of Analytical Chemistry for Life Science, School of Chemistry and Chemical Engineering, Nanjing University, Nanjing 210023, China
c.
School of Mechanical and Materials Engineering, Washington State University, Pullman, WA 99164, United States
Received Date:
08 July 2022 Accepted Date:
05 October 2022 Revised Date:
03 October 2022 Available Online:
15 June 2023
Abstract:
Nitrogen electro-reduction reaction (NERR) is a promising alternative method for ammonia production to the Haber–Bosch approach due to mild reaction conditions and free harmful by-product emission. A formidable challenge in bringing NERR closer to the practical application is developing an electro-catalyst which can simultaneously improve the Faraday efficiency and reduce the reaction over-potential. Herein, we fabricated a catalyst of nitrogen-doped carbon dots modified copper-phosphate nanoflower petals (CuPo-NCDs NF) via a self-assembly method. The flower structure endowed the CuPo-NCDs NF with large specific surface area, and thus enabled more active sites to be exposed. In particular, we demonstrated that the NCDs modified CuPo petals with flower-like structure can accelerate the interfacial proton-electron transfer, suppressing the competing hydrogen evolution reaction and promoting the desired NERR process. Ultimately, for the CuPo-NCDs NF catalyzed NERR, the FENH3 and the reaction potential both were boosted, the resultant energy efficiency of NERR reached a record-breaking value of 56.5%, and the NH3 yield rate increased by 7 times compared to NCDs. This study provides a novel catalyst with a new pathway to boost the NERR.
It has been proven that ammonia is a promising energy carrier and is indispensable in chemical fertilizer production. However, the production of ammonia still chiefly relies on the Haber–Bosch (H-B) approach which necessitates harsh reaction conditions of high temperature and pressures, resulting in extremely high energy consumption and massive greenhouse gas emissions [1,2]. Electrochemical catalytic systems can catalyze the N2 to ammonia via electro-reduction reaction under ambient temperature and pressure, such reaction has the benefit of low environmental impact and low cost [3,4]. Therefore, the Nitrogen electro-reduction reaction (NERR) has been considered as a promising alternative to the typical H-B approach, which is infamous for its high-energy consumption and pollution discharge [5-7]. Nevertheless, since the potential of NERR is very close to that of hydrogen evolution reaction (HER) and the initial partial pressure of H2 is low, the competing HER is very serious during NERR process [1,8]. Therefore, the Faraday efficiency of NERR (FENH3) is far from the practical applications. In this context, the strong alkaline electrolyte with low proton concentration and good proton filtration functions have been reported to suppress the competing HER [8-11]. However, when considering the environmental and economic benefits of NERR, the energy efficiency (EENH3), the ratio of the energy input to produce NH3 to the energy the generated NH3 can offer, is one of the most crucial and yet overlooked factors for the practical application of NERR [2-4].
The theoretical EENH3 can be calculated by the following equation (Eq. 1):
(1)
in which the η represents the reaction potential of NERR, and the F respresents the Faraday constant [4]. The requisite for improving EENH3 is to improve the reaction potential and the FENH3 synchronously. However, the reported strategies are not yet able to simultaneously achieve these two goals well. The critical factor is that the NERR is a typical proton-coupled electron transfer (PCET) reaction [1,12]. The reported approaches to improve the FENH3 mainly rely on filtering and limiting protons and this will inevitably retard the proton transfer, resulting in a high reaction over-potential. As a result, although the FENH3 is enhanced, the EENH3 for the reported catalysts or catalytic strategies is still below 40%.
It is worth noting that biological enzymes are very energy efficient in catalyzing chemical reactions. One of the key factors is that the biological enzymes possess successive intramolecular proton-electron transfer paths [13-16]. Inspired by this, it is likely that a key point in improving the FENH3 and reaction potential of NERR lie in developing novel catalysts with enhanced interfacial proton-electron transfer.
In this work, we fabricated an electro-catalyst of nitrogen-doped carbon dots modified copper-phosphate nanoflower (CuPo-NCDs NF) with novel catalytic pathway via an in situ self-assembly method. The NCDs induced the Cu2+ to form flower-like amorphous CuPo, which in turn served as a three-dimensional scaffold for NCDs, simultaneously preventing the NCDs from falling from the electrode during the NERR process and enabling more NERR active sites to be exposed. Systematic experiments confirmed that the CuPo-NCDs NF could accelerate the electron transfer between the absorbed N2 and the electrode, and avoid the direct interaction between the protons and the NERR active sites. Thus, the competing HER was significantly suppressed. From this, the CuPo-NCDs NF achieved high FENH3 of 59.4%. It was particularly worth noting that NERR potential at the peak FENH3 positively shifted to 0.0 V vs. RHE. Therefore, the EENH3 for CuPo-NCDs NF reached a record-breaking value of 56.5%, 5.4 times the EENH3 of NCDs. In addition, the NH3 yield rate for CuPo-NCDs NF (87.04 μg−1 mgcatalyst-1 h−1) achieved a 7-times increase compared to that of NCDs (10.69 μg−1 mgcatalyst−1 h−1). Also of note, the EENH3 for the CuPo@NCDs, which was fabricated via reacting NCDs with the prefabricated CuPo, was also only 28.7%. This strongly validated that the the CuPo-NCDs NF fabricated in situ showed superior enhancing effect on the NERR.
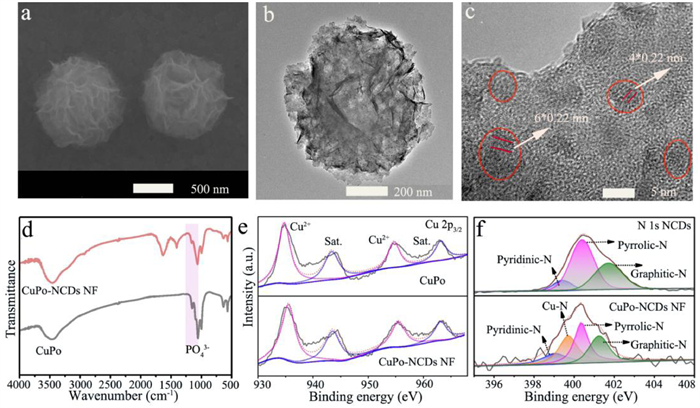
The scanning electron microscope (SEM) analysis revealed that the nanoparticles with flower-like structure generated were by simply mixing the NCDs with Cu2+ in a phosphate buffer saline and kept at room temperature for 24 h (Figs. 1a and b). To further investigate the elemental composition of the nanoparticles, the elemental mapping and the X-ray photoelectron spectroscopy (XPS) tests were conducted. Results revealed that the atoms of C, N, O, Cu and P distributed in the nanoparticles (Figs. S1 and S2 in Supporting information). What is more, all of the Cu atoms in the final product were in divalent state, as evidenced by spectrums of the Cu 2p3/2 and the auger electron spectra of Cu (Fig. 1e and Fig. S3 in Supporting information) [17,18]. The P 2p spectrum exhibited a peak at 133. 2 eV attributed to the Cu—P—O species (Fig. S4 in Supporting information) [19,20]. In addition, the characteristic peaks of PO43− (1190~950 cm−1) were observed from the Fourier-transform infrared spectroscopy (FT-IR) of CuPo and CuPo-NCDs NF (Fig. 1d) [21]. Above results strongly suggested the formation of CuPo in the final product. To further analyze the detailed structure of CuPo-NCDs NF, the transmission electron microscopy (TEM) and high-resolution (HRTEM) tests were conducted. The pristine NCDs had uniform particle size of ~5 nm and characteristic lattice fringe of 0.22 nm attributing to (100) plane of carbon plane (JCPDS No. 26-1080) (Fig. S5 in Supporting information) [22-24]. After reacting with Cu2+, the NCDs (black dots in red circle) were uniformly anchored onto the flaky amorphous CuPo (Figs. 1b and c, Fig. S6 in Supporting information). With regard to the N 1s XPS spectrum, the NCDs showed three characteristic peaks assignable to the pyridinic-N (398.8 eV), pyrrolic-N (400.3 eV), and graphitic-N (401.2 eV). Noticeably, besides these three characteristic peaks, the CuPo-NCDs NF showed new fitting peak attributed to Cu-N bond (Fig. 1f) [17,18]. In sum, one can conclude that the NCDs induced the growth of amorphous CuPo in situ, which in turn served as a scaffold for NCDs, and ultimately forming the CuPo-NCDs NF. Notably, researches have revealed both pyrrolic and pyridinic N worked as the active sites for NERR [22,25,26]. In particular, the specific surface area of the CuPo-NCDs NF was as high as 410.95 m2/g, which can provide a large number of active sites to enhance their catalysis toward NERR (Fig. S7 in Supporting information). Furthermore, the PO43− can participate in as well as boost the PCET reactions [27,28], thus the CuPo-NCDs NF was expected to effectively suppress competing HER and promote the desired NERR.
Figure 1
Figure 1.
(a) The SEM, (b) TEM and (c) HRTEM images of the obtained CuPo-NCDs NF. (d) The Fourier-transform infrared spectroscopy of CuPo and CuPo-NCDs NF. (e) The high-resolution Cu 2p3/2 XPS spectra of CuPo and CuPo-NCDs NF. (f) The high-resolution N 1s XPS spectra of NCDs and CuPo-NCDs NF.
To provide further evidence on the growth mechanism of CuPo-NCDs NF, a systematic approach was carried out carefully. As the HRTEM and the elemental mapping results indicated, the amorphous CuPo grown along the NCDs (black dots) (Figs. 2a and b) in the first 10 min. Considering the NCDs had abundant –NH2 groups which could efficiently chelate Cu2+ (Fig. S8 in Supporting information) [23], together with the evidence of Cu—N proved by the XPS in Fig. 1f, one could conclude that the NCDs chelated Cu2+ to form the crystal nucleus. The amorphous nucleus provided abundant footholds for CuPo and NCDs, ultimately leading to the formation of CuPo-anchored NCDs petals (Fig. 2c and Fig. S9 in Supporting information). Eventually, the staggered growth of petals resulted in the formation of CuPo-NCDs NF (Fig. 2d). In sharp contrast, the flaky and crystal CuPo with obvious characteristic X-ray diffraction peaks were obtained in absence of NCDs (Fig. 2e and Fig. S10 in Supporting information).
Figure 2
Figure 2.
(a) The TEM, HRTEM (inset) and (b) the corresponding element mapping images of the product after reacting NCDs with Cu2+ for 10 min. The SEM images at 6 h (c) and 20 h (d). (e) The TEM and HRTEM (inset) image of the CuPo fabricated in absence of NCDs. (f) The TEM and (g) HRTEM images of the CuPo@NCDs. The black dots in orange circle represent the NCDs. (h) The XRD patterns of the CuPo, NCDs, CuPO@NCDs, and CuPo-NCDs NF. (i) Scheme of the growth mechanism of the CuPo-NCDs NF.
The flower-like particles were also generated when the prefabricated CuPo were reacted with NCDs (denoted as CuPo@NCDs) (Figs. S11 and S12 in Supporting information). However, as revealed by the TEM and HRTEM results, the NCDs loading in CuPo@NCDs was obviously lower than that in CuPo-NCDs NF (Fig. 1b and Fig. S12). Apart from this, the CuPo well preserved its fine crystal structure, and the NCDs in CuPo@NCDs are only distributed on the edge of the flaky CuPo (Figs. 2f-h). This is because in the case of flaky CuPo with perfect crystal lattices, only the uncoordinated Cu hanging on the edge can serve as the foothold for NCDs.
Taken together, one can conclude that the NCDs could induce the in situ growth of amorphous CuPo, which in turn provided abundant footholds for CuPo and NCDs. These factors ultimately lead to the formation of CuPo-NCDs NF and let more uncoordinated phosphate groups be exposed (Fig. 2i). Since the phosphate groups have been confirmed to participate in as well as boost the PCET reactions [20,28,29], so the obtained CuPo-NCDs NF is expected to create more opportunities for promoting the PCET-type NERR.
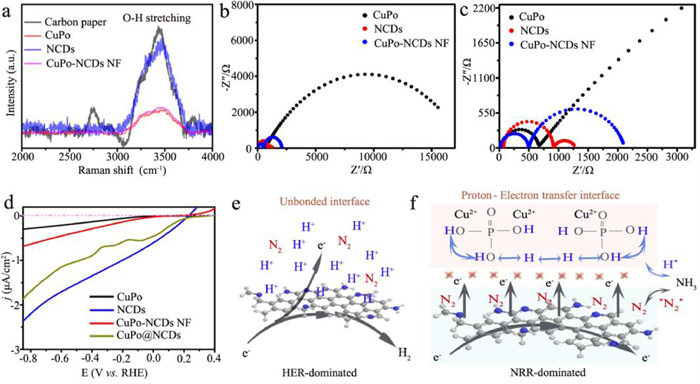
One of the aforementioned theories was that the CuPo-NCDs NF could accelerate the electron transfer as well as avoid the direct contact between the NERR active sites. To confirm this, we firstly recorded the Raman spectrum of different electrodes in the electrolyte at room temperature to investigate the interaction between the catalysts and H-bond (Fig. 3a). On the naked carbon paper electrode, the characteristic band at 3200–3800 cm−1 assigned to the O–H stretching vibration of water was strong [30]. The decline in band intensity was slight after modifying the electrode with NCDs, demonstrating the interaction between the NCDs and the proton carrier of H2O was weak. In contrast, on the CuPo electrode and the CuPo-NCDs NF electrode, the intensity of the O–H band markedly decreased. Such substantial decrease in O—H intensity suggested that the CuPo could strongly interact with water and significantly weaken the O-H bond. Thus further increase the mobility of proton on the NCDs modified CuPo petal surface.
Figure 3
Figure 3.
(a) The Raman spectra of different electrodes in electrolyte. (b) The Nyquist plots of different electrodes in deionized water. (c) The enlarged view of the Nyquist plots. (d) The HER suppress performance of CuPo, NCDs, CuPo@NCDs and CuPo-NCDs NF. Schematic representations of the electron and proton transfer pathways in the NCDs (e) and the CuPo-NCDs NF (f).
For the in-depth study of the proton-electron transfer on CuPo-NCDs NF electrodes, we performed the electrochemical impedance spectroscopy (EIS) tests. To verify that the H+ was the only mobile ion in the test system and the electron transfer did not interface with the investigation of proton transfer, the EIS tests were conducted in the deionized water [31,32]. As shown in Figs. 3b and c, the Nyquist plots of NCDs, CuPo, and CuPo-NCDs NF all displayed two semicircles in the high frequency and low frequency regions. The first semicircle in high frequency regions reflects the H+ transfer resistance (Rct) in the catalysts and the second semicircle in low frequency reflects the electron acceptance of the H+ at the electron-conductive junctions. The Rct values of the first semicircle for CuPo and CuPo-NCDs NF decreased to as low as ~650 Ω and ~500 Ω, respectively, whereas that for the NCDs was as high as ~950 Ω. This signified a higher H+ transfer rate in CuPo and CuPo-NCDs NF. However, the Rct value of the second semicircle for CuPo (~20,000 Ω) was about 100 times higher than that for NCDs (~200 Ω), clearly indicating the poor electron conductivity of CuPo. The Rct value for the CuPo-NCDs NF sharply decreased to ~2100 Ω due to the higher electron conductivity of NCDs, demonstrating the interfacial electron transfer was also boosted on CuPo-NCDs NF. Taken together, we can reasonably conclude that the dominated reaction on NCDs would be HER due to the high H+ accessibility and high electron accessibility on its surface (Fig. 3e). In sharp contrast, for the CuPo-NCDs NF, the CuPo worked as the first H+ acceptor, and hindered the H+ from accepting electrons at the electron-conductive junctions [20,30]. Thereby, the CuPo-NCDs NF was expected to effectively suppress the competing HER. As confirmed by Fig. 3d, in Ar saturated electrolyte, the HER onset potential on the NCDs electrode was as high as 0.2 V (vs. RHE), while that for the CuPo-NCDs NF and CuPo@NCDs negatively shifted to −0.1 V. Beyond that the HER current density at the same potential for CuPo-NCDs NF exhibited a dramatic decrease compared to NCDs and CuPo@NCDs. This clearly confirmed the CuPo-NCDs NF could effectively suppress the competing HER.
Through a comprehensive analysis of the Raman, EIS, and LSV results, one can find that the strong interaction between H+ and the PO43− not only enabled the CuPo phase in CuPo-NCDs NF to work as the first H+ acceptor, but also formed a weakened O—H bond to increase the mobility of H+, avoiding the direct contact between the proton and the NERR active NCDs. What is more, the poor electron conductivity of CuPo significantly reduced the electron acceptance of protons at the conductive junction. As a result, the proton–electron transfer on the petal surface was enhanced (Fig. 3f). Theoretically, this enhanced interfacial proton–electron transfer is helpful in achieving the goal of simultaneously improving the FENH3 and reducing the reaction over-potential of NERR to boost the EENH3. Apart from that, the flower-like structure of CuPo-NCDs NF could shorten the N2 transfer distance and boost the collision probability between the reactant and the activation sites [33,34]. Taken together, the CuPo-NCDs NF held great potential in boosting the EENH3 of NERR.
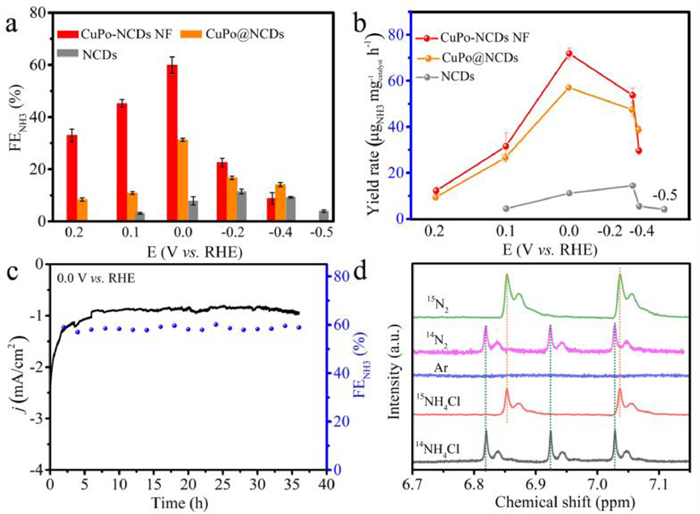
The NERR performances of NCDs, CuPo, CuPo@NCDs, and CuPo-NCDs NF were further comparatively examined via rigorous experiments. The concentration of ammonia after 2-h electrolysis under N2 atmosphere was first determined by the indophenol blue method (Figs. S13-S19 in Supporting information) [35-38]. As expected, the CuPo-NCDs NF achieved a high FENH3 of 56.5%, which was about 4 times higher than that of NCDs (12.8%), and far surpassed that of most of the carbon-based catalysts reported so far (Fig. 4a and Table S1 in Supporting information). And the NH3 yield rate for CuPo-NCDs NF reached 87.04 μg−1 mgcatalyst-1 h−1, which was about 7 times higher than NCDs (10.69 μg−1 mgcatalyst-1 h−1). A worthier finding was that the potential needed for the CuPo-NCDs NF to achieve the peak FENH3 was lowered to 0.0 V (Fig. 4b, Figs. S14-S17 in Supporting information). Of particular note is that the FENH3 for CuPo@NCDs increased significantly (28.7%) compared to NCDs, yet it was still lower than that of CuPo-NCDs NF (Fig. S18 in Supporting information). Furthermore, we could not observe NH3 after electrolyzing CuPo for 2 h at a given potential (Fig. S19 in Supporting information), suggesting that the contribution from CuPo in the CuPo@NCDs and CuPo-NCDs NF electrodes was very limited. And this also demonstrated that the N2 was mainly absorbed on the NCDs, which possessed the NERR active sites (Fig. 3e). The above results strongly confirmed that modifying NCDs with CuPo could achieve an enhanced NERR performance. However, the CuPo-NCDs NF formed in situ exhibited distinct superiority in FENH3 compared to CuPo@NCDs. This was because the amorphous CuPo possessed more uncoordinated phosphate groups to accept and transfer proton and the NCDs loading was higher. As a result, the CuPo-NCDs NF could simultaneously avoid the direct interaction between proton and NCDs and provide more active sites to activate N2.
Figure 4
Figure 4.
(a) The FENH3 and (b) the ammonia yield rate for the CuPo-NCDs NF, CuPo@NCDs and NCDs. (c) The stability of CuPo-NCDs NF in catalyzing NERR at 0.0 V vs. RHE. (d) 1H NMR spectra of the NERR products using 14N2 and 15N2 as feed gases.
Also of note, the catalytic current and FENH3 showed negligible decline during a 36-h NERR test (Fig. 4c), and the physical morphology and element composition of the CuPo-NCDs NF underwent no detectable changes (Figs. S20 and S21 in Supporting information), strongly confirming the highly stable NERR activity of CuPo-NCDs NF. To eliminate the interference of polluted ammonia sources on the experimental results, several control experiments and isotopic labeling experiments were conducted. Results revealed that no detectable NH4+ was observed after electrolyzing the CuPo-NCDs NF at 0.0 V for 2 h in Ar-saturated PBS (Fig. S22 in Supporting information). This eliminates the possibility of partial NH3 generated from the self-electrolysis of catalyst and the electrolyte contamination. Furthermore, as the 1H NMR results revealed, no triplet signal representing 14NH4+ could be observed in the NMR spectra after electrolyzing under Ar gas. In contrast, an obvious characteristic triplet signal appeared after feeding the same electrochemical system with 14N2 gas [8]. Most notably, the 1H NMR spectra only showed a distinguishable doublet signal assigned to 15NH4+ when using 15N as a gas source (Fig. 4d). Given the above, the reliability of the experimental results was strongly confirmed.
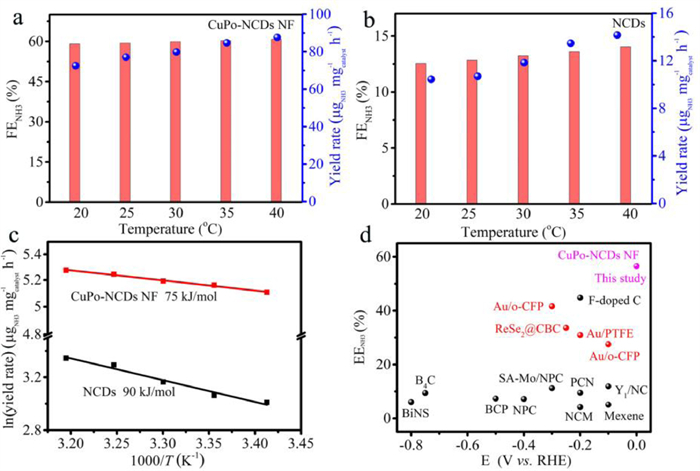
Next, we investigated the FENH3 and NH3 yield rate at different temperatures to estimate the apparent activation energy (Ea) for NERR, according to the Arrhenius equation of Ln(K) = Ln(A) - Ea/RT [39]. The K and T represent NH3 yield rate and reaction temperature, respectively. Clearly, the FENH3 and NH3 yield rate for NCDs and CuPo-NCDs NF both increased as the temperature increase (Figs. 5a and b). However, the Ea for the NERR catalyzed by NCDs and CuPo-NCDs NF were 90 kJ/mol and 75 kJ/mol, respectively (Fig. 5c). That is, the CuPo-NCDs NF could significantly reduce the Ea for NERR by 50%.
Figure 5
Figure 5.
The FENH3 and ammonia yield rate for (a) CuPo-NCDs NF and (b) NCDs at different temperatures, and (c) the corresponding fitting curves for the estimation of the Ea for NERR. (d) Comparison of the peak EENH3 and the corresponding reaction potential of NERR over CuPo-NCDs NF with other catalysts and other strategies based on filtering proton.
As we mentioned above, when considering the environment and economic benefits of the NERR, the EENH3 is one of the most crucial factors. So, we normalized the EENH3 according to Eq. 1. Due to the high FENH3 together with low over-potential of NERR catalyzed by CuPo-NCDs NF, the maximum EENH3 reached 56.5%. The resulted value far exceeded that of the currently reported carbon-based catalysts (Fig. 5d) [11,22,25,26,36,37,40-43]. Researches demonstrated that coating a hydrophobic layer on the catalyst surface to filter proton was an effective way to improve the FENH3. However, the insufficient proton supply is not conducive to the NERR which is a typical PCET reaction, thus leading to a high over-potential. Therefore, even compared with proton filtration approaches, the CuPo-NCDs NF also exhibited an overwhelming superiority in EENH3 (Fig. 5d) [1,8,9,35,44].
In summary, we have fabricated a novel NERR catalyst of CuPo-NCDs NF which exhibited superior catalytic efficiency. The obtained CuPo-NCDs NF has been proven to be able to simultaneously improving the selectivity and reaction potential of the NERR, due to the enhanced interfacial proton–electron transfer on the petal surface. For the NERR catalyzed by CuPo-NCDs NF, the FENH3 significantly increased to 59.4%, meanwhile, the NERR potential required to achieve the peak FENH3 was reduced to 0.0 V. This corroborated that the CuPo-NCDs NF with enhanced interfacial proton–electron transfer could synchronously suppress the competing HER reaction and promoted the protonation of intermediates during the NERR process. The simultaneous increase in FENH3 and reduction in over-potential endowed CuPo-NCDs NF with a record-breaking EENH3 of 56.5%. Also of note, the flower-like structure of CuPo-NCDs NF could boost the collision probability between the reactant and the activation sites. Therefore, the CuPo-NCDs NF exhibited an NH3 yield rate that was 7 times higher than that of NCDs. Our study offers new opportunities to improve the EENH3 of NERR, bringing NERR closer to the practical application in terms of environmental and economic benefits.
Declaration of competing interest
The authors declare that they have no known competing financial interests or personal relationships that could have appeared to influence the work reported in this paper.
Acknowledgments
We gratefully acknowledge the financial support from the National Natural Science Foundation of China (Nos. 22004060, 22074062, 22276100) and the Natural Science Foundation of Jiangsu Province (No. SBK2022044384). Y. Zhou also thanks the financial support from Research startup fund of Nanjing University of Posts and Telecommunications (NJUPT).
Supplementary materials
Supplementary material associated with this article can be found, in the online version, at doi:10.1016/j.cclet.2022.107888.
[1]
Y. Ren, C. Yu, X. Tan, et al., Energy Environ. Sci. 14 (2021) 1176–1193. doi: 10.1039/d0ee03596c
L. Han, X. Liu, J. Chen, et al., Angew. Chem. Int. Ed. 58 (2019) 2321–2325. doi: 10.1002/anie.201811728
[43]
H. Wang, L. Wang, Q. Wang, et al., Angew. Chem. Int. Ed. 57 (2018) 12360–12364. doi: 10.1002/anie.201805514
[44]
J. Zhang, B. Zhao, W. Liang, et al., Adv. Sci. 7 (2020) 2002630. doi: 10.1002/advs.202002630
Figure 1
(a) The SEM, (b) TEM and (c) HRTEM images of the obtained CuPo-NCDs NF. (d) The Fourier-transform infrared spectroscopy of CuPo and CuPo-NCDs NF. (e) The high-resolution Cu 2p3/2 XPS spectra of CuPo and CuPo-NCDs NF. (f) The high-resolution N 1s XPS spectra of NCDs and CuPo-NCDs NF.
Figure 2
(a) The TEM, HRTEM (inset) and (b) the corresponding element mapping images of the product after reacting NCDs with Cu2+ for 10 min. The SEM images at 6 h (c) and 20 h (d). (e) The TEM and HRTEM (inset) image of the CuPo fabricated in absence of NCDs. (f) The TEM and (g) HRTEM images of the CuPo@NCDs. The black dots in orange circle represent the NCDs. (h) The XRD patterns of the CuPo, NCDs, CuPO@NCDs, and CuPo-NCDs NF. (i) Scheme of the growth mechanism of the CuPo-NCDs NF.
Figure 3
(a) The Raman spectra of different electrodes in electrolyte. (b) The Nyquist plots of different electrodes in deionized water. (c) The enlarged view of the Nyquist plots. (d) The HER suppress performance of CuPo, NCDs, CuPo@NCDs and CuPo-NCDs NF. Schematic representations of the electron and proton transfer pathways in the NCDs (e) and the CuPo-NCDs NF (f).
Figure 4
(a) The FENH3 and (b) the ammonia yield rate for the CuPo-NCDs NF, CuPo@NCDs and NCDs. (c) The stability of CuPo-NCDs NF in catalyzing NERR at 0.0 V vs. RHE. (d) 1H NMR spectra of the NERR products using 14N2 and 15N2 as feed gases.
Figure 5
The FENH3 and ammonia yield rate for (a) CuPo-NCDs NF and (b) NCDs at different temperatures, and (c) the corresponding fitting curves for the estimation of the Ea for NERR. (d) Comparison of the peak EENH3 and the corresponding reaction potential of NERR over CuPo-NCDs NF with other catalysts and other strategies based on filtering proton.

 DownLoad:


 下载:
下载:


