Figure 1.
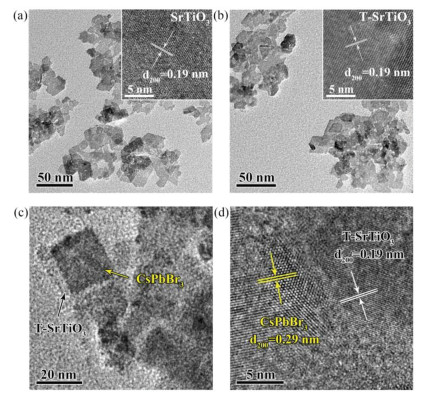
TEM images of (a) SrTiO3 and (b) T-SrTiO3. Insets are the corresponding HRTEM images. (c) TEM and (d) HRTEM images of T-SrTiO3/CsPbBr3.
Lattice-matched in-situ construction of 2D/2D T-SrTiO3/CsPbBr3 heterostructure for efficient photocatalysis of CO2 reduction
Su-Xian Yuan , Ke Su , You-Xiang Feng , Min Zhang , Tong-Bu Lu

Artificial photosynthesis can directly utilize inexhaustible solar energy to reduce CO2 into high value-added fuels or chemicals, which can not only provide partial sustainable energy supply, but also effectively alleviate global climate change induced by the excessive emission of greenhouse gas [1-6]. In an ideal artificial photosynthesis system, water is a desirable electron source for CO2 photoreduction, which furnishes a "green chemistry" route to generate value-added chemicals without employing any expensive sacrificial reagents [7]. That is, the redox capacities of photocatalysts should straddles the requirements of both the CO2 reduction and H2O oxidation potentials [8]. Based on this prerequisite, a variety of semiconductor materials with wide bandgap have been widely exploited as candidates for photocatalytic CO2 reduction coupled with H2O oxidation, such as metal oxides and sulfides [9-11], metal-organic frameworks [12], layered double hydroxides [13], conjugated polymers [14] and so on, but the photocatalytic performance is limited by the weak visible light response and severe charge recombination [15]. Up to now, most of the researches are focused on the amelioration of light-harvesting capacity and photogenerated carrier separation efficiency [16-18].
Among various semiconductor materials, halide perovskite (HP) nanocrystals (NCs) have been widely employed as promising candidate catalysts in the field of photocatalysis [19-22], owing to their fascinating photophysical properties such as robust light-harvesting ability and high separation efficiency of photogenerated carrier [23]. The CO2 photoreduction activity of HP NC based catalysts have been notably meliorated through multifarious strategies such as morphology modification [24, 25], decorating reduction [26-29] or oxidation cocatalysts [30-36]. However, the activity of current halide perovskite based catalysts for artificial is still low owing the deficient active site and/or insufficient separation of photogenerated carriers. Therefore, it is highly imperative to establish viable strategies to improve the performance of HP materials to meet the prerepuisite of practical applications. Recenlty, we have demonstrated that ultra-thin two-dimensional (2D) HP nanosheet (NS) exhibits higher catalytic activity for CO2 photoreduction than conventional HP NCs, due to the increased low coordination metal atom ratio and short carrier diffusion distance of ultra-thin 2D HP NS [24]. In addition, it is widely recognized that the 2D materials are conducive to effective contact and charge separation between components in heterostructure [37, 38]. Based on these analyses, herein we reported a simple lattice-matched in-situ growth strategy for the construction of 2D CsPbBr3 based heterostructure with perovskite oxide (SrTiO3) as substrate to improve the photocatalytic CO2 reduction performance of HP materirals. SrTiO3 (space group Pm3m) possess the same crystal structure with cubic CsPbBr3, and its lattice constant is exactly 2/3 of CsPbBr3 (a = 3.905 vs. 5.830 Å). Therefore, the two cells of CsPbBr3 happen to match the three cells of SrTiO3 in a disproportionate manner, and the lattice mismatch factor is only 0.47% [39]. This low mismatch provides a reasonable condition for CsPbBr3 to in-situ grown tightly on the SrTiO3 surface. Furthermore, considering that SrTiO3 NSs surface were peculiarly prone to precipitate strontium oxides [40, 41], SrTiO3 NSs were treated by NH4F etching to form Ti−O terminated surface (coded as T-SrTiO3), which is beneficial to the interfacial charge separation. As expected, the resultant 2D/2D T-SrTiO3/CsPbBr3 heterostructure display significantly enhanced activity for CO2 photoreduction.
The T-SrTiO3/CsPbBr3 composites were prepared by a two-step synthesis method as shown in Fig. S1 (Supporting information), and specific processes were described in Supporting information. Briefly, the SrTiO3 NSs obtained by ethylene glycol assisted solvothermal method [42] were first treated with hot water and NH4F solution to form Ti−O terminated T-SrTiO3. Then the as-prepared T-SrTiO3 NSs as a substrate were added into the hot-injection reaction system for in-situ growth of CsPbBr3 NSs to generate T-SrTiO3/CsPbBr3 composite. For comparison, the SrTiO3/CsPbBr3 composites with untreated SrTiO3 NSs were also synthesized under the same conditions. Transmission electron microscopy (TEM) measurements demonstrated that the as-prepared SrTiO3 samples are layered shape structures with transverse size of about 20−50 nm (Fig. 1a), and the morphology does not change obviously after NH4F treatment (Fig. 1b). Both the high-resolution TEM (HRTEM) images of SrTiO3 and T-SrTiO3 display 0.19 nm lattice spacing (insets in Figs. 1a and b), corresponding to the (200) crystal plane of SrTiO3. The TEM images of composites (Fig. S2a in Supporting information and Fig. 1c) reveal that the surfaces of SrTiO3 and T-SrTiO3 NSs are successfully decorated with dispersed CsPbBr3 NSs, the sizes of which (~20 nm) are similar to that obtained by identical condition without adding perovskite oxides substrate (Fig. S3 in Supporting information). The corresponding HRTEM images (Fig. S2b in Supporting information and Fig. 1d) exhibit distinct lattice spacing of 0.19 and 0.29 nm, which can be assigned to the (200) lattice planes of cubic phase SrTiO3 and CsPbBr3, respectively. High-angle annular dark-field scanning TEM (HAADF-STEM) and energy-dispersive X-ray spectroscopy (EDS) mapping measurements (Figs. S4 and S5 in Supporting information) further confirmed the successful generation of CsPbBr3 on the perovskite oxide substrates, showing local concentrated element distributions of Cs, Pb and Br.
We further resorted to Fourier transform infrared (FTIR) spectroscopy to explore the influence of NH4F etching on the surface structure of SrTiO3. As shown in Fig. 2a, there are distinct characteristic peaks at 2848, 1514, 1371 and 1081 cm−1 for SrTiO3, which can be attributed to the vibrations of C−H, COO−, Sr−O and C−C−O, respectively [43]. These characteristic peaks obviously decrease or even disappear in T-SrTiO3, indicating that most of the oxides and incomplete reactants were removed on its surface during the process of treatment. In addition, the stretching vibrations peak of NH3+ at 1630 cm−1 [44] in T-SrTiO3 is noticeably increased in comparison with that in SrTiO3, which may be related to the introduction of NH4F. Meanwhile, the broad absorption peaks at the range of 736 and 559 cm−1 assigned to the Ti−O−Ti stretching vibrations and the TiO6 octahedron crystal lattice vibrations [45] have obviously enhanced intensity after treatment, indicating the exposure of Ti and O atoms on the surface of the T-SrTiO3 NSs, which provides favorable condition for the tight growth of CsPbBr3. Additionally, the contents of Sr, Ti and O elements on the surface of SrTiO3 before and after treatment have been analyzed by XPS measurements, and the results showed that the content ratio of Sr, Ti and O elements on the surface of initial SrTiO3 is close to 1:1:3, while the corresponding content is 0.55:1:3 after surface treatment (Table S1 in Supporting information). This result provides further strong evidence that Sr was etched during surface treatment.
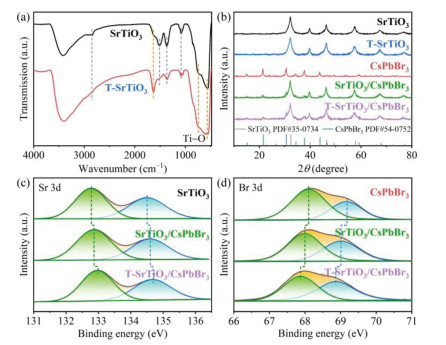
Furthermore, the powder X-ray diffraction (PXRD) and ultraviolet-visible diffuse reflectance spectroscopy (UV−vis DRS) measurements (Fig. 2b and Fig. S6 in Supporting information) confirmed that the etching of trace NH4F solution only treated the surface of SrTiO3, while did not change its internal crystal structure and optical absorption. PXRD patterns (Fig. 2b) of the composites have the characteristic diffraction signals of SrTiO3 (JCPDS No. 35−0734) [46] and CsPbBr3 (JCPDS No. 54−0752) [47]. The absorption edges of T-SrTiO3 and CsPbBr3 NSs are 378 and 537 nm, respectively, which can also be clearly observed in T-SrTiO3/CsPbBr3 and SrTiO3/CsPbBr3 composites (Fig. S6). In addition, the X-ray photoelectron spectroscopy (XPS) measurements showed that the binding energy of T-SrTiO3/CsPbBr3 for Sr 3d, Ti 2p and O 1s have perceptible shift to high binding energy direction compared to those of pristine SrTiO3, while the signals for Cs 3d, Pb 4f and Br 3d move in the opposite direction with respect to individual CsPbBr3 as presented in Figs. 2c, d and Fig. S7 (Supporting information). The corresponding binding energies in SrTiO3/CsPbBr3 also have a similar change trend, but the amplitude is obviously weaker, indicating that there are stronger electron coupling between T-SrTiO3 and CsPbBr3 due to the tight contact between T-SrTiO3 and CsPbBr3.
The band gaps (Eg) of T-SrTiO3 and CsPbBr3 were determined by the Tauc plots derived from UV−vis DRS spectra (Fig. S8 in Supporting information), be 3.24 and 2.35 eV, respectively. The valence band edge potentials (EVB) of T-SrTiO3 and CsPbBr3 can be calculated to be 2.34 and 1.23 V relative to normal hydrogen electrode (NHE) by the ultraviolet photoelectron spectroscopy (UPS) measurements (Fig. S9 in Supporting information). Combined with Eg and EVB values, we can derive the conduction band edge potentials (ECB) of T-SrTiO3 and CsPbBr3 to be −0.90 and −1.12 V (vs. NHE), respectively. Apparently, the T-SrTiO3/CsPbBr3 heterostructure should show staggered band arrangement as depicted in Fig. 3a. In addition, both T-SrTiO3 and CsPbBr3 feature n-type semiconductor characteristics because their Mott−Schottky plots have positive slopes at different frequencies (Fig. S10 in Supporting information). Therefore, their Fermi level (EF) positions should be biased towards the edges of the corresponding conduction bands, which can be confirmed by the UPS spectra measurements (Fig. S9), locating at −0.52 and −0.41 eV (vs. NHE) for T-SrTiO3 and CsPbBr3 (Fig. 3a). When T-SrTiO3 and CsPbBr3 are in close contact, this difference in EF will drive the transfer of interface free electrons from T-SrTiO3 to CsPbBr3 to achieve the EF balance of the system. As a result, a built-in electric field pointing from T-SrTiO3 to CsPbBr3 will form at the heterostructure interface.
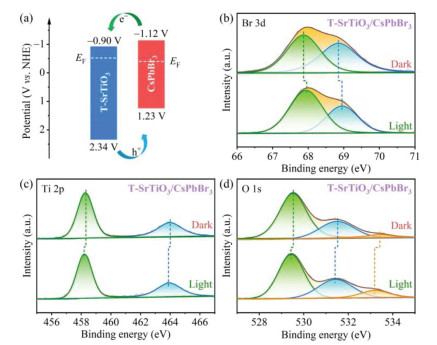
The resultant built-in electric field and band bending (Fig. S11 in Supporting information) will facilitate the transfer of photogenerated electrons from CsPbBr3 to T-SrTiO3, and vice versa for photogenerated holes. The in-situ irradiated XPS measurements were further performed to analyze the interfacial charge transfer orientation in T-SrTiO3/CsPbBr3 heterostructure. As shown in Fig. 3b, upon light irradiation, the binding energy of Br 3d in T-SrTiO3/CsPbBr3 shifted positively, which implies that hole accumulation occurred in CsPbBr3. Meanwhile, the binding energies of Ti 2p (Fig. 3c) and O 1s (Fig. 3d) in T-SrTiO3/CsPbBr3 shifted negatively after light irradiation, indicating that the electron density increased around Ti and O cores. These light-induced binding energy shifts confirmed that the photogenerated electrons in CsPbBr3 can transfer to SrTiO3, and the holes in CsPbBr3 can transfer to SrTiO3, which accords with the traditional Ⅱ type double charge transfer mechanism.
The dynamics of photogenerated carriers in T-SrTiO3/CsPbBr3 heterostructure was further scrutinized by time-resolved photoluminescence (TRPL) measurements. As shown in Fig. 4a, the TRPL decay traces can be well fitted with a three-exponential function to determine the average lifetimes of PL decays (Table S2 in Supporting information). The TRPL decay curve of pure CsPbBr3 NSs denote the radiative and nonradiative processes of photogenerated excitons in CsPbBr3, showing an average lifetime of 43.88 ns. Decorating CsPbBr3 on the surface of SrTiO3 leads to a distinctly accelerated PL decay, and the average PL lifetime is shortened to 23.02 ns, indicating the occurrence of charge transfer between SrTiO3 and CsPbBr3 owing to their favorable energy-offset and the formation built-in electric field (Fig. S11). It is noted that replacing SrTiO3 with T-SrTiO3 results in a further significant acceleration of PL decay with an average PL lifetime of 7.64 ns, which indicates faster charge transfer at the T-SrTiO3/CsPbBr3 heterostructure interface in comparison with that at SrTiO3/CsPbBr3 counterpart, owing to the stronger electron coupling between T-SrTiO3 and CsPbBr3 (Figs. 2c and d). The efficient charge separation in T-SrTiO3/CsPbBr3 can be further proved by photocurrent response (I−t) and electrochemical impedance spectroscopy (EIS) experiments. As shown in Fig. 4b, the photocurrent density of T-SrTiO3/CsPbBr3 is significantly higher than those of SrTiO3, CsPbBr3 and SrTiO3/CsPbBr3. T-SrTiO3/CsPbBr3 also shows a smaller diameter of semicircular arc (Fig. 4c) than those of SrTiO3, CsPbBr3 and SrTiO3/CsPbBr3.
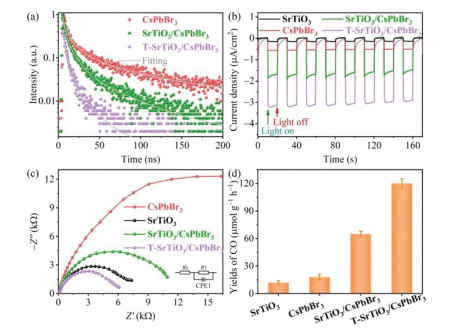
A gas-solid reactor (Fig. S12 in Supporting information) was employed to evaluate the photocatalytic CO2 reduction activities of the as-prepared catalysts with water vapor as the electron donor. A 300 W xenon lamp was used as the illuminant with a light intensity of 100 mW/cm2. The main reduction product was confirmed by gas chromatography analysis to be CO, and there are no other reduction products that could not be ignored (Fig. S13 in Supporting information). The CO formation rates of all photocatalysts were compiled in Fig. 4d. Both the SrTiO3 and CsPbBr3 NSs exhibit very poor photocatalytic activity for CO2 reduction, with the CO formation rates of 12.1 ± 2.3 and 18.3 ± 3.1 µmol g−1 h−1, respectively, owing to the weak light absorption capacity and/or insufficient charge separation efficiency. SrTiO3/CsPbBr3 heterostructure exhibits a significant enhanced activity for CO2 photoreduction, owing to the improved charge separation. Increasing the content of SrTiO3 results in a volcanic tendency for CO2 photoreduction activity (Fig. S14 in Supporting information). The evolution of CO reaches an optimal value of 65.5 ± 3.4 µmol g−1 h−1 (Fig. 4d), which is about 5.4 and 3.6 times higher than those of individual SrTiO3 and CsPbBr3 nanosheets, respectively. Moreover, the T-SrTiO3/CsPbBr3 heterostructure exhibits a further manifest enhancement of photocatalytic activity for CO2 conversion due to the accelerated interfacial charge transfer. The CO generation rate of T-SrTiO3/CsPbBr3 reaches up to 120.2 ± 4.9 µmol g−1 h−1, and the corresponding electron consumption (Relectron = 2nCO, nCO denote the yield of CO) yield is 240.4 ± 9.8 µmol g−1 h−1, which surpasses the reported halide perovskite-based photocatalysts under the same conditions (Table S3 in Supporting information).
In addition, the photocatalytic stability of T-SrTiO3/CsPbBr3 was further estimated by cyclic test. As shown in Fig. S15 (Supporting information), the percentage decrease of CO formation rate after 5 cycles is less than 10%, indicating that T-SrTiO3/CsPbBr3 has good stability in the gas−solid reaction system. Further XRD and XPS measurements confirmed that the structure of T-SrTiO3/CsPbBr3 heterostructure is well maintained after the photocatalytic reaction (Figs. S16 and S17 in Supporting information). Control experiments were further carried out to determine the source of CO using T-SrTiO3/CsPbBr3 as photocatalyst. As shown in Fig. S18 (Supporting information), the product cannot be detected in the absence of light irradiation or photocatalyst, indicating that the CO2 reduction is initiated by light on the photocatalyst. The blank experiment without CO2 showed trace CO, which should be the result of the decomposition of residual surface ligands, indicating that the carbon source of CO mainly comes from CO2. In addition, the control experiment in the absence of water vapor also showed negligible CO production, demonstrating that the electron source of CO2 photoreduction came from water oxidation. These inferences can be further confirmed by 13CO2 and H218O isotope labeling experiments (Fig. S19 in Supporting information). Mass spectrometry (MS) measurements can clearly detect signals at m/z = 29 corresponding to 13CO and at m/z = 36 assigning to 18O2.
To summarize, we have successfully constructed 2D/2D T-SrTiO3/CsPbBr3 heterostructure by lattice-matched in-situ growth of CsPbBr3 NSs on surface treated SrTiO3 NSs. Thermodynamic characterization has demonstrated formation of type Ⅱ heterostructure between T-SrTiO3 and CsPbBr3. The favorable energy-offset and strong electron coupling at heterostructure interface result in an efficient charge separation as confirmed by joint XPS, TRPL and electrochemical investigation, which endows T-SrTiO3/CsPbBr3 heterostructure exhibiting significantly enhanced photocatalytic performance for CO2 reduction, reaching up to an exciting CO yield of 120.2 ± 4.9 µmol g−1 h−1 in the absence of any organic sacrificial agents, which is about 10 and 7 times higher than that of pure SrTiO3 and CsPbBr3 NSs, respectively. This work provides a simple and versatile strategy for the construction of HP based heterostructures with speedy charge separation to achieve efficient photocatalytic CO2 reduction.
The authors declare that they have no known competing financial interests or personal relationships that could have appeared to influence the work reported in this paper.
This work was financially supported by the Natural Science Foundation of Tianjin City (No. 17JCJQJC43800), the National Key R&D Program of China (No. 2017YFA0700104), NSFC (Nos. 21931007, U21A20286), and the 111 Project of China (No. D17003).
Supplementary material associated with this article can be found, in the online version, at doi:
W. Gao, S. Liang, R. Wang, et al., Chem. Soc. Rev. 49 (2020) 8584–8686. doi: 10.1039/D0CS00025F
J. Fu, K. Liu, K. Jiang, et al., Adv. Sci. 6 (2019) 1900796. doi: 10.1002/advs.201900796
J. Fu, K. Jiang, X. Qiu, J. Yu, M. Liu, Mater. Today 32 (2020) 222–243. doi: 10.1016/j.mattod.2019.06.009
K.Q. Lu, Y.H. Li, F. Zhang, et al., Nat. Commun. 11 (2020) 5181. doi: 10.1038/s41467-020-18944-1
Y.H. Chen, M.Y. Qi, Y.H. Li, Cell Rep. Phys. Sci. 2 (2021) 100371. doi: 10.1016/j.xcrp.2021.100371
L. Yuan, M.Y. Qi, Z.R. Tang, Y.J. Xu, Angew. Chem. Int. Ed. 60 (2021) 21150–21172. doi: 10.1002/anie.202101667
Q. Wang, J. Warnan, S. Rodríguez-Jiménez, et al., Nat. Energy 5 (2020) 703–710. doi: 10.1038/s41560-020-0678-6
W. Zhang, A.R. Mohamed, W.J. Ong, Angew. Chem. Int. Ed. 59 (2020) 22894–22915. doi: 10.1002/anie.201914925
S.N. Habisreutinger, L. Schmidt-Mende, J.K. Stolarczyk, Angew. Chem. Int. Ed. 52 (2013) 7372–7408. doi: 10.1002/anie.201207199
S. Du, J. Lian, F. Zhang, Trans. Tianjin Univ. 28 (2022) 33–52. doi: 10.1007/s12209-021-00303-w
J. Wang, S. Lin, N. Tian, et al., Adv. Funct. Mater. 31 (2021) 2008008. doi: 10.1002/adfm.202008008
J.D. Xiao, H.L. Jiang, Acc. Chem. Res. 52 (2019) 356–366. doi: 10.1021/acs.accounts.8b00521
S.F. Ng, M.Y.L. Lau, W.J. Ong, Sol. RRL 5 (2021) 2000535. doi: 10.1002/solr.202000535
C. Dai, B. Liu, Energy Environ. Sci. 13 (2020) 24–52. doi: 10.1039/C9EE01935A
J.K. Stolarczyk, S. Bhattacharyya, L. Polavarapu, et al., ACS Catal. 8 (2018) 3602–3635. doi: 10.1021/acscatal.8b00791
J. Fu, S. Wang, Z. Wang, et al., Front. Phys. 15 (2020) 33201. doi: 10.1007/s11467-019-0950-z
Y. Wang, T. He, J. Mater. Chem. A 9 (2021) 87–110. doi: 10.1039/D0TA09011E
J. Fu, K. Liu, H. Li, et al., Environ. Chem. Lett. 20 (2022) 243–262. doi: 10.1007/s10311-021-01335-3
S. Park, W.J. Chang, C.W. Lee, et al., Nat. Energy 2 (2017) 16185.
G. Gao, Q. Xi, H. Zhou, et al., Nanoscale 9 (2017) 12032–12038. doi: 10.1039/C7NR04421F
Y.F. Xu, M.Z. Yang, B.X. Chen, et al., J. Am. Chem. Soc. 139 (2017) 5660–5663. doi: 10.1021/jacs.7b00489
X. Zhu, Y. Lin, Y. Sun, et al., J. Am. Chem. Soc. 141 (2019) 733–738. doi: 10.1021/jacs.8b08720
M.V. Kovalenko, L. Protesescu, M.I. Bodnarchuk, Science 358 (2017) 745–750. doi: 10.1126/science.aam7093
L.Y. Wu, M.R. Zhang, Y.X. Feng, et al., Sol. RRL 5 (2021) 2100263. doi: 10.1002/solr.202100263
Q. Chen, Y. Ma, L. Wang, et al., Sol. RRL 5 (2021) 2000755.
J. Cheng, Y. Mu, L. Wu, et al., Nano Res. 15 (2022) 1845–1852. doi: 10.1007/s12274-021-3775-3
Z. Chen, Y. Hu, J. Wang, et al., Chem. Mater. 32 (2020) 1517–1525. doi: 10.1021/acs.chemmater.9b04582
X. Wang, J. He, J. Li, et al., Appl. Catal. B 277 (2020) 119230. doi: 10.1016/j.apcatb.2020.119230
N.N. Guo, Z.L. Liu, Y.F. Mu, et al., Chin. Chem. Lett. 33 (2022) 3039–3042. doi: 10.1016/j.cclet.2021.09.033
M. Que, Y. Zhao, Y. Yang, et al., ACS Appl. Mater. Interfaces 13 (2021) 6180–6187. doi: 10.1021/acsami.0c18391
F. Xu, K. Meng, B. Cheng, et al., Nat. Commun. 11 (2020) 4613. doi: 10.1038/s41467-020-18350-7
H. Huang, J. Zhao, Y. Du, et al., ACS Nano 14 (2020) 16689–16697. doi: 10.1021/acsnano.0c03146
J. Wang, J. Wang, N. Li, et al., ACS Appl. Mater. Interfaces 12 (2020) 31477–31485. doi: 10.1021/acsami.0c08152
Y.F. Mu, W. Zhang, G.X. Dong, et al., Small 16 (2020) 2002140. doi: 10.1002/smll.202002140
Y. Jiang, J.F. Liao, H.Y. Chen, et al., Chem 6 (2020) 766–780. doi: 10.1016/j.chempr.2020.01.005
M. Ou, W. Tu, S. Yin, et al., Angew. Chem. Int. Ed. 57 (2018) 13570–13574. doi: 10.1002/anie.201808930
X. Zhang, Y. Yang, L. Xiong, et al., Chin. Chem. Lett. 33 (2022) 2111–2116. doi: 10.1016/j.cclet.2021.08.053
M.Y. Qi, Q. Lin, Z.R. Tang, Y.J. Xu, Appl. Catal. B 307 (2022) 121158. doi: 10.1016/j.apcatb.2022.121158
J. Chen, D.J. Morrow, Y. Fu, et al., J. Am. Chem. Soc. 139 (2017) 13525–13532. doi: 10.1021/jacs.7b07506
J.G. Connell, B.J. Isaac, G.B. Ekanayake, et al., Appl. Phys. Lett. 101 (2012) 251607. doi: 10.1063/1.4773052
M. Kawasaki, K. Takahashi, T. Maeda, et al., Science 266 (1994) 1540–1542. doi: 10.1126/science.266.5190.1540
A. Thesing, E.J. Damiani, L.F. Loguercio, et al., ACS Omega 5 (2020) 33007. doi: 10.1021/acsomega.0c04343
J. Liu, H. Bai, Y. Wang, et al., Adv. Funct. Mater. 20 (2010) 4175–4181. doi: 10.1002/adfm.201001391
H.Y. Huang, R.T. Yang, D. Chinn, et al., Ind. Eng. Chem. Res. 42 (2003) 2427–2433. doi: 10.1021/ie020440u
X. Wu, C. Wang, Y. Wei, et al., J. Catal. 377 (2019) 309–321. doi: 10.1016/j.jcat.2019.07.037
Y. Wei, J. Wang, R. Yu, et al., Angew. Chem. Int. Ed. 58 (2019) 1422–1426. doi: 10.1002/anie.201812364
J. Hou, S. Cao, Y. Wu, et al., Chem. Eur. J. 23 (2017) 9481–9485. doi: 10.1002/chem.201702237

Figure 1 TEM images of (a) SrTiO3 and (b) T-SrTiO3. Insets are the corresponding HRTEM images. (c) TEM and (d) HRTEM images of T-SrTiO3/CsPbBr3.

Figure 2 (a) FTIR spectra of SrTiO3 and T-SrTiO3. (b) Powder XRD patterns of SrTiO3, T-SrTiO3, CsPbBr3, SrTiO3/CsPbBr3 and T-SrTiO3/CsPbBr3. High-resolution XPS spectra of (c) Sr 3d and (d) Br 3d in SrTiO3, SrTiO3/CsPbBr3 and T-SrTiO3/CsPbBr3.

Figure 3 (a) Energy band diagrams of T-SrTiO3 and CsPbBr3 before contact. High-resolution XPS spectra of (b) Br 3d, (c) Ti 2p and (d) O 1s in T-SrTiO3/CsPbBr3 in the dark and under light irradiation.

Figure 4 (a) Time-resolved PL decay curves of CsPbBr3, SrTiO3/CsPbBr3 and T-SrTiO3/CsPbBr3. (b) I−t curves and (c) EIS Nyquist plots of SrTiO3, CsPbBr3, SrTiO3/CsPbBr3 and T-SrTiO3/CsPbBr3 under light irradiation. (d) Yields of CO with SrTiO3, CsPbBr3, SrTiO3/CsPbBr3 and T-SrTiO3/CsPbBr3 as photocatalysts, under 300 W Xe lamp with the light intensity of 100 mW/cm2.

 扫一扫看文章

扫一扫关注我们
 DownLoad:
 下载:
下载: