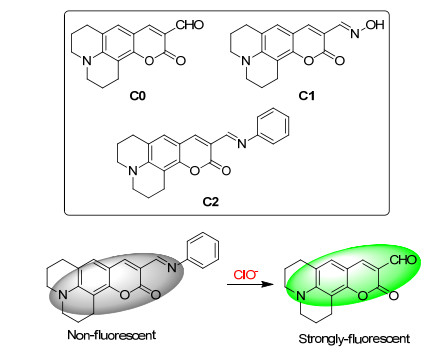
Scheme 1.
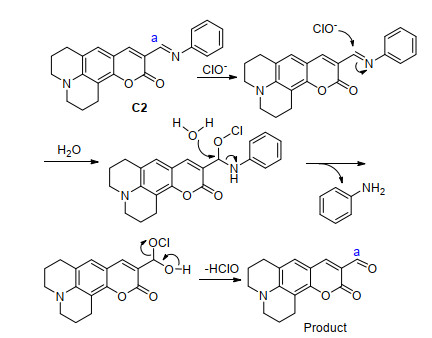
Structures of compounds C0, C1 and C2 and the sensing process

Recently, the real-time detection for hypochlorite with high sensitivity and selectivity has aroused extensive attention due to the fact that it is implicated in a variety of pathological diseases (such as atherosclerosis, neuron degeneration, cystic fibrosis, arthritis, and cancers) on the one hand, [1] and is widely used in the household bleach, disinfection of drinking water and cool-water treatment on the other.[2] Therefore, a number of fluorescent probes for HClO detection have been exploited taking advantages of the strong oxidative ability of HClO towards specific recognition sites, [3] including chalcogenide atoms of S/Se/ Te, N-containing hydrazine/oxime/hydrazone/Schiff bases, unsaturated C=C bond, p-methoxyphenol/p-methoxyani- line and other groups. For practical applications, probes with fluorescence "turn-on" signals in the presence of analytes are superior to those with "turn-off" response which may be significantly influenced by some background factors.[4] However, the design of small molecule-based probes with fluorescence enhancement response is still challenging.
In this work, we expected to obtain novel "switching-on" probe for ClO- detection by utilizing its unique oxidative ability. Compounds C1 and C2 were designed and synthesized, which were composed of a coumarin dye and an oxime protective group as the recognition unit (Scheme 1). It was expected that the oxime protective group could be removed by ClO― to liberate the aldehyde group, accompanying with the "off-on" signal. Herein, we would like to describe the synthesis and the spectroscopic evaluation of the new fluorescent probes toward hypochlorite in detail, featuring advantages such as easy-to- make, good solubility, switching-on signal changes, high sensitivity, rapid response, as well as the successful practical application in bioimaging and tap water.
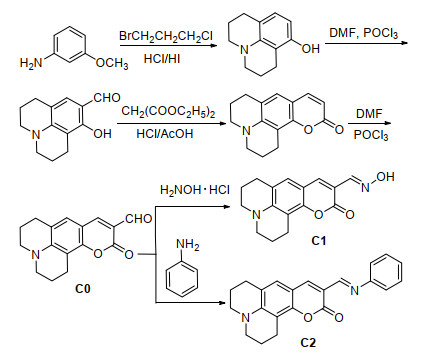
The synthetic route to compounds C0, C1 and C2 was depicted in Scheme 2. It was easily seen that the target compounds were prepared conveniently through the general nucleophilic addition between aldehyde C0 and amino, following the similar procedure in the reported literature. The whole synthetic route was simple and the purification was easy. Target compounds C1 and C2 exhibited good solubility in common organic solvents, such as acetone, N, N-dimethylformamide (DMF), dimethyl sulfoxide (DMSO), CH3CN, and tetrahydrofuran (THF). Their structures were well characterized by 1H NMR, 13C NMR, ESI-MS and elemental analysis, and all gave satisfactory spectral data.
Before the sensing experiments, the photoluminescence behaviors of compounds C1 and C2 were firstly examined. With the addition of water into DMSO solution (with final concentrations kept unchanged at 10 μmol/L), the fluorescent intensity of C1 was gradually enhanced. Differently from compound C1, the DMSO solution of C2 was strongly luminescent. However, when different amounts of water were added, the emission spectra decreased greatly: the resultant mixture became nearly non-fluorescent with the quantum yield of only ca. 2% upon the addition of 90% H2O. As we know, with the increasing amount of water, the solubility of organic compounds C1 and C2 became poor, and more molecules existed as aggregate state. As to compound C1, its light emission was further enhanced by aggregate formation, which was similar to the AIEE-active (aggregation-induced emission enhancement, AIEE) chro- mophoric materials reported by Tang et al.[5] While in the case of compound C2, an emissive material was induced to non-emission by aggregation, consistently with the normal aggregation-caused quenching (ACQ) molecules. The different photoluminescence behaviors between compounds C1 and C2 were possibly ascribed to their different solubility and different size of the rotor (hydroxyl in C1 and phenyl group in C2), which were consistent with the reported literature.[6] In terms of aldehyde C0, the emission spectra shifted only from 508 nm to 512 nm with the addition of 10% water. However, the intensity kept almost stable with continuous increasing of H2O.
Considering the practical application, 2-(4-(2-hydroxy- ethyl)-1-piperazinyl)ethanesulfonic acid (HEPES) buffer (containing 10% DMSO) was chosen as the sensing medium. The aqueous solution itself of C1 was relatively emissive, which was not beneficial to the production of a high signal output during detection process. Through subtle adjustments to the structure, compound C2 was designed and expected to efficiently sense ClO- with off-on response. Comparatively, it was apparent that in the sensing medium, the transformation from compound C2 to aldehyde C0 would induce remarkable enhancement of emission intensity, which would be beneficial to the design of "switching-on" fluorescence probe.
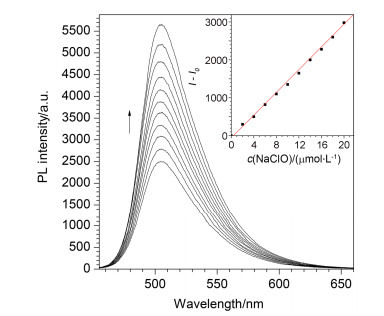
Firstly, the sensing properties of C1 in response to ClO- were investigated and 10 mmol/L HEPES buffer (pH 7.4) containing 10% DMSO was chosen as the reaction medium. We tried to add ClO- into the diluted solution of oximes C1 (Figure 1), immediately, the emission spectra displayed significant enhancement even with the concentration of ClO- as low as 2 μmol/L. With the increase of ClO- concentration in the test system, the intensity centered at ca. 510 nm increased correspondingly. When 20 μmol/L ClO- was added, the emission intensity reached the maximum with remarkable enhancement. To see the results more visually, we summarized the emission intensity changes as a function of ClO- concentrations. As demonstrated in the inset of Figure 1, in the range of 0~20 μmol/L, there was a nearly linear relationship between the intensity change and the concentration of ClO-, which was beneficial to the detection of ClO- quantitatively.
Fom bottom to top: 0.0, 2.0, 4.0, 6.0, 8.0, 10.0, 12.0, 14.0, 16.0, 18.0 and 20.0 µmol/L ClO-. Inset: plot of fluorescent intensity at 510 nm of C1 as a function of the concentration of ClO-
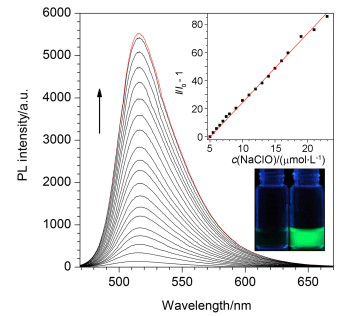
Firstly, the effect of pH values on the emission spectra of C2 and C2+ClO- was investigated. It was obvious that the detection of C2 for ClO- could be operated in a wide pH range of 3.0~10.0. In the titration experiment, the pH 7.4 was chosen by using the HEPES buffer for the purpose of physiological application. Consequently, the sensing property of C2 in response to ClO- was investigated under this condition (DMSO/ HEPES, V:V=1:9, pH 7.4). As shown in Figure 2, the emission intensity at 510 nm increased immediately to about 3 times of the original one with the addition of ClO- as low as 0.3 µmol/L. When 18.0 µmol/L ClO- was added, the emission intensity reached its peak with about 85-fold enhancement (I/I0-1). With continuous increase of ClO- in the test system, the fluorescence quantum yield increased from 0.02 to 0.73. Meanwhile, the emission profile became gradually similar to that of its precursor, namely, aldehyde C0. Furthermore, there was a nearly linear relationship between the intensity change and the ClO- concentration as demonstrated in the plot of Figure 2. The detection limit of probe C2 was evaluated based on the above fluorescence titration and then calculated with the following equation: detection limit=3σ/k[7]. Where σ is the standard deviation of blank measurement acquired by ten times measurement of emission spectrum of C2, and k is the slope from the inset plot in Figure 2. Accordingly, the detection limit of probe C2 was calculated to be as low as 1.8×10⁻⁷ mol/L. Actually, the fluorescence difference of C2 before and after the addition of ClO- could be easily distinguished by naked eyes. As displayed in the inset of Figure 2, the solution changed from non-emission to strongly green fluorescence with the aid of a normal UV lamp. Thus, these results indicated that upon the addition of ClO-, the hypochlorite-promoted oxidation reaction of imine C2 really occurred as expected, and the precursor aldehyde C0 was formed step by step. As shown in Figures 1 and 2, with the addition of same concentration of ClO- anions (2 µmol/L), the fluorescent intensity of C2 at 510 nm increased by ca. 12 times of the original one while that of C1 increased by 0.18 times only. Furthermore, with the addition of 18 µmol/L ClO- anions, the fluorescent intensity at 510 nm increased by 85 and 1.28 times of the original one for C2 and C1, respectively. Therefore, comparing their sensing performance toward NaClO, it was obvious that C2 had much higher sensitivity than C1.
Black lines: from bottom to top: 0.0, 0.3, 0.5, 0.8, 1.2, 1.5, 2.0, 2.5, 3.0, 4.0, 5.0, 6.0, 7.0, 8.0, 9.0, 11.0, 13.0, 16.0 and 18.0 µmol/L ClO-; red line: 10 µmol/L C0. Inset: Plot of fluorescent intensity at 510 nm of C2 as a function of ClO- concentration; fluorescent photograph of C2 and C2+NaClO
To evaluate the specific nature of C2 toward hypochlorite anion, the influences of representative anions such as
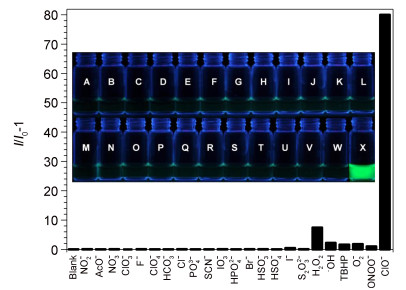
Inset: fluorescent photograph of C2 to various anions. A~X: blank,
The application of probe C2 to track intracellular ClO- levels was also investigated by using a scanning microscopy. As shown in Figure 4c, the HeLa cells displayed apparent green fluorescence after staining with C2 (20 μmol/L, 20 min) and consequently incubated with ClO- (50 μmol/L, 20 min). By contrast, in the control experiment, incubation of HeLa cells with only probe C2 gave no significant fluorescence (Figure 4a). The bright-field images demonstrated that the cells were viable during the imaging experiments (Figure 4b and 4d). The fluorescence imaging results were in consistent with the observations in titration experiments, and indicated that probe C2 could penetrate the cell membrane and be used for imaging of ClO- in living cells and in vivo potentially.
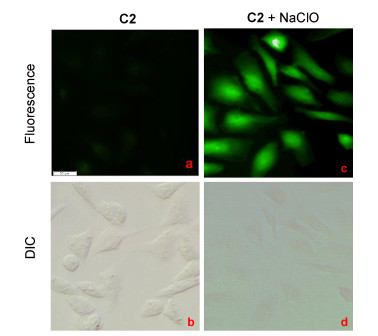
(a and b) image of cells incubated with C2 (20 μmol/L) for 20 min; (c and d) fluorescence image of cells pre-treated with C2 (20 μmol/L) for 20 min and then incubated with ClO- (50 μmol/L) for 20 min. Scale bar: 20 μm
To further evaluate its practical application, tap water was analyzed using the present hypochlorite-sensing sys- tem. Excitingly, even the addition of 50 μL tap water led to marked emission increasement. Moreover, the fluorescent intensity changed continually with the increasing amount of tap water. Accordingly, standard addition method was utilized to determine the concentration of ClO- in the tap water samples and ClO- spiked tap samples, respectively. Firstly, the addition of 300 μL of tap water led to marked increase (I/I0-1=16) in the emission intensity of the sensing system. According to the equation of linear regression in the inset of Figure 2, it could be calculated the concentration of tap water sample as 2.9×10⁻⁵ mol/L, which was higher than the required concentrations (8.4×10⁻⁶ mol/L) in tap water set by the Standardization Administration of the People's Republic of China. Next, the ClO- spiked tap samples were investigated using the same method. Accordingly, the addition of tap water samples spiked with of ClO- (the final concentration was calculated to be 2.0×10⁻⁵ mol/L) led to a significant increase (I/I0-1=24) in the fluorescence spectra and the total concentration of ClO- in this sample was calculated to be 5.0×10⁻⁵ mol/L. Eliminating the ClO- in tap water, we calculated the spiked ClO- as 2.1×10⁻⁵ mol/L, which was in good agreement with the true values. These results indicated that this novel probe could be used for quantitative analysis of ClO- levels potentially in environmental samples.
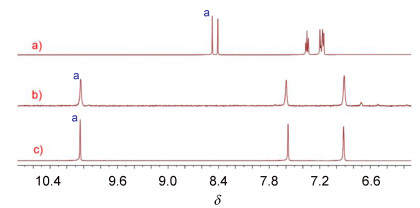
Compound C2 was taken as an example to explore the sensing mechanism. The reaction of C2 with 20 equiv. ClO- was carried out in CH3OH-H2O (V:V=9:1) solution. After stirring at ambient temperature for 2 h, the major product was purified by chromatography on a silica gel column. Characterized by ESI-MS spectrometry and 1H NMR spectroscopy, it was found that the product from the reaction of C2 with ClO- was compound C0, in which the imine group was converted to an aldehyde group. The ESI-MS spectrum of C2 revealed a main peak at m/z 345.9 before ClO- was added to C2, corresponding to the species [C2+H]+ (m/zcalcd=345.2). After the addition of excess ClO- into the solution of C2, a new peak at about 269.8 appeared coinciding exactly with that for the species [C0+H]+ (m/zcalcd=270.1), indicating the transformation from imine to aldehyde group. To further verify the nature of the oxidation reaction, the major reaction product was also underwent 1H NMR analysis (Figure 5). For the isolated product from the reaction of C2 with ClO- (Figure 5b), the signals at δ 8.5 ascribed to the CH=N proton (Ha) and the signals of proton on benzene vanished while a new signal at about δ 10.1 (CHO proton) appeared, indicating that the C=N bond of probe C2 transformed into aldehyde group from an oxidative cleavage reaction with ClO-. In fact, the corresponding 1H NMR spectrum of C2-ClO- was the same as that of aldehyde C0 (Figure 5c). Accordingly, we proposed the possible sensing mechanism of the present system as demonstrated in Scheme 3.
In summary, two novel coumarin-type fluorescent probes (compounds C1 and C2) were synthesized for the rapid detection of ClO- by employing the special oxidation property of hypochlorite. Comparingly, probe C2 had much more excellent performance than C1 toward NaClO. Upon the addition of ClO- to the solution of probe C2, the emission intensity increased by about 85-fold and the fluorescence quantum yield increased from 0.02 to 0.73. Meanwhile, the solution changed from non-fluorescence to strongly green fluorescence which could be easily distinguished by naked eyes with the aid of a normal UV lamp. Consequently, probe C2 could detect ClO- quantitatively with a detection limit as low as 1.8×10⁻⁷ mol/L. The probe displayed extremely high selectivity for ClO- over other common anions and oxidants. Furthermore, probe C2 could be used for the successful bioimaging as well as analysis of ClO- levels in tap water.
All reagents were of analytical reagent grade and used without further purification. Deionized water was used in all experiments. Inorganic salts were purchased from Shanghai Chemical Reagent Co. (Shanghai, China). Ethanol was dried over and distilled from Na under an atmosphere of dry nitrogen. N, N-Dimethylfomamide (DMF) was dried over and distilled from CaH2 under an atmosphere of dry nitrogen.
The 1H NMR and 13C NMR spectra were measured on a Bruker500 spectrometer using tetramethylsilane (TMS; δ 0) as internal standard. Melting points were measured on a Beijing Taike XT-4 microscopy melting point apparatus, and the thermometer was uncorrected. Elemental analyses were performed by a CARLOERBA-1106 microelemental analyzer. The ESI mass spectra were measured on a Finnigan LCQ advantage mass spectrometer. Photoluminescence spectra were performed on a Hitachi F-4700 fluorescence spectrophotometer. The pH values were determined by using a DELTA 320 PH dollar.
Compound C0[8] was readily synthesized according to the literature. Yellow solid, 83% yield. 1H NMR (500 MHz, CDCl3) δ: 10.06 (s, 1H, CHO), 8.06 (s, 1H, ArH), 6.93 (s, 1H, ArH), 3.36 (t, J=10.0 Hz, 4H, 2CH2), 2.86 (t, J=7.5 Hz, 2H, CH2), 2.75 (t, J=10.0 Hz, 2H, CH2), 1.96~1.99 (m, 4H, 2CH2); 13C NMR (125 MHz, CDCl3) δ: 187.8, 162.1, 153.7, 149.3, 144.8, 128.2, 119.8, 112.6, 108.0, 106.0, 50.3, 49.9, 27.2, 20.8, 19.8; MS (ESI) m/z (%): 269.8 ([M+H]+, 100), 270.9 (18.0), 271.9 (2.1).
Compound C0 (161 mg, 0.6 mmol) and hybroxylamine hydrochloride (85 mg, 1.2 mmol) in ethanol (5 mL) were stirred at room temperature overnight. After the reaction, the solvent was removed under reduced pressure. The resultant residue was purified by silica gel column chromatography (dichloromethane/ethyl acetate/methanol, V: V:V=35:5:1) to afford C1 as yellow solid (107 mg, 63% yield). m.p. 196~198 ℃; 1H NMR (500 MHz, DMSO-d6) δ: 11.04 (s, 1H, OH), 8.04 (s, 1H, ArH), 7.98 (s, 1H, ArH), 7.14 (s, 1H, ArH), 3.28~3.35 (m, 4H, 2CH2), 2.70~2.78 (m, 4H, 2CH2), 1.85~1.90 (m, 4H, 2CH2); 13C NMR (125 MHz, DMSO-d6) δ: 160.7, 151.6, 146.8, 143.4, 138.9, 126.5, 119.2, 110.8, 108.0, 105.7, 49.8, 49.3, 27.2, 21.2, 20.3, 20.1; MS (ESI) m/z (%): 285.1 (100, [M+H]+), 286.1 (18.4), 287.1 (2.2). Anal calcd for C16H16N2O3 C 67.59, H 5.67, N 9.85; found C 67.64, H 5.29, N 9.99.
The solution of aldehyde C0 (80.5 mg, 0.3 mmol) in 5 mL of hot absolute ethanol was added into the solution of aniline (42 mg, 0.45 mmol) in 5 mL of absolute ethanol. The mixture was refluxed for 6 h to yield orange precipitate. The precipitate was filtrated and then recrystallized from ethanol to get compound C2 as orange solid (65 mg, 62.5% yield). m.p. 225~228 ℃; 1H NMR (500 MHz, DMSO-d6) δ: 8.50 (s, 1H, ArH), 8.44 (s, 1H, ArH), 7.39 (t, J=7.5 Hz, 2H, ArH), 7.16~7.24 (m, 4H ArH), 2.69~2.75 (m, 4H, 2CH2), 1.85~1.91 (m, 4H, 2CH2), 1.13~1.18 (m, 4H, 2CH2); 13C NMR (125 MHz, DMSO-d6) δ: 161.2, 154.6, 151.8, 151.5, 147.5, 141.4, 129.2, 127.3, 125.7, 120.9, 119.1, 112.3, 107.7, 105.0, 49.7, 48.9, 26.8, 20.6, 19.6, 18.7; MS (ESI) m/z (%): 345.9 (100, [M+H]+), 347.1 (24.9), 371.9 (5.1). Anal calcd for C22H20N2O2 C 76.72, H 5.85, N 8.13; found C 76.90, H 5.66, N 8.21.
1 mmol of each inorganic salt (NaNO2, NaOAc•3H2O, NaNO3, KClO3, NaF, KClO4, NaHCO3, NaCl, Na3PO4, KSCN, NaIO3, Na2HPO4•12H2O, KBr, NaHSO3, NaHSO4, KI, Na2S2O3•5H2O or NaClO) was dissolved in deionized water (10 mL) to afford 1×10⁻¹ mol/L aqueous solution. Stock solutions or generation of reactive oxygen species including hydrogen peroxide (H2O2), hydroxyl radical (•OH), tert-butyl hydroperoxide (TBHP), superoxide (
A solution of C1 or C2 (1×10⁻⁵ mol/L) was prepared in HEPES/DMSO (V:V=9:1, 10 mmol•L-1, pH=7.4). Then 3.0 mL of the solution of C1 or C2 was placed in a quartz cell (10.0 mm width) and the fluorescence spectrum was recorded. The NaClO solution was introduced in portions and fluorescence intensity changes were recorded at room temperature each time (excitation wavelength: 430 nm).
A solution of C2 (1×10⁻⁵ mol/L) was prepared in HEPES/DMSO (V:V=9:1, 10 mmol•L-1, pH=7.4). Then 3.0 mL of the solution of C2 was placed in a quartz cell (10.0 mm width) and the fluorescence spectrum was recorded. Different anions or ROS solutions were introduced and the changes of the fluorescence intensity were recorded at room temperature each time (excitation wavelength: 430 nm).
Quantum yield was determined according to the equation as follows:
HeLa cells were seeded to the 24-well plates, the cells with an initial density of 5×10⁴ cells•well-1 in 24-well plates were routinely maintained at 37 ℃ in a humidified 5% CO2 atmosphere using DMEM (Dulbecco's modified eagle's medium) supplemented with 10% fetal bovine serum and 1% penicillin-streptomycin for 24 h.
Fluorescence cell imaging was performed with an OLYMPUS IX73 scanning microscopy with an objective lens (40×). Fluorescence images of HeLa cells were monitored at 460~490 nm for green channel. The data were analyzed using software package provided by OLYMPUS instruments. Cell imaging was then carried out after washing cells with phosphate-buffered saline (PBS, 10 mmol• L-1, pH 7.02).
A solution of C2 (10-5 mol/L) was prepared in HEPES/ DMSO (V:V=9:1, 10 mmol/L, pH=7.4). Fluorescence intensity changes of probe C2 were recorded before and after the addition of different amount of tap water (excitation wavelength: 430 nm).
Supporting Information 1H NMR and 13C NMR spectra of compounds C0~C2, emission spectra of C0~C2 in different ratio of DMSO/H2O, the pH effect on the performance of C2, anti-interference test of C2, emission profile of C2 with different amount of tap water, ESI-mass of C2 and C2+NaClO. The Supporting Information is available free of charge via the Internet at http://sioc-journal.cn/.
(a) Sugiyama, S.; Kugiyama, K.; Aikawa, M.; Nakamura, S.; Ogawa, H.; Libby, P. Thromb. Vasc. Biol. 2004, 24, 1309.
(b) Pattison, D. I.; Davies, M. J. Chem. Res. Toxicol. 2001, 14, 1453.
(c) Steinbeck, M. J.; Nesti, L. J.; Sharkey, P. F.; Parvizi, J. J. Orthop. Res. 2007, 25, 1128.
(d) Aokl, T.; Munemorl, M. Anal. Chem. 1983, 55, 209.
(a) Cui, K.; Zhang, D. Q.; Zhang, G. X.; Zhu, D. B. Tetrahedron Lett. 2010, 51, 6052.
(b) Hwang, J.; Choi, M. G.; Bae, J.; Chang, S.-K. Org. Biomol. Chem. 2011, 9, 7011.
(c) Kim, T.-Ⅱ.; Park, S.; Choi, Y.; Kim, Y. Chem.-Asian J. 2011, 6, 1358.
(d) Li, G.; Ji, D. D.; Zhang, S. M.; Li, J. M.; Li, C.; Qiao, R. Z. Sens. Actuators, B 2017, 252, 127.
(e) Pang, L. F.; Zhou, Y. M.; Gao, W. L.; Song, H. H.; Wang, X.; Wang, Y. RSC Adv. 2016, 6, 105795.
(f) Zhang, P.; Wang, Y.; Chen, L.; Yin, Y. B. Microchim. Acta 2017, 184, 3781.
(a) Zhang, R.; Song, B.; Yuan, J. L. Trends Anal. Chem. 2018, 99, 1.
(b) Liu, C.; Jiao, X. J.; He, S.; Zhao, L. C.; Zeng, X. S. Talanta 2017, 174, 234.
(c) Liu, S. R.; Wu, S. P. Org. Lett. 2013, 15, 878.
(d) Manjare, S. T.; Kim, J.; Lee, Y.; Churchill, D. G. Org. Lett. 2014, 16, 520.
(e) Qu, Z. J.; Ding, J. X.; Zhao, M. Y.; Li, P. J. Photochem. Photobiol. A 2015, 299, 1.
(f) Zhang, Y. R.; Zhao, Z. M.; Miao, J. Y.; Zhao, B. X. Sens. Actuators, B 2016, 229, 408.
(g) Zhang, Z.; Zheng, Y.; Hang, W.; Yan, X.; Zhao, Y. Talanta 2011, 85, 779.
(h) Shi, L.; Yang S.; Hong, H. J.; Li, Y.; Yu, H. J.; Shao, G.; Zhang, K.; Gong, S. Z. Anal. Chim. Acta 2020, 1094, 122.
(i) Shi, L.; Yu, H. J.; Zeng, X. Q.; Yang, S.; Gong, S. Z.; Xiang, H.; Zhang K.; Shao G. New J. Chem. 2020, 44, 6232.
(j) Wei, H. Q.; Zeng, R. J.; Wang, S. L.; Zhang, C. H.; Chen, S.; Zhang, P. S.; Chen, J. Mater. Chem. Front. 2020, 4, 862.
(k) Ren, J. Y.; Zhang, P. S.; Liu, H.; Zhang, C. H.; Gao, Y.; Cui, J. X.; Chen, J. Sens. Actuators, B 2020, 304, 127299.
(l) Zhang, P. S.; Wang, H.; Zhang, D.; Zeng, X. Y.; Zeng, R. J.; Xiao, L. H.; Tao, H. W.; Long, Y. F.; Yi, P. G.; Chen, J. Sens. Actuators, B 2018, 255, 2223.
(m) Zhang, P. S.; Wang, H.; Hong, Y. X.; Yu, M. L.; Zeng, R. J.; Long, Y. F.; Chen, J. Biosens. Bioelectron. 2017, 99, 318.
(n) Huang, Y.; Zhang, P. S.; Gao, M.; Zeng, F.; Qin, A. J.; Wu, S. Z.; Tang, B. Z. Chem. Commun. 2016, 52, 7288.
(a) Wang, J.; Long, L.; Xie, D.; Song, X. Sens. Actuators, B 2013, 177, 27.
(b) Wang, L.; Li, W. X.; Zhi, W. J.; Ye, D. D.; Wang, Y.; Ni, L.; Bao, X. Dyes Pigm. 2017, 147, 357.
(c) Wang, J.; Hu, L. J.; Shen, J.; Jiang, J. Q.; Yu, K. Y., Sun, R. G. Chin. J. Org. Chem. 2018, 38, 760(in Chinese).
(王军, 虎良军, 申婧, 姜吉泉, 郁科勇, 孙荣国, 有机化学, 2018, 38, 760.)
(d) Dong, X. B.; Zhang, G. X.; Shi, J. B.; Wang, Y. C.; Wang, M.; Peng, Q.; Zhang, D. Q. Chem. Commun. 2017, 53, 11654.
(e) Acharyya, S.; Gharami, S.; Patra, L.; Mondal, T. K. J. Fluoresc. 2017, 27, 2051.
(f) Yang, T.; Guo, Z.; Shao, A.; Zhao, P.; Zhu, W. Chin. J. Appl. Chem. 2016, 33, 397(in Chinese).
(杨婷婷, 郭志前, 邵安东, 赵平, 朱为宏, 应用化学, 2016, 33, 397.)
(g) Hou, S. H.; Qu, Z. G.; Zhong, K. L.; Bian, Y. J.; Tang, L. J. Chin. J. Org. Chem. 2016, 36, 768(in Chinese).
(侯淑华, 曲忠国, 钟克利, 边延江, 汤立军, 有机化学, 2016, 36, 768.)
(h) Wang, W. L.; Yan, Y. L.; Wang, Q. M. Chem. Lett. 2017, 46, 1605.
(i) Prabhu, J.; Velmurugan, K.; Zhang, Q.; Radhakrishnan, S.; Tang, L. J.; Nandhakumar, R. J. Photochem. Photobiol. A 2017, 337, 6.
(j) Zhang, M.; Xiao, H. F.; Han, Z. X.; Yang, L. Q.; Wu, X. Y. Chin. J. Org. Chem. 2018, 38, 926(in Chinese).
(张敏, 肖慧丰, 韩志湘, 仰榴青, 吴向阳, 有机化学, 2018, 38, 926.)
(k) Liu, Z.; Peng, C. N.; Wang, Y.; Pei, M. S.; Zhang, G. Y. Org. Biomol. Chem. 2016, 14, 4260.
(l) Torawane, P.; Tayade, K.; Bothra, S.; Sahoo, S. K.; Singh, N.; Borse, A.; Kuwar, A. Sens. Actuators, B 2016, 222, 562.
(a) Luo, J.; Xie, Z.; Lam, J. W. Y.; Cheng, L.; Chen, H.; Qiu, C.; Kwok, H. S.; Zhan, X.; Liu, Y.; Zhu, D.; Tang, B. Z. Chem. Commun. 2001, 37, 1740.
(b) Chen, J. W.; Xie, Z. L.; Lam, J. W. Y.; Law, C. C. W.; Tang, B. Z. Macromolecules 2003, 36, 1108.
(c) Wei, B.; Li, W. Z.; Zhao, Z. J.; Qin, A. J.; Hu, R. R.; Tang, B. Z. J. Am. Chem. Soc. 2017, 139, 5075.
(d) Chen, J.; Law, C. C. W.; Lam, J. W. Y.; Dong, Y.; Lo, S. M. F.; Williams, I. D.; Zhu, D.; Tang, B. Z. Chem. Mater. 2003, 15, 1535.
(e) Zhao, Z.; Chen, S.; Lam, J. W. Y.; Jim, C. K. W.; Chan, C. Y. K.; Wang, Z.; Lu, P.; Deng, C.; Kwok, H.; Ma, Y.; Tang, B. Z. J. Phys. Chem. C 2010, 114, 7963.
Zeng, Q.; Li, Z.; Dong, Y. Q.; Di, C. A.; Qin, A. J.; Hong, Y. N.; Ji, L.; Zhu, Z. C.; Jim Cathy, K. W.; Yu, G.; Li, Q. Q.; Li, Z. A.; Liu, Y. Q.; Qin, J. G.; Tang, B. Z. Chem. Commun. 2007, 43, 70. http://www.ncbi.nlm.nih.gov/pubmed/17279264
Erdemir, S.; Kocyigit, O.; Karakurt, S. Sens. Actuat., B 2015, 220, 381. doi: 10.1016/j.snb.2015.05.103
Yuan, L.; Lin, W. Y.; Song, J. Z.; Yang, Y. T. Chem. Commun. 2011, 47, 12691. doi: 10.1039/c1cc15762k
Chen, G.; Song, F.; Wang, J.; Yang, Z.; Sun, S.; Fan, J.; Qiang, X.; Wang, X.; Dou B.; Peng, X. J. Chem. Commun. 2012, 48, 2949. doi: 10.1039/c2cc17617c
Williams, A. T. R.; Winfield, S. A.; Miller, J. N. Analyst 1983, 108, 1067. doi: 10.1039/an9830801067

Figure 1 Fluorescent emission spectra of C1 (10 µmol/L, in DMSO/H2O, V:V=1:9) in the presence of different concentrations of NaClO excited at 430 nm
Fom bottom to top: 0.0, 2.0, 4.0, 6.0, 8.0, 10.0, 12.0, 14.0, 16.0, 18.0 and 20.0 µmol/L ClO-. Inset: plot of fluorescent intensity at 510 nm of C1 as a function of the concentration of ClO-

Figure 2 Fluorescent emission spectra of C2 (10 µmol/L, in DMSO/H2O, V:V=1:9) in the presence of different concentrations of NaClO excited at 430 nm with that of C0 (10 µmol/L) for comparison
Black lines: from bottom to top: 0.0, 0.3, 0.5, 0.8, 1.2, 1.5, 2.0, 2.5, 3.0, 4.0, 5.0, 6.0, 7.0, 8.0, 9.0, 11.0, 13.0, 16.0 and 18.0 µmol/L ClO-; red line: 10 µmol/L C0. Inset: Plot of fluorescent intensity at 510 nm of C2 as a function of ClO- concentration; fluorescent photograph of C2 and C2+NaClO

Figure 3 Emission intensity of C2 (10 µmol/L, in DMSO/H2O, V:V=1:9) in the presence of different anions (ClO-, 20 µmol/L; ROS, 60 µmol/L; other anions, 100 µmol/L)
Inset: fluorescent photograph of C2 to various anions. A~X: blank,

Figure 4 Fluorescence (a and c) and brightfield images (b and d) of cells
(a and b) image of cells incubated with C2 (20 μmol/L) for 20 min; (c and d) fluorescence image of cells pre-treated with C2 (20 μmol/L) for 20 min and then incubated with ClO- (50 μmol/L) for 20 min. Scale bar: 20 μm

Figure 5 1H NMR spectra of C2 (a), the isolated resultant compound C2-ClO- (b) with that of C0 (c) for comparison in DMSO-d6

 扫一扫看文章

扫一扫关注我们
 下载:
下载:

 下载:
下载:

