
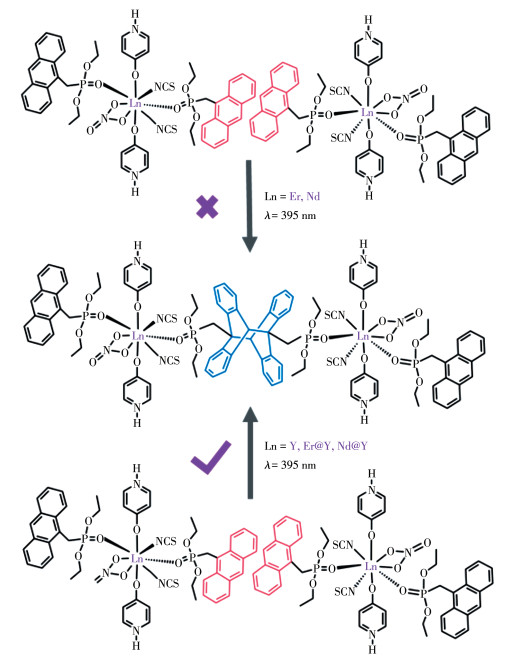
Scheme 1.
Photocycloaddition of anthracene groups occurs in 3Y, 1Er@Y and 2Nd@Y, but not in pure 1Er and 2Nd


Light-responsive single molecule magnets (SMMs) have been a major research hotspot in the field of molecular magnets in the past few decades, which have broad research and application prospects[1-6]. Lanthanide-based SMMs are appealing candidates for high-performance SMMs owing to their significant single-ion magnetic anisotropy arising from strong spin-orbit coupling and crystal-field effects[7-9]. However, due to the difference in the number of 4fn electrons and thus the magnetic anisotropies, different lanthanide complexes exhibit distinct SMM behaviours in the same ligand field[10-12]. Not only that, the characteristic luminescence of lanthanide complexes is also highly dependent on specific lanthanide ions[13-14]. Generally, direct excitation of LnⅢ ions is not efficient as a result of the parity-forbidden f-f transitions and low molar absorptivity. Therefore, it is necessary to sensitize the lanthanide ions through the antenna ligands, and the sensitization efficiency is very much related to the energy gap between the ligand 3T state and the emissive excited state of LnⅢ [15].
We have been interested in dysprosium-anthracene complexes showing light-responsive magnetic and luminescent properties due to the photocycloaddition reaction of the face-to-face π-π interacted anthracene pairs[16-17]. A typical example is [DyⅢ(SCN)2(NO3) (depma)2(4-hpy)2] (1Dy)[18], where depma stands for 9-diethylphosphono methylanthracene and 4-hpy is 4-hydroxypyridine, which has the highest effective energy barrier (Ueff=277 K) among the known photo-responsive Ln-SMMs. 1Dy shows a rapid photo-induced structural transformation to form compound [DyⅢ(SCN)2(NO3)(depma2)(4-hpy)2]n (2Dy) with chain structure, accompanied by changes in SMM and luminescent properties. Since the photocycloaddition of anthracene involves the formation of an excimer in which one anthracene in the excited singlet state is π-π interacted with another in the ground state, we envision that when energy transfer between the excimer and the lanthanide ion is effective, the process is interfered with by ions of different lanthanide elements. Another question then arises: is it possible to modulate with light the SMM and luminescent properties of lanthanide-anthracene complexes that are unable to undergo a photocycloaddition reaction?
In this paper, we report three new complexes, [LnⅢ(SCN)2(NO3)(depma)2(4-hpy)2] [Ln=Er (1Er), Nd (2Nd), Y (3Y)] that are isomorphic to 1Dy. NdⅢ or ErⅢ ions were chosen because their complexes may exhibit interesting SMM behaviour depending on the specific coordination environment[19-22]. Meanwhile, it has been found that energy transfer between anthracene and NdⅢ or ErⅢ ions is efficient, resulting in the near-infrared (NIR) emission from metal ions[23-24]. Indeed, 1Er and 2Nd exhibit field-induced SMM behavior and NIR luminescence but fail to undergo photocycloaddition reaction under 395 nm UV light irradiation. In contrast, the diamagnetic complex 3Y can undergo photocycloaddition (Scheme 1). Interestingly, by doping ErⅢ or NdⅢ ions in the 3Y lattice, we obtained diluted samples Ln0.1Y0.9(SCN)2(NO3)(depma)2(4-hpy)2 (Ln=Er (1Er@Y), Nd (2Nd@Y)), which not only can undergo photocycloaddition but also are accompanied by changes in magnetic and optical properties.
The 9-diethyl-phosphonomethylanthracene (depma) was synthesized according to the literature[25]. All other starting materials were obtained from commercial sources without any purification. PE 240C analyzer was used to do the elemental analyses for C, H and N. The metal content in the doped samples was determined by inductively coupled plasma atomic emission spectrometer (ICP-AES, Avio500). The infrared spectra were collected on a Bruker Tensor 27 spectrometer in 4 000-400 cm-1 region in pressed KBr pellets. Thermogravimetric analysis was recorded on a Mettler-Toledo TGA STARe thermal analyzer in the range of 30-600 ℃ under a nitrogen flow at a heating rate of 5 ℃·min-1. The instrument to collect powder X-ray diffraction (PXRD) data was Bruker D8 advance diffractometer with Cu Kα radiation (λ=0.154 06 nm, U=40 mV, I=40 mA) in a range of 5°-50° at room temperature. The 1H NMR spectra were recorded on a BRUKER AVANCE Ⅲ 400 MHz spectrometer with samples dissolved in DMSO-d6. The steady fluorescence spectra were attained at Bruker Spectrofluorimeter LS55. Time- resolved fluorescent decays were carried out on a Fluorolog TCSPC spectrofluorometer (Horiba Scientific) equipped with laser exciting at 365 nm. The dc (direct current) and ac (alternating current) magnetic susceptibility data were obtained using polycrystalline samples by a Quantum Design MPMS SQUID VSM magnetometer.
46.1 mg (0.1 mmol) Er(NO3)3·6H2O and 19.4 mg (0.2 mmol) KSCN were added to 2 mL CH3CN solution and stirred for 30 min at room temperature. The white precipitate was removed by filtration. Then 19.0 mg (0.2 mmol) 4-hpy and 3 mL CH3CN solution of 65.6 mg (0.2 mmol) depma were added and stirred for about 15 min, and the yellow precipitate was filtered. The clear yellow filtrate was left to evaporate slowly, and block yellow crystals were precipitated after 2 d. Yield: 44.4%. Elemental Anal. Calcd. for C50H52ErN5O11P2S2(%): C, 50.37; H, 4.40; N, 5.87. Found (%): C, 50.54; H, 4.58; N, 5.79.
Compound 2Nd was prepared by adopting an analogous method to 1Er except for the replacement of Er(NO3)3·6H2O with Nd(NO3)3·6H2O (34.8 mg, 0.1 mmol). Yield: 42.5%. Elemental Anal. Calcd. for C50H52NdN5O11P2S2(%): C, 51.36; H, 4.48; N, 5.99. Found(%): C, 51.69; H, 4.37; N, 6.07.
Compound 3Y was prepared by adopting an analogous method to 1Er except for the replacement of Nd(NO3)3·6H2O with Y(NO3)3·6H2O (38.3 mg, 0.1 mmol). Yield: 51.4%. Elemental Anal. Calcd. for C50H52YN5O11P2S2(%): C, 53.91; H, 4.71; N, 6.29. Found(%): C, 53.43; H, 4.54; N, 6.40.
The synthesis of the doped 1Er@Y complex was performed following a similar procedure to 1Er except that a mixture of Er(NO3)3·6H2O (0.01 mmol) and Y(NO3)3·6H2O (0.09 mmol) took the place of pure Er(NO3)3·6H2O. The erbium content in the final crystalline product was 8.55% determined by ICP-AES. Elemental Anal. Calcd. for C50H52Er0.1Y0.9N5O11P2S2(%): C, 53.54; H, 4.67; N, 6.24. Found(%): C, 53.18; H, 4.84; N, 6.39.
The synthetic procedure of 1Nd@Y was similar to 1Er@Y except that Er(NO3)3·6H2O was replaced by Nd(NO3)3·6H2O. The neodymium content in the final crystalline product was 8.47% determined by ICP-AES. Elemental Anal. Calcd. for C50H52Nd0.1Y0.9N5 O11P2S2 (%): C, 53.65; H, 4.68; N, 6.26. Found(%): C, 53.37; H, 4.34; N, 6.44.
Suitable single crystals were selected and mounted on a glass rod for X-ray measurements. Single crystals were used for data collections on a Bruker D8 Venture diffractometer using graphite-monochromated Mo Kα radiation (λ=0.071 073 nm). The data were integrated using the Siemens SAINT program[26], with the intensities corrected for Lorentz factor, polarization, air absorption, and absorption due to variation in the path length through the detector faceplate. Empirical absorption corrections were applied using the SADABS program[27]. The structures were solved by direct method and refined on F 2 by full-matrix least squares using Olex2[28]. All the non-hydrogen atoms were refined anisotropically. All hydrogen atoms were either put in calculated positions or found from the difference Fourier maps and refined isotropically. Details of the crystal data and refinements are summarized in Table S1 (Supporting information). Selected bond lengths and angles are given in Table S2.
Single crystal X-ray diffraction analyses revealed that 1Er-3Y are isomorphic (Table S1). The purity of these phases was confirmed by PXRD and IR measurements (Fig.S1 and S2). So, 1Er is selected as a representative for a detailed structure description. Compound 1Er crystallizes in the monoclinic system with the P21/m space group. As shown in Fig. 1, the asymmetric unit contains one ErⅢ ion, two SCN- ion, one NO3- ion, two depma ligands and two 4-hpy molecules. Each ErⅢ is eight-coordinated by two oxygen atoms (O1, O4) from two depma ligands, two oxygen atoms (O9 and O10) from NO3-, two axial oxygen atoms (O7 and O8) from another two 4-hpy ligands and two nitrogen atoms (N1 and N2) from two SCN- ions. The 4-hpy is a neutral zwitterionic ligand with a protonated pyridine N atom and a formally negative O atom. Two 4-hpy ligands occupy the axial positions providing the axial Er—O bond lengths of 0.221 4(3) and 0.223 2(3) nm which are shorter than the other Er—O(N) bonds (0.228 7(3)-0.256 6(3) nm). The axial O—Er—O angle is 163.54(13)° (Table S2). According to the continuous shape analysis[29], the [ErO6N2] polyhedron is mostly close to a geometry of snub diphenoid J84 in D2d symmetry (CShM=1.807, Table S3).
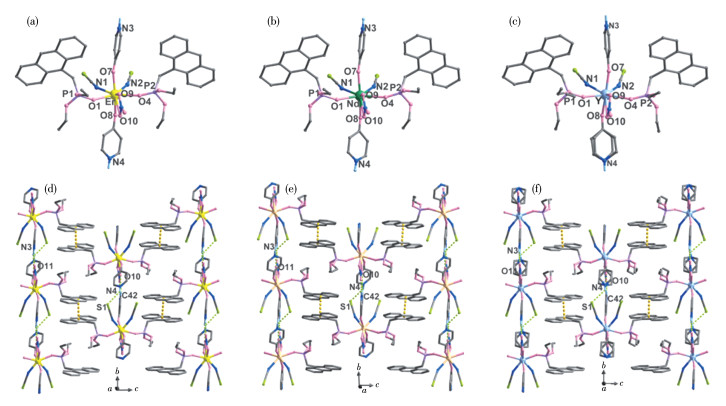
As shown in Fig. 1d, the adjacent monomers are connected along the b-axis with hydrogen bond interactions between the coordinated NO3- or SCN- anions and the 4-hpy through N4—H4…S1, N3—H3…O11, N4—H4…O11 and C42—H42…O10 contacts (Table S4), forming a one-dimensional (1D) supramolecular chain. The chains are stacked and further stabilized by face- to-face π-π interaction between anthracene moieties in 1Er (center-to-center(dcc): 0.378 0 nm and nearest C2—C9′ (dC—C) distances: 0.379 0 nm). The dcc is much smaller than the limiting distance of Schmidt′s rule (0.42 nm) for solid-phase photodimerization to occur, so it is possible that anthracene-based photodimerization may occur in 1Er.
Compounds 2Nd and 3Y are isostructural to 1Er except for the slight difference in their unit cell volumes. The cell volume of 2Nd (2.556 7 nm3) is much larger than that of 1Er (2.508 5 nm3) and 3Y (2.520 5 nm3), attributed to the increased ionic radii of NdⅢ compared to ErⅢ and YⅢ. As a result, the axial Nd—O (0.231 6(6), 0.233 7(6) nm) and equatorial Nd—O(N) (0.240 7(6)-0.263 6(6) nm) bond lengths are slightly longer than the corresponding Er—O(N) and Y—O(N) distances (Y—Oaxial: 0.221 1(7), 0.223 1(8) nm; Y— O(N)equatorial: 0.230 2(9)-0.255 7(8) nm) (Table S2). It is worth mentioning that the R1 and wR2 values are much higher for 3Y due to the poor single-crystal quality. We have tried several times to select new crystals for structural analysis and the result was not improved.
The UV-Vis absorption spectra, translated from the diffuse reflectance spectra using the Kubelka-Munk equation F(R)=(1-R)2/(2R), were recorded in the range of 200-800 nm in the solid state at room temperature (Fig.S4). All showed strong and broad absorption bands between 200-450 nm, corresponding to the π→π* transition of the anthracene ligand. The f-f transitions of LnⅢ were also observed for 1Er, 2Nd and their diluted samples. For 1Er, the peaks at 487, 520, 544 and 651 nm are assigned to the f-f transitions of ErⅢ from 4I15/2 to 4F7/2, 2H11/2 (2G11/2), 4S3/2 and 4F9/2. For 2Nd, the peaks at 511, 525, 582 and 736 nm are ascribed to the f-f transitions of NdⅢ from 4I9/2 to 4G9/2, 4G7/2, 2G7/2 (2G5/2) and 4F7/2[30]. The diluted samples 1Er@Y and 2Nd@Y displayed similar spectra to 1Er and 2Nd, respectively, except that the peak intensities of the f-f transitions were much weaker.
The photoluminescence (PL) properties of these compounds were further investigated in the solid state at room temperature. As shown in Fig. 2a, the PL spectrum of depma exhibited a broad band peaking at 500 nm, attributed to the excimer formation[31]. The broad band was also observed in 3Y but the peak was red-shifted to 548 nm with a lifetime of 57.8 ns, attributed to the excimer formation of face-to-face π-π stacking of the anthracene groups. The quantum yield was 7.48%. Interestingly, the luminescence of 1Er and 2Nd was extremely weak in the range of 400-700 nm and was invisible to the naked eye, unlike their Dy and Y analogues. This is also supported by the undetectable emission life-time and low quantum yields in the visible region (0.43% for 1Er and 0.76% for 2Nd). The result indicates that an efficient energy transfer from the ligand to the lanthanide ion may occur in the cases of 1Er and 2Nd.
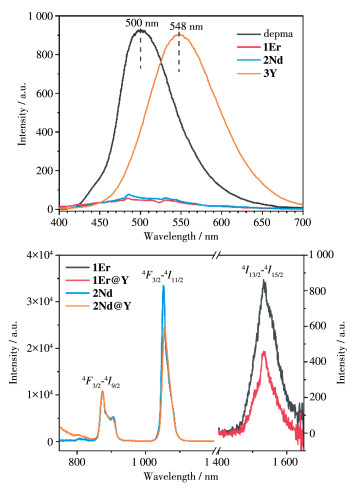
Noting that the maximum emission peak of the excimer in 3Y was 548 nm (18 248 cm-1), which was close to the excited states of NdⅢ ions (2H11/2 and 4F9/2) and ErⅢ ions (4F9/2)[15], we expected a favorable intramolecular energy transfer from the excimer of anthracene pairs to ErⅢ or NdⅢ, thus sensitizing the luminescence of the lanthanide ions in 1Er and 2Nd. Indeed, upon excitation at 365 nm, 1Er emitted NIR emission at 1 530 nm, assigned to the 4I13/2→4I15/2 transition of ErⅢ, while 2Nd emitted NIR luminescence at 860 and 1 054 nm, assigned to the 4F3/2→4I9/2 and 4F3/2→4I11/2 transitions of NdⅢ, respectively[32-35] (Fig. 2b).
To investigate whether the photocycloaddition reaction occurs in complexes 1Er, 2Nd, and 3Y, we irradiated the samples under 395 nm UV light for 30 min. For 1Er and 2Nd, their PL and IR spectra and PXRD patterns showed no significant difference before and after light irradiation (Fig.S6-S8), indicating that the photochemical reaction did not occur. This is in accordance with the fact that an efficient energy transfer from the anthracene ligand to ErⅢ or NdⅢ ion is present in these complexes, leading to the quenching of the cycloaddition reaction. By contrast, 3Y showed a continuous decline of the PL peak intensity at 547 nm upon 365 nm light irradiation, concomitant with the emergence and increase of new peaks at 422, 445 and 485 nm (Fig.S7). These new peaks are assigned to the π*→π transitions of the di-anthracene units. After 30 min of irradiation, the PL profile of 3Y did not change. Obviously, the face-to-face π-π stacked anthracene groups in 3Y underwent photocycloaddition to form a new phase [Y(SCN)2(NO3)(depma2)(4-hpy)2]n (3Y-UV), like the Dy analogue[18]. The formation of dianthracene in 3Y-UV was supported by IR spectra, which showed a new peak at 687 cm-1 characteristic of C—H vibration of dianthracene. Meanwhile the peak at 1 240 cm-1 characteristic of C—H bending vibration of anthracene was almost disappeared (Fig.S8). The PXRD measurements suggest that 3Y-UV is isostructural to 2Dy but the structural transformation is incomplete (Fig.S9).
To examine the completeness of the photocycloaddition reaction, we measured the 1H NMR spectra of 3Y and 3Y-UV in DMSO-d6 solution. Compared with 3Y, compound 3Y-UV showed three additional signals with lower chemical shifts at 6.7-7.3 in addition to the four signals at 7.5-8.6 (Fig.S10). The latter are assigned to the hydrogen atoms of the anthracene unit, while the former belong to the hydrogen atoms of the dianthracene unit. The photochemical reaction yield can be calculated according to the integral areas of the two sets of signals. For 3Y-UV, the photocycloaddition reaction has a yield of 86.1%.
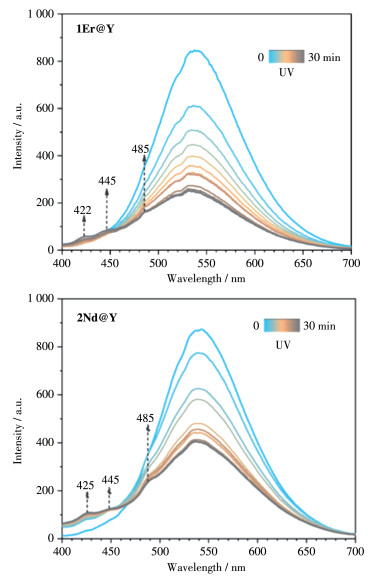
Interestingly, the diluted samples 1Er@Y and 2Nd@Y can also undergo photocycloaddition reaction under UV light irradiation. Fig. 3 shows the PL spectra of 1Er@Y and 2Nd@Y upon 395 nm light irradiation as a function of time. In both cases, the peak intensity at 547 nm decreased with increasing irradiation time and new peaks corresponding to dianthracene emerged at 422, 445 and 485 nm. The IR spectra showed a monotonous decreasing of the peak intensity at 1 240 cm-1 and an increase of the peak intensity at 687 cm-1 (Fig.S11), confirming the formation of photodimerized products. Samples obtained after 395 nm UV light irradiation of 1Er@Y and 2Nd@Y (20 mg) for 24 h were used for further measurements, named as 1Er@Y-UV and 2Nd@Y-UV. By comparing their PXRD patterns with that of 2Dy, it is clear that 1Er@Y-UV and 2Nd@Y-UV contain unreacted 1Er@Y and 2Nd@Y, respectively (Fig.S12), implying that the photodimerization reaction of the diluted samples was incomplete. The yields were 62.4% for 1Er@Y and 64.0% for 2Nd@Y based on the measurements of 1H NMR spectra (Fig.S10).
The temperature dependence of magnetic susceptibility was carried out under 1 000 Oe dc field in the temperature range of 2-300 K. The χMT value at 300 K for 1Er and 2Nd were 11.43, 1.47 cm3·K·mol-1, respectively, consistent with the theoretical values of 11.48 cm3·K·mol-1 for ErⅢ (3H4, S=1, L=5, g=4/5), and 1.64 cm3·K·mol-1 for NdⅢ (4I9/2, S=3/2, L=6, g=8/11). On cooling, the χMT value for 1Er decreased gradually in the range of 300-100 K, and then rapidly reached the minimum value of 5.01 cm3·K·mol-1 at 2 K (Fig. 4). This tendency can be attributed the progressive depopulation of the MJ levels of ErⅢ and/or low-lying excited states. For 2Nd, the χMT value upon cooling remained almost constant down to 1.8 K. The field dependence of magnetization at 2 K reveals that the magnetizations at 70 kOe were 5.27Nβ for 1Er, which were obviously lower than the theoretical saturation values of 9Nβ (Fig.S13a), suggesting the presence of magnetic anisotropy. For 2Nd, isothermal magnetization curves at 2 K exhibited values of 1.23Nβ at 70 kOe, which was close to the expected value of 1.27Nβ for one NdⅢ ion (Fig.S13b).
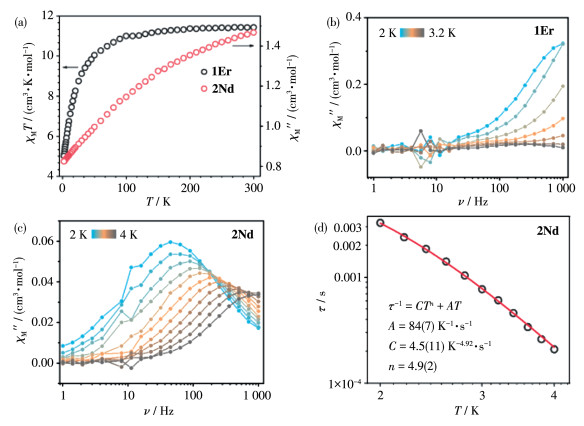
To probe the slow magnetization relaxation dynamics, ac magnetic susceptibilities were measured for 1Er and 2Nd. There were no out-of-phase (χ″) signals at 2 K for both compounds under zero dc field (Fig.S14), which can be attributed to the fast zero-field quantum tunneling of magnetization (QTM)[36-38]. Since the QTM effect can be suppressed by applying an external dc field, ac magnetic data for both compounds were performed under an optimum dc field. For 1Er, the χ″ ac susceptibility data exhibited the frequency dependence below 3.2 K under an optimum field of 500 Oe, but no maximum appeared even the frequency reached 1 000 Hz, implying a faster relaxation process in 1Er (Fig. 4b and S15).
For 2Nd, both the χ′ and χ″ signals showed obvious frequency and temperature dependence under an optimal 1 kOe dc field (Fig. 4c and S15), suggesting a field-induced slow relaxation of magnetization. The Cole-Cole plots can be fitted by the generalized Debye model[39] to extract the relaxation time (τ) (Fig.S16a). The distribution coefficient (α) values fall in the range of 0.23~0.30 (Table S5). We first attempted to fit the relaxation times by Direct and Orbach processes using Eq.(1), obtaining the parameters Ueff=18.6(6) K, τ0= 2.3(4)×10-6 s, A=142(6) K-1·s-1 for 2Nd (Fig.S16b). However, the small Ueff and large τ0 values suggest that other relaxation pathways were dominant.
|
|
(1) |
An almost linear dependency was observed when the τ vs T was plotted in a log-log scale (Fig. 4d), indicating that dominant relaxation mechanism may be a direct or Raman process. The fitting was fairly well by using the combination of Raman and direct process using Eq.2, giving parameters of C=4.5(11) K-4.9·s-1, n=4.9(2).
|
|
(2) |
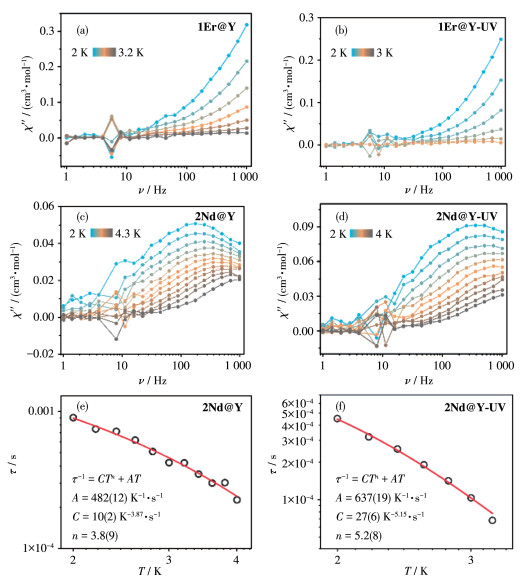
To study the photo-controllable magnetic behaviour, the powdered samples 1Er@Y and 2Nd@Y and corresponding photoreaction products 1Er@Y-UV and 2Nd@Y-UV were used to measure the dc and ac susceptibilities in detail. The dc magnetic behaviours of 1Er@Y and 1Er@Y-UV were similar to those for 1Er (Fig.S17 and S18). Slow magnetization relaxation was also found for 1Er@Y and 1Er@Y-UV under 500 Oe dc field and had a slight difference between them (Fig. 5 and S19). In addition, 2Nd@Y and 2Nd@Y-UV also showed similar behaviour to 2Nd (Figs. 5 and S20, Tables S6 and S7). The ac data can also be fitted by Eq.2, giving the parameters n=3.8(9), and C=10(2) K-3.8·s-1 for 2Nd@Y and n=5.2(8), and C=27(6) K-5.15·s-1 for 2Nd@Y-UV. Compared to 2Nd@Y, the n value of the Raman process for 2Nd@Y-UV is increased, attributed to the significant change in the photon structure[40], which is reasonable owing to the formation of partial coordination polymer in 2Nd@Y-UV after photocycloaddition[41-42].

 下载:
导出CSV
下载:
导出CSV
| Compound | χMT / (cm3·mol-1·K) | M / μB (70 kOe) | C / (K-n·s-1) | n | A / (K-1·s-1) |
| 1Er | 11.43 (300 K), 5.02(2 K) | 5.34 | |||
| 1Er@Y | 10.98 (300 K), 5.60 (2 K) | 4.61 | |||
| 1Er@Y-UV | 11.12 (300 K), 5.53 (2 K) | 4.49 | |||
| 2Nd | 1.47 (300 K), 0.82 (2 K) | 1.23 | 4.5(11) | 4.9(2) | 84(7) |
| 2Nd@Y | 1.53 (300 K), 1.10 (2 K) | 1.09 | 10(2) | 3.8(9) | 482(12) |
| 2Nd@Y-UV | 1.54 (300 K), 36.60 (2 K) | 1.01 | 27(6) | 5.2(8) | 637(19) |
In summary, we have synthesized three isostructural lanthanide complexes with formulae Ln(SCN)2(NO3)(depma)2(4-hpy)2 (Ln=Er (1Er), Nd (2Nd), Y (3Y)). 1Er and 2Nd show a field-induced slow relaxation of the magnetization and near-infrared (NIR) luminescence but fail to undergo photocycloaddition reaction under 395 nm UV light irradiation. In contrast, the diamagnetic complex 3Y shows excimer emission and can undergo photocycloaddition. By doping ErⅢ or NdⅢ into the 3Y lattice, we obtained Ln0.1Y0.9(SCN)2(NO3)(depma)2(4-hpy)2 (Ln=Er (1Er@Y), Nd (2Nd@Y)), which not only can undergo partial photocycloaddition but also are accompanied by changes in magnetic and optical properties. Further work is in progress to explore new lanthanide systems with tunable magneto-optical properties.
Aguilà D, Prado Y, Koumousi E S, Mathonière C, Clérac R. Switchable Fe/Co Prussian blue networks and molecular analogues[J]. Chem. Soc. Rev., 2016, 45(1): 203-224. doi: 10.1039/C5CS00321K
Shiga T, Miyasaka H, Yamashita M, Morimoto , Irie M. Copper(Ⅱ)-terbium(Ⅲ)single-molecule magnets linked by photochromic ligands[J]. Dalton Trans., 2011, 40(10): 2275-2282. doi: 10.1039/c0dt01119c
Hojorat M, Sabea H. A, Norel L, Bernot K, Roisnel T, Gendron F, Guennic B. L, Trzop E, Collet E, Long J R, Rigaut S. Hysteresis photomodulation via single-crystal-to-single-crystal isomerization of a photochromic chain of dysprosium single-molecule magnets[J]. J. Am. Chem. Soc., 2020, 142(2): 931-936. doi: 10.1021/jacs.9b10584
Huang X D, Xu Y, Fan K, Bao S S, Kurmoo M, Zheng L M. Reversible SC-SC transformation involving[4+4]cycloaddition of anthracene: a single-ion to single-molecule magnet and yellow-green to blue-white emission[J]. Angew. Chem. -Int. Ed., 2018, 57(28): 8577-8581. doi: 10.1002/anie.201804102
Zou Q, Wang G L, Chen Y Q, Huang X D, Wen G H, Qin M F, Bao S S, Zhang Y Q, Zheng L M. X-ray triggered coordination-bond breakage in dysprosium-organic framework and its impact on magnetic properties[J]. Chem. Eur. J., 2023, 29: e202203454. doi: 10.1002/chem.202203454
Ma X F, Huang X D, Wen G H, Bao S S, Zhang Y Q, Zheng L M. Polymorphism modulates photoluminescence and magnetic dynamics of mononuclear dysprosium-anthracene complexes[J]. Dalton Trans., 2022, 51(32): 12026-12030. doi: 10.1039/D2DT01710E
Woodruff D N, Winpenny R E P, Layfield R A. Lanthanide single-molecule magnets[J]. Chem. Rev., 2013, 113(7): 5110-5148. doi: 10.1021/cr400018q
Guo F S, Bar A K, Layfield R A. Main group chemistry at the interface with molecular magnetism[J]. Chem. Rev., 2019, 119(14): 8479-8505. doi: 10.1021/acs.chemrev.9b00103
Zabala-Lekuona A, Seco J M, Colacio E. Single-molecule magnets: From Mn12-ac to dysprosium metallocenes, a travel in time[J]. Coord. Chem. Rev., 2021, 441(15): 213984.
Liu J L, Chen Y C, Tong M L. Symmetry strategies for high performance lanthanide-based single-molecule magnets[J]. Chem. Soc. Rev., 2018, 47(7): 2431-2453. doi: 10.1039/C7CS00266A
Liu K, Zhang X, Meng X, Shi W, Cheng P, Powell A K. Constraining the coordination geometries of lanthanide centers and magnetic building blocks in frameworks: a new strategy for molecular nanomagnets[J]. Chem. Soc. Rev., 2016, 45(9): 2423-2439. doi: 10.1039/C5CS00770D
Rinehart J D, Long J R. Exploiting single-ion anisotropy in the design of f-element single-molecule magnets[J]. Chem. Sci., 2011, 2(11): 2078. doi: 10.1039/c1sc00513h
Bünzli, Piguet. C. Taking advantage of luminescent lanthanide ions[J]. Chem. Soc. Rev., 2005, 34(12): 1048-1077. doi: 10.1039/b406082m
Cui Y J, Yue Y F, Qian G D, Chen B L. Luminescent functional metal-organic frameworks[J]. Chem. Rev., 2012, 112(2): 1126-1162. doi: 10.1021/cr200101d
Eliseevaa S V, Bünzli J C G. Lanthanide luminescence for functional materials and bio-sciences[J]. Chem. Soc. Rev., 2010, 39(1): 189-227. doi: 10.1039/B905604C
Huang X D, Wen G H, Bao S S, Jia J G, Zheng L M. Thermo-and light-triggered reversible interconversion of dysprosium-anthracene complex and their responsive optical, magnetic and dielectric properties[J]. Chem. Sci., 2021, 12: 929-937. doi: 10.1039/D0SC04851H
Huang X D, Jia J G, Kurmoo M, Bao S S, Zheng L M. Interplay of anthracene luminescence and dysprosium magnetism by steric control of photodimerization[J]. Dalton Trans., 2019, 48(36): 13769-1377. doi: 10.1039/C9DT02854D
Huang X D, Ma X F, Zheng L M. Photo-responsive single-molecule magnet showing 0D to 1D single-crystal-to-single-crystal structural transition and hysteresis modulation[J]. Angew. Chem. Int. Ed., 2023, 62(15): e202300088. doi: 10.1002/anie.202300088
Borah A, Murugavel R. Magnetic relaxation in single-ion magnets formed by less-studied lanthanide ions Ce(Ⅲ), Nd(Ⅲ), Gd(Ⅲ), Ho(Ⅲ), Tm(Ⅱ/Ⅲ) and Yb(Ⅲ)[J]. Coord. Chem. Rev., 2022, 45: 214288.
Jiang S D, Wang B W, Sun H L, Wang Z M, Gao S. An organometallic single-ion magnet[J]. J. Am. Chem. Soc., 2011, 133: 4730-4733. doi: 10.1021/ja200198v
Jankowski R, Zakrzewski J J, Zychowicz M, Wang J H, Oki Y, Ohkoshi S, Chorazy S, Sieklucka B. SHG-active NIR-emissive molecular nanomagnets generated in layered neodymium(Ⅲ)-octacyanidometallate(Ⅳ)frameworks[J]. J. Mater. Chem. C, 2021, 9(33): 10705-10717. doi: 10.1039/D1TC00825K
Chen H H, Sun L, Zheng K T, Zhang J P, Ma P T, Wang J P, Niu J Y. Oxalate-bridging NdⅢ-based arsenotungstate with multifunctional NIR-luminescence and magnetic properties[J]. Dalton Trans., 2022, 51(26): 10257-10265. doi: 10.1039/D2DT01066F
Qu Y P, Huang X D, Xu K, Bao S S, Zheng L M. Octahedral lanthanide clusters containing a central PO43- anion: Structures, luminescent, magnetic and relaxometric properties[J]. Dalton Trans., 2023, 52: 10489-10498. doi: 10.1039/D3DT01542D
Koehne I, Lik A, Gerstel M, Bruhn C, Reithmaier J P, Benyoucef M, Pietschnig R. Functionalised phosphonate ester supported lanthanide (Ln=La, Nd, Dy, Er) complexes[J]. Dalton Trans., 2020, 49: 16683-16692. doi: 10.1039/D0DT03047C
Cao D K, Gu Y W, Feng J Q, Cai Z S, Wa rd, M D. Mononuclear lanthanide complexes incorporating an anthracene group: Structural modification, slow magnetic relaxation and multicomponent fluorescence emissions in Dy compounds[J]. Dalton Trans., 2013, 42(32): 11436-11444. doi: 10.1039/c3dt51176f
SAINT, Program for data extraction and reduction. Siemens analytical X-ray instruments, 1994-1996.
Krause L, Herbst-Irmer R, Sheldrick G M, Stalke D. Comparison of silver and molybdenum microfocus X-ray sources for single-crystal structure determination[J]. J. Appl. Cryst., 2015, 48: 3-10. doi: 10.1107/S1600576714022985
Dolomanov O V, Bourhis L J, Gildea R J, Howard J A K, Puschmann H. OLEX2: A complete structure solution, refinement and analysis program[J]. J. Appl. Cryst., 2009, 42: 339-341. doi: 10.1107/S0021889808042726
Casanova D, Llunell M, Alemany P, Alvarez S. The rich stereochemistry of eight-vertex polyhedra: A continuous shape measures study[J]. Chem. -Eur. J., 2005, 11(5): 1479-1494. doi: 10.1002/chem.200400799
Yatsimirskii K B, Davidenko N K. Absorption spectra and structure of lanthanide coordination compounds in solution[J]. Coord. Chem. Rev., 1979, 27: 223-273. doi: 10.1016/S0010-8545(00)82068-8
Huang X D, Kurmoo M, Bao S S, Fan K, Yan X, Zhao B H, Zheng L M. Coupling photo-, mechano-and thermochromism and single-ion-magnetism of two mononuclear dysprosium-anthracene phosphonate complexes[J]. Chem. Commun., 2018, 54(26): 3278-3281. doi: 10.1039/C8CC00220G
Nguyen T N, Chow C Y, Eliseeva S V, Trivedi E R, Kampf J W, Martinić I, Petoud S, Pecoraro V L. One-step assembly of visible and near-infrared emitting metallacrown dimers using a bifunctional linker[J]. Chem. -Eur. J., 2018, 24(5): 1031-1035. doi: 10.1002/chem.201703911
Marin R, Brunet G, Murugesu M. Shining new light on multifunctional lanthanide single-molecule magnets[J]. Angew. Chem. Int. Ed., 2021, 60(4): 1728-1746. doi: 10.1002/anie.201910299
Sun G B, Huang X D, Shang T, Yan S, Bao S S, Lu X M, Zhang Y Q, Zheng L M. Polar lanthanide anthracene complexes exhibiting magnetic, luminescent and dielectric properties[J]. Eur. J. Inorg. Chem., 2021, : 4207-4215.
Zou Q, Liu J C, Huang X D, Bao S S, Zheng L M. Thermo-induced structural transformation with synergistic optical and magnetic changes in ytterbium and erbium complexes[J]. Chin. Chem. Lett., 2021, 3: 1519-1522.
Gatteschi D, Sessoli R. Quantum tunneling of magnetization and related phenomena in molecular materials[J]. Angew. Chem., Int. Ed., 2003, 42(3): 268-297. doi: 10.1002/anie.200390099
Zeng D, Ren M, Bao S S, Cai Z S, Xu C, Zheng L M. Polymorphic lanthanide phosphonates showing distinct magnetic behavior[J]. Inorg. Chem., 2016, 55(11): 5297-5304. doi: 10.1021/acs.inorgchem.6b00280
Ma X F, Zeng D, Xu C, Bao S S, Zheng L M. Layered lanthanide phosphonates Ln (2-qpH)(SO4)(H2O)2(Ln=La, Ce, Pr, Nd, Sm): Polymorphism and magnetic properties[J]. Dalton Trans., 2023, 52(34): 11913-11921. doi: 10.1039/D3DT01698F
Cole K S, Cole R H. Dispersion and absorption in dielectrics I. Alternating current characteristics[J]. J. Chem. Phys., 1941, 9(4): 341-351. doi: 10.1063/1.1750906
Briganti M, Santanni F, Tesi L, Totti F, Sessoli R, Lunghi A. A complete ab initio view of Orbach and Raman spin-lattice relaxation in a dysprosium coordination compound[J]. J. Am. Chem. Soc., 2021, 143: 13633-13645. doi: 10.1021/jacs.1c05068
Huang X D, Ma X F, Shang T, Zhang Y Q, Zheng L M. Photocontrollable magnetism and photoluminescence in a binuclear dysprosium anthracene complex[J]. Inorg. Chem., 2023, 62: 1864-1874. doi: 10.1021/acs.inorgchem.2c01210
Ma X F, Huang X D, Zheng L M. Tuning the single-molecule magnet and photoluminescence properties of binuclear dysprosium complexes by light[J]. Cryst. Growth Des., 2023, 23: 1095-1103. doi: 10.1021/acs.cgd.2c01249

Scheme 1 Photocycloaddition of anthracene groups occurs in 3Y, 1Er@Y and 2Nd@Y, but not in pure 1Er and 2Nd

Figure 1 (a-c) Molecule structures of compounds 1Er (a), 2Nd (b) and 3Y (c); (d-f) 2D supramolecular framework layer viewed along the a-axis for 1Er (d), 2Nd (e), and 3Y (f)

Figure 2 (a) Emission spectra for compounds depma, 1Er, 2Nd and 3Y excited at 365 nm; (b) NIR emission spectra for 1Er, 2Nd, 1Er@Y and 2Nd@Y excited at 365 nm

Figure 3 Time-dependent photoluminescence spectra upon 395 nm UV-light irradiation of 1Er@Y (top) and 2Nd@Y (bottom)

Figure 4 (a) Temperature dependence of χMT on cooling in a dc field of 1 kOe for 1Er and 2Nd; (b, c) Frequency dependence of the out-of-phase (χ″) signals for compounds 1Er (b) and 2Nd (c) at the depicted temperatures under a 500 Oe (for 1Er) or 1 kOe (for 2Nd) dc field; (d) Plot of τ vs T on the log-log scale for 2Nd

Figure 5 Frequency dependence of the out-of-phase (χ″) signals at the depicted temperatures under a 500 Oe dc field for 1Er@Y (a), 1Er@Y-UV (b) and 1 kOe dc field for 2Nd@Y (c) and 2Nd@Y-UV (d), respectively; Plots of τ vs T for 2Nd@Y (e) and 2Nd @Y-UV (f)
Table 1. The magnetic parameters for 1Er, 1Er@Y, 1Er@Y-UV, 2Nd, 2Nd@Y and 2Nd@Y-UV
| Compound | χMT / (cm3·mol-1·K) | M / μB (70 kOe) | C / (K-n·s-1) | n | A / (K-1·s-1) |
| 1Er | 11.43 (300 K), 5.02(2 K) | 5.34 | |||
| 1Er@Y | 10.98 (300 K), 5.60 (2 K) | 4.61 | |||
| 1Er@Y-UV | 11.12 (300 K), 5.53 (2 K) | 4.49 | |||
| 2Nd | 1.47 (300 K), 0.82 (2 K) | 1.23 | 4.5(11) | 4.9(2) | 84(7) |
| 2Nd@Y | 1.53 (300 K), 1.10 (2 K) | 1.09 | 10(2) | 3.8(9) | 482(12) |
| 2Nd@Y-UV | 1.54 (300 K), 36.60 (2 K) | 1.01 | 27(6) | 5.2(8) | 637(19) |
 下载: 导出CSV

 扫一扫看文章


扫一扫关注我们