Citation:
LIU Jun, LI Rong, XIAO Jie, ZHANG Miao-Lan, LIU Xuan-Yan. Three Dimensional Porous Gold Film Prepared by the Hydrogen Bubble Dynamic Template[J]. Chinese Journal of Inorganic Chemistry,
2018, 34(6): 1166-1172.
doi:
10.11862/CJIC.2018.133
Received Date:
04 January 2018 Revised Date:
28 March 2018 Available Online:
10 June 2018
Abstract:
Au films with three-dimensional (3D) hierarchical pores consisting of interconnected dendrite walls were successfully fabricated by a strategy of cathodic deposition utilizing the hydrogen bubble dynamic template. The deposition conditions like potential, deposition time, H2SO4 concentration, precursor concentrations were investigated in detail. Herein, 3D Au porous films (3D PGFs) with dendritic walls could also be prepared by square wave potential (SWP). The morphology of foam films were characterized by scanning electron microscopy (SEM). The 3D PGFs comprised of nanodendrites show good electrocatalytic activities in enzyme-free detection of glucose.
Three dimensional porous materials have attracted increasing research enthusiasm due to their potential applications in areas such as electrocatalysis[1-2], superhy-drophobicity[2-3], sensors[4], and surface enhanced raman scattering (SERS)[2-5].
Considering the preparation methods of porous metals, the template-directed synthesis[6-8] and the dealloying method[9-10] are widely used in the literature. Generally, a templating method involves multisteps like creation of a porous template, pore filling and template removal. As a terminology of corrosion science, dealloying refers to selective dissolution of the less noble metal component from an alloy, resulting in a porous skeleton of the more noble metal component.
Recently, hydrogen bubbles have been utilized as a dynamic template in electrodeposition to produce self-supported 3D micro- or nano-porous metals under highly cathodic polarization. 3D foam films of non-noble metals, such as Cu[11-12], Sn[13], Pb[14], Mg[15] and NiCoFe[16] can be obtained with the hydrogen bubble dynamic templates. The deposited Cu foams can be further transformed either into CuO foams[17] by heating or into single noble metal foam films of Pt[18], Pd[19] and Ag[19] via galvanic replacement reactions, which is a strategy to utilize the hydrogen bubble template indirectly. Compared with other template methods, this method possesses several advantages: low cost, facile control of structure, and easy preparation. Lately, our group developed a novel one-step method to prepare gold foam films by surface rebuilding of smooth gold substrates in a blank NaOH solution utilizing the hydrogen bubble dynamic template and the redox of gold electrode under square wave potential pulses[2]. Particularly, we can fabricate 3D Au foam films from the Au electrode itself requiring no Au(Ⅲ) species in solution by this method, where the gold atoms to build the foams came from the redox of metal Au. While with precursor ions of noble metals in solution, direct electrodeposition of self-supported 3D noble monometallic foams like Au[20], Pt[21], Ag[22], Pd[23] and PdAu[24] can be obtained more quickly with the hydrogen bubble dynamic templates. Even though, there are still things that remained uncertain for the formation of single noble metal foams by electrodeposition. For example, honeycomb Pt can be fabricated using the hydrogen bubble dynamic template only with a divalent Pt(Ⅳ) salt K2PtCl4, rather than tetravalent Pt(Ⅱ) salts, with a relatively large concentration (50 mmol·L-1) in a narrow concentration range of H2SO4 solutions (0.1~0.2 mol·L-1)[21]. Moreover, instead of foam films, only 3D Pd nano-buds and nanodendrites were obtained on a glassy carbon substrate by the hydrogen bubble templated electrodeposition in 0.2 mol·L-1 NH4Cl + 0.01 mol·L-1 PdCl2[25]. However, Pd foam could be electrodeposited from a simple solution containing 3.75~30 mmol·L-1 PdCl2 and 1 mol·L-1 H2SO4[23]. As far as we known, many factors like precursors category and concentration, electrolyte, acidity, deposition potential or current density, deposition time, and so on can affect the formation of metal foams. That may be the reason why direct deposition of single noble metal foam films only succeeded lately with the hydrogen dynamic templates, which is once considered to be impossible.
Most recently, we synthesized 3D noble alloy foam films of AuPt[1] and PtPd[26] utilizing the hydrogen bubble dynamic template method in H2SO4 solutions containing low concentration of mixed precursors. The morphology and composition of AuPt alloy foams can be controlled by adjusting the deposition conditions. Noble foam films are attractive materials and worth paying more attention. Direct deposition of mono-metal foam films like Au foams were deserved further investigations, which might also be challenging and make us thinking more. In this paper, the influence factors on the electrodeposition of 3D Au foam films are investigated in detail. The electrocatalytic performances of the prepared Au foams toward enzyme-free detection of glucose reactions are also demonstrated.
1.
Experimental
1.1
Reagents
HAuCl4·4H2O and glucose were obtained from Sinopharm Chemical Reagent Co., Ltd. (Shanghai, China). Sulfuric acid was purchased from the Factory of Hunan Normal University. All the chemicals were of analytical grade and were used as received. Milli-Q water with a resistivity of greater than 18.3 MΩ·cm was used in the preparation of aqueous solutions. D-(+)-Glu-cose (C6H12O6·H2O), Na2HPO4·12H2O, NaH2PO4·2H2O, D-fructose, sucrose, maltose monohydrate, D-mannose, lactose were obtained from Sino-pharm Chemical Reagent Co., Ltd (Shanghai, China). L-ascorbic acid (AA) (C6H8O6, 99%) was purchased from Guangdong Xilong Chemical Co., Ltd (Guangzhou, China).
1.2
Electrodeposition of 3D porous Au films
Electrochemical experiments were performed on a CHI 660C electrochemical workstation (Chenhua Instru-ments, Shanghai, China). A gold disk (1 mm diameter, 99.99%), a platinum foil (geometric area 1 cm2), and a saturated mercurous sulfate electrode (SMSE) were emp-loyed as the working, counter, and reference electrodes, respectively. Prior to use, the working electrode was polished with 2 000 grit carbimet paper, followed by rinsing in Millipore water under ultrasonic waves.
Then, the well-polished electrode was electrochemi-cally pretreated by cycling the potential between -0.7 and 1.1 V in 1 mol·L-1 H2SO4 at a scan rate of 100 mV·s-1 until a stable voltammogram was obtained. Then the gold electrode was rinsed with Millipore water. The electrodeposition conditions of 3D PGFs were optimized at room temperature (~25 ℃) by varying the deposition potential (-1.5, -3, -4, -5 V), deposition time (10, 100, 500 s), sulfuric acid concentration (0.5, 2, 5, 10 mol·L-1) and HAuCl4 concentrations (0.4, 2, 5, 10 mmol·L-1). 3D PGFs with dendritic walls could be prepared by the SWP (between 1.5 and -4 V, 10 Hz) in the electrolyte of 2 mmol·L-1 HAuCl4+2 mol·L-1 H2SO4 for 500 s. The current densities of Au foam catalysts for enzyme-free detection of glucose were normalized to the total electro-chemical active surface (EASA), which were calculated using the double layer capacity measurements[27]. The deposited Au foam film was first treated by cyclic voltammetry between -0.70 and 1.1 V at 100 mV·s-1 in 1 mol·L-1 H2SO4 solution until a steady cyclic voltammo-gram (CV) was obtained. CVs of 3D porous Au film between 0.04 and 0.20 V in 1 mol·L-1 H2SO4 at 20, 50, 100, 200, 300, 400, 500 mV·s-1 were tested. All solutions were freshly prepared with Millipore water and analytical grade chemicals. All experiments were performed at room temperature.
1.3
Characterizations of the deposited foam films
The morphology images of the electrodeposited foam films were taken with a JEOL JSM-6360 scanning electron microscope (SEM) operating at 25 kV.
1.4
Electrooxidation of glucose
3D PGFs prepared in a solution of 2 mmol·L-1 HAuCl4+2 mol·L-1 H2SO4 by electrodeposited along with H2 evolution at constant potential of -4 V treated for 500 s, were evaluated as a glucose sensor in a 0.1 mol·L-1 phosphate-buffered saline (PBS) solution containing 0.1 mol·L-1 Na2SO4 as a supporting electrolyte at desired potentials. The currents in each experiment were recorded after the transient reached a steady state. Amperometric curves were obtained after adding desired concentration of glucose with the solution stirred constantly. Before measurements, 3D PGFs were electrochemically activated by using a SMSE as reference to avoid the specic adsorption of chloride ions, and obtain valid and reproducible results.
2.
Results and discussion
2.1
Characterizations of the electrodeposited foam films
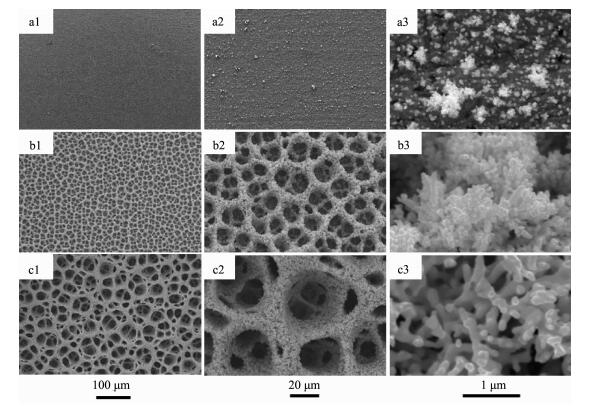
Fig. 1 shows the time-dependent morphological evolution of 3D PGFs, which were electrodeposited at -4 V in the solution of 2 mmol·L-1 HAuCl4+2 mol·L-1 H2SO4. The SEM images demonstrate that application of different deposition times results in the different morphologies of 3D PGFs. The origin of this unique structure is discussed elsewhere and briefly summarized in the earlier report[11]. The film is too thin to form foam in short deposition time of 10 s (Fig. 1(a1, a2)), there are many small dendrites on the substrate electrode (Fig. 1a3). When the deposition time is prolonged to 100 s, the 3D PGFs film reaches a certain thickness and H2 bubbles begins to guide the formation of micropores with a diameter of 10~20 μm (Fig. 1(b1, b2)). Since at this stage the film is still thin, and the formed micropore walls are highly porous because of vigorous evolution of hydrogen. The resulting self-supported porous films are micropores in the frame and nanopores in the walls, and the walls are made up of irregular gold nano-ramified structures (Fig. 1b3). For the longer electrolysis time, after 500 s of electrodeposition, it is clear that the thickness and the pore size (with a diameter of 20~50 μm) of the 3D micro-foam structure increases with the time of deposition (or the distance from the Au substrate) (Fig. 1(c1, c2)), and the irregular gold nano-ramified structures become more thicker and stronger because of coalescing of gold nanoparticles (Fig. 1c). Such an open porous structure can facilitate fast mass transfer of gas and liquid, while the extremely high area is good for electrocatalytic reactions.
图 1
图 1
SEM images of the 3D PGFs prepared in a solution of 2 mmol·L-1 HAuCl4+2 mol·L-1 H2SO4 by electrodeposited along with H2 evolution at constant potential of -4 V treated for different deposition times of (a1~a3) 10 s, (b1~b3) 100 s and (c1~c3) 500 s
Figure 1.
SEM images of the 3D PGFs prepared in a solution of 2 mmol·L-1 HAuCl4+2 mol·L-1 H2SO4 by electrodeposited along with H2 evolution at constant potential of -4 V treated for different deposition times of (a1~a3) 10 s, (b1~b3) 100 s and (c1~c3) 500 s
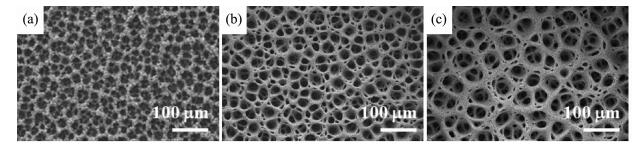
Among the deposition paremeters studies, the concentrations of the HAuCl4 greatly influenced the morphologies of the foam deposition. If the concentration of HAuCl4 is too low (less than 0.4 mmol·L-1), the walls of Au foam become too thin to form a 3D structure (Fig. 2a). In contrast, the higher concentrations of HAuCl4 than the optimum amount (2 mmol·L-1) result in thicker and denser foam walls (Fig. 2(b, c)). The well-defined 3D PGFs with highly open porous walls can be fabricated in a relatively wide concentration range of AuCl4- ions (from 2 to 10 mmol·L-1).
图 2
图 2
Typical SEM images of 3D PGFs electrodeposited under constant potential electrolysis at -4 V for 100 s in the solution of 2 mol·L-1 H2SO4 containing (a) 0.4, (b) 5 and (c) 10 mmol·L-1 HAuCl4
Figure 2.
Typical SEM images of 3D PGFs electrodeposited under constant potential electrolysis at -4 V for 100 s in the solution of 2 mol·L-1 H2SO4 containing (a) 0.4, (b) 5 and (c) 10 mmol·L-1 HAuCl4
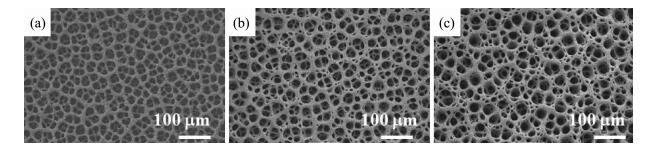
Furthermore, the H2SO4 concentration shows a considerable effect on the formation of 3D PGFs (Fig. 3). The increase in the concentration can improve the reaction rates. Fig. 3 shows SEM images of 3D PGFs grown from 2 mmol·L-1 HAuCl4 with different concen-trations of H2SO4 (0.5, 5 and 10 mol·L-1). The thickness of Au foam increases with the electrolyte concentration within the same deposition time (Fig.(3a~c)).
图 3
图 3
Typical SEM images of 3D PGFs electrodeposited under constant potential electrolysis at -4 V for 500 s in the solution of 2 mmol·L-1 HAuCl4 with different H2SO4 concentrations of (a) 0.5, (b) 5 and (c) 10 mol·L-1
Figure 3.
Typical SEM images of 3D PGFs electrodeposited under constant potential electrolysis at -4 V for 500 s in the solution of 2 mmol·L-1 HAuCl4 with different H2SO4 concentrations of (a) 0.5, (b) 5 and (c) 10 mol·L-1
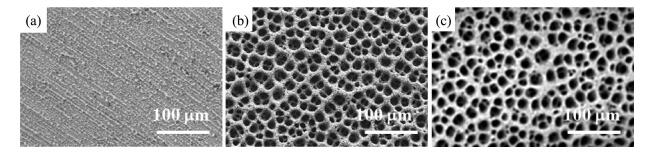
For electrodeposition technique, applied potential is an important factor for controlling the morphologies of 3D PGFs. Fig. 4 shows the SEM images of the 3D PGFs obtained at different electrolysis potentials at a fixed concentration (2 mmol·L-1 HAuCl4+2 mol·L-1 H2SO4) and room temperature (~25 ℃) within 500 s. For the different electrolysis potentials, the morphologies are more or less similar, with certain differences. During the electrolysis process, the applied potentials (-1.5, -3.0 and -5.0 V) are sufficient for the reaction AuCl4-+3e=Au+4Cl- (E=0.339 V vs SMSE) and hydrogen evolution to take place on the working electrode. For the materials obtained at lower potentials (-1.5 and -3.0 V), the 3D porous Au structures were also observed (Fig. 4(a, b)). For example, the morphologies shown in Fig. 4a, are obtained using -1.5 V, the deposit in this case seems to consist of large pores, thin walls and the thickness of Au film is also thin. At the more negative potential of -3.0 V (Fig. 4b), both the walls of 3D porous and the thickness of Au film become thicker while the diameter of pores chang a little. We expect that the fast growth rate observed at the higher potential causes the Au to fill in the gaps between the initially deposited bumps. At more negative potential (-5.0 V), 3D porous Au structures were clearly observed (Fig. 4c).
图 4
图 4
SEM images for the 3D PGF samples prepared by electrodeposited along with H2 evolution in the solution of 2 mmol·L-1 HAuCl4 + 2 mol·L-1 H2SO4 for 500 s at different potentials of (a)-1.5, (b)-3 and (c)-5 V
Figure 4.
SEM images for the 3D PGF samples prepared by electrodeposited along with H2 evolution in the solution of 2 mmol·L-1 HAuCl4 + 2 mol·L-1 H2SO4 for 500 s at different potentials of (a)-1.5, (b)-3 and (c)-5 V
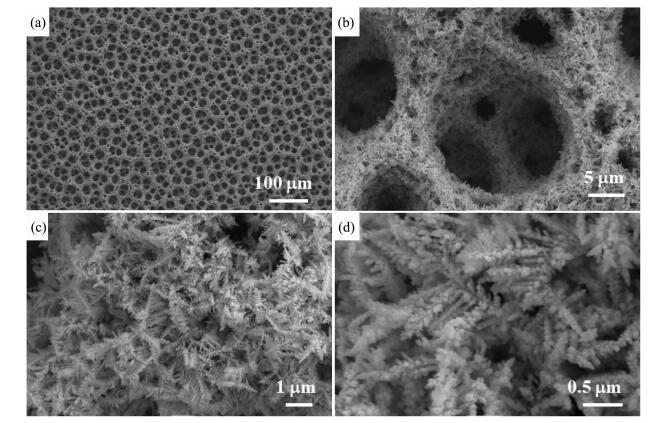
The 3D PGFs with dendritic walls could also be prepared by SWP. The morphologies of 3D PGFs prepared by SWP (-4 V~1.5, 10 Hz) are shown in Fig. 5. It is clearly seen that the gold substrate is covered with a thick layer of foam microstructures with micropores, the diameter of these micropores is about 10~20 μm (Fig. 5(a, b)). Further detailed examinations reveal that the pores are highly connected (Fig. 5b), and the walls are composed of well-defined dendritic structures (Fig. 5(c, d)).
图 5
图 5
SEM images of the 3D PGFs with dendritic walls electrodeposited along with H2 evolution by the SWP ((between 1.5 and - 4 V, 10 Hz) in the electrolyte of 2 mmol·L-1 HAuCl4 + 2 mol·L-1 H2SO4 for 500 s
Figure 5.
SEM images of the 3D PGFs with dendritic walls electrodeposited along with H2 evolution by the SWP ((between 1.5 and - 4 V, 10 Hz) in the electrolyte of 2 mmol·L-1 HAuCl4 + 2 mol·L-1 H2SO4 for 500 s
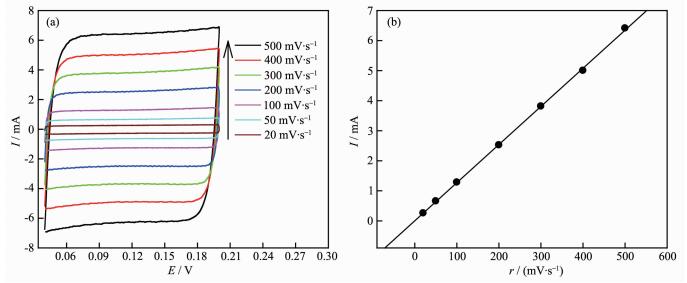
The current densities of enzyme-free detection of glucose are normalized to the electrochemically active surface areas, which are calculated by measuring the double layer capacity measurements. Fig. 6a shows capacitive currents during the electrode polarization in the double layer region and their dependence on scan rate. Herein, the real surface area of the electrode is calculated as S=C/C0. Where S is the ECSA, C is the capacity of the electrical double layer, C0 is the capacity per unit area. From the slope of I-r relationship (Fig. 6b), the double layer capacity of the electrode studied is obtained. The value of 44.5 μF·cm-2 (in 1 mol·L-1 H2SO4), found for Au, is then used to calculate the real surface area of 3D porous Au foam. Herein, the ECSA of 3D porous Au is calculated as 275 cm2.
图 6
图 6
(a) CVs of 3D porous Au film between 0.04 and 0.20 V in 1 mol·L-1 H2SO4 at different scan rates (r);
(b) Slope of I-r relationship at 0.11 V
Figure 6.
(a) CVs of 3D porous Au film between 0.04 and 0.20 V in 1 mol·L-1 H2SO4 at different scan rates (r);
(b) Slope of I-r relationship at 0.11 V
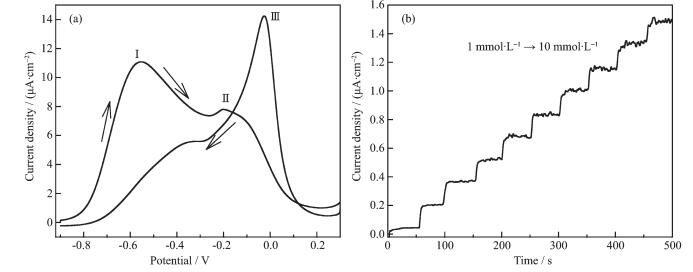
3D PGFs with the interconnected macroporous walls and the high surface are considered as good catalysts in enzyme-free detection of glucose. The performance of glucose biosensors is usually tested under physiological conditions. Therefore, the electro-catalytic activity of the Au film electrode toward the oxidation of glucose was investigated in a PBS solution containing 0.1 mol·L-1 Na2SO4 as supporting electrolyte. Fig. 7a shows the cyclic voltammogram of the oxidation of glucose at a porous Au film electrode in a pH=7.4 PBS solution containing 0.1 mol·L-1 Na2SO4 and 100 mmol·L-1 glucose at 10 mV·s-1. The CV in the positive potential scan shows two anodic current peaks located at -0.55 V (Ⅰ) and -0.20 V (Ⅳ). The current peak (Ⅰ) should be due to the electrosorption of glucose to form adsorbed intermediate, releasing one proton per glucose molecule. With the potential moving to more positive values, free Au active sites are released for the direct oxidation of glucose, and a current peak at -0.20 V for this direct oxidation appears. In the negative potential scan, with the increasing of the surface Au, enough surface active sites will be available for the direct oxidation of glucose, resulting in an anodic current peak at -0.02 V(Ⅲ).
图 7
图 7
(a) CV of the 3D PGFs electrode in a solution of 0.1 mol·L-1 PBS+0.1 mol·L-1 Na2SO4 +100 mmol·L-1 glucose at a scan rate of 10 mV·s-1; (b) Typical amperometric response of the 3D PDFs to glucose in a stirring 0.1 mol·L-1 PBS+ 0.1 mol·L-1 Na2SO4 solution by successive addition of 1 mmol·L-1 glucose under the applied potential of -0.2 V versus SMSE
Figure 7.
(a) CV of the 3D PGFs electrode in a solution of 0.1 mol·L-1 PBS+0.1 mol·L-1 Na2SO4 +100 mmol·L-1 glucose at a scan rate of 10 mV·s-1; (b) Typical amperometric response of the 3D PDFs to glucose in a stirring 0.1 mol·L-1 PBS+ 0.1 mol·L-1 Na2SO4 solution by successive addition of 1 mmol·L-1 glucose under the applied potential of -0.2 V versus SMSE
For practical application, however, an amperometric sensor is more useful than a voltammetric one. We attempt to development a non-enzymatic glucose sensor for the glucose is an important clinical medicine biomolecule. Fig. 7b shows the amperometric response of the 3D PFGs electrode, held at an optimized detection potential of -0.2 V, to the successive addition of 1 mmol·L-1 glucose at the points as indicated by arrow. With each addition of glucose to the stirred supporting electrolyte solution, the current rapidly increases. One can see that oxidation current linearly increases for glucose concentrations in the range of 1~10 mmol·L-1.
3.
Conclusions
In summary, a facile, one-step hydrogen bubble dynamic template electrodeposition method has been developed to prepare three-dimensional porous gold film (3D PGF) with highly open porous walls in a low conce-ntration of HAuCl4 (2 mmol·L-1) solution. The pore diameters and wall thickness of the porous gold films can be easily controlled by varying deposition time, concentration of the precursors, supporting electrolyte, and the applied potentials. Herein, we also have developed a SWP method to prepare 3D PGFs with dendrite walls. The 3D PGFs have good catalysts in enzyme-free detection of glucose.
[1]
Liu J, Cao L, Huang W, et al. ACS Appl. Mater. Interfaces, 2011, 3:3552-3558 doi: 10.1021/am200782x
Figure 1
SEM images of the 3D PGFs prepared in a solution of 2 mmol·L-1 HAuCl4+2 mol·L-1 H2SO4 by electrodeposited along with H2 evolution at constant potential of -4 V treated for different deposition times of (a1~a3) 10 s, (b1~b3) 100 s and (c1~c3) 500 s
Figure 2
Typical SEM images of 3D PGFs electrodeposited under constant potential electrolysis at -4 V for 100 s in the solution of 2 mol·L-1 H2SO4 containing (a) 0.4, (b) 5 and (c) 10 mmol·L-1 HAuCl4
Figure 3
Typical SEM images of 3D PGFs electrodeposited under constant potential electrolysis at -4 V for 500 s in the solution of 2 mmol·L-1 HAuCl4 with different H2SO4 concentrations of (a) 0.5, (b) 5 and (c) 10 mol·L-1
Figure 4
SEM images for the 3D PGF samples prepared by electrodeposited along with H2 evolution in the solution of 2 mmol·L-1 HAuCl4 + 2 mol·L-1 H2SO4 for 500 s at different potentials of (a)-1.5, (b)-3 and (c)-5 V
Figure 5
SEM images of the 3D PGFs with dendritic walls electrodeposited along with H2 evolution by the SWP ((between 1.5 and - 4 V, 10 Hz) in the electrolyte of 2 mmol·L-1 HAuCl4 + 2 mol·L-1 H2SO4 for 500 s
Figure 6
(a) CVs of 3D porous Au film between 0.04 and 0.20 V in 1 mol·L-1 H2SO4 at different scan rates (r);
(b) Slope of I-r relationship at 0.11 V
3D PGFs prepared in a solution of 2 mmol·L-1 HAuCl4+2 mol·L-1 H2SO4 by electrodeposited along with H2 evolution at constant potential of-4 V treated for 500 s
Figure 7
(a) CV of the 3D PGFs electrode in a solution of 0.1 mol·L-1 PBS+0.1 mol·L-1 Na2SO4 +100 mmol·L-1 glucose at a scan rate of 10 mV·s-1; (b) Typical amperometric response of the 3D PDFs to glucose in a stirring 0.1 mol·L-1 PBS+ 0.1 mol·L-1 Na2SO4 solution by successive addition of 1 mmol·L-1 glucose under the applied potential of -0.2 V versus SMSE



 下载:
下载:

 下载:
下载:



