Figure 1.
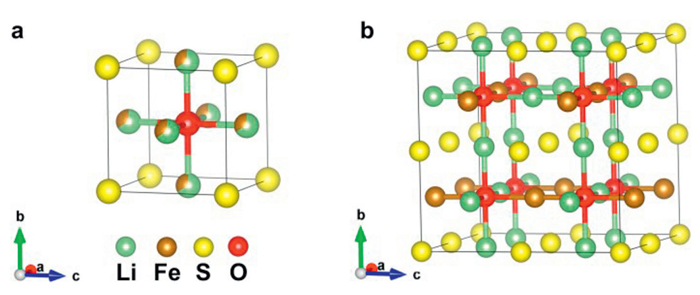
(a) Structure of the primitive cell of Li2FeSO with mixed occupancy of Li and Fe. (b) Ground state structure of the 2 × 2 × 2 supercell of Li2FeSO.
Voltage design and transport channel optimization of anti-perovskite cathode materials: A density functional theory study
Dixing Ni , Jiarui Qi , Zhi Deng , Dong Ding , Rui Wang , Wenjie Zhou , Sisi Zhou , Yang Sun , Shuai Li , Zhaoxiang Wang

Li-ion batteries are widely used as energy storage devices in portable electronic devices, electric vehicles, and grid energy storage systems. The pursuit of higher energy density in Li-ion batteries has spurred the development of new battery technologies [1–3]. Nonetheless, the critical challenge in advancing current battery technologies lies in the selection of cathode materials, which directly impacts energy density [4]. Presently, commercial cathode materials fall into three primary types: olivine LiFePO4, layered LiCoO2, and spinel LiMn2O4 [5–8]. These materials exhibit excellent electrochemical performance; however, none excels simultaneously in terms of cost, reversibility, energy density, and safety. Therefore, the development of novel cathode materials is of paramount importance.
Recently, a new anti-perovskite cathode material, Li2FeChO (Ch = S, Se), has been synthesized via a simple solid-phase sintering method [9]. Within the anti-perovskite Li2FeChO structure, Li and Fe are arranged in a 2:1 ration at the face center, O occupies the cube center, and Ch occupies the cube corners. The cost-effective Li2FeSO variant delivers a high theoretical capacity of 227 mAh/g for half Li removal. When coupled with a non-carbonate electrolyte, Li2FeSO attains a capacity of 230 mAh/g at 0.1 C. Nevertheless, its practical utility in Li-ion batteries is limited by the relatively low voltage (~2.2 V) and inadequate cycle stability [9].
Substituting elements and doping techniques are powerful means of fine-tuning the physical properties of electrode materials. Lai et al. conducted research on a series of anti-perovskite cathode materials (Li2TM)ChO (TM = Mn, Co; Ch = S, Se) [10]. While these compounds may not surpass Li2FeSO in terms of electrochemical performance, they underscore the structural flexibility of anti-perovskites, paving the way for optimization through element substitution and doping. Notably, transition metal (TM) doping has proven effective in enhancing the electrochemical performance of Li2FeSO. Successful synthesis has been achieved for Li2Fe0.8Mn0.2SO, Li2Fe0.5Mn0.5SO, Li2Fe0.9Mn0.1SO, and LiFe0.9Co0.1SO, with Co doping significantly boosting the capacity [11–13]. LiFe0.9Co0.1SO attains a remarkable capacity of 250 mAh/g at 1 C [13]. However, it is important to note that this approach has not yet resolved the issue of low voltage.
In this work, we aim to clarify the underlying physical mechanism of low voltage and explore strategies to increase voltage and optimize Li ion transport performance. To achieve this, we utilized element doping and substitution methods to investigate the influence of various elements on voltage and Li diffusion properties. Substitution entailed the replacement of S in Li2FeSO and Li2MnSO with Se and Te, while an alternative approach involved substituting Fe with TMs, including Ti, V, Cr, Mn, Fe, Co, and Ni. In scenarios where two distinct elements were co-substituted, we investigated the substitution of Cu and Mg in Li2TMSO (TM = Ti, V, Cr, Mn, Fe, Co, Ni). We analyzed the intrinsic factors that determine voltage by calculating orbital energy levels and electronic structures. Our calculations have uncovered that the voltage is intricately tied to the TM-3d orbital and the S-3p orbital, with the latter placing limitations on voltage enhancement. For optimizing Li diffusion, we introduced doping with F and Cl at the S site and doping with Na and K at the TM site. These doping strategies effectively widen the channels and accelerate the transport of Li ions. This work lays a robust theoretical foundation for experimental modifications of anti-perovskite cathodes.
In this work, all calculations were conducted utilizing first-principles density functional theory, implement in the Vienna Ab initio Simulation Package (VASP) [14,15]. Electron interactions were treated by the projector augmented wave (PAW) method with generalized gradient approximation (GGA) of the Perdew–Burke–Ernzerhof (PBE) functional [16,17]. The cutoff was set to 550 eV for all calculations. As shown in Fig. S1 (Supporting information), we tested various cutoff energy values and found that when the cutoff exceeds 500 eV, the energy fluctuation range of the 2 × 2 × 2 supercell system is less than 0.05 eV. Considering both the computational cost and accuracy, we ultimately selected a cutoff energy of 550 eV. To accurately simulate d-electron interactions, we adopted the GGA+U methods and considered the spin-polarized effect [18]. The U value for Ti, V, Cr, Mn, Fe, Co, Ni, and Cu are 5.0, 3.25, 3.7, 3.9, 5.3, 3.32, 6.2 and 2.0 eV, respectively [19,20]. To verify the accuracy of DFT+U in describing the relationship between electronic orbital energy levels and voltage, we also conducted a comparison using the HSE method [21]. A 2 × 2 × 2 supercell and a 3 × 3 × 3 k-point mesh with the Monkhorst-Pack method were employed for all calculations [22]. Convergence criteria for the ionic and electronic steps were set to 0.01 eV/Å and 10−5 eV, respectively. In the Li2FeSO structure, Li and Fe exhibited mixed occupancy at the face center of the cube. We identified the stable ground-state structures of Li2TMSO through Ewald energy calculations and DFT calculations. Specifically, we screened the 20 structures with the lowest Ewald energy, calculated using the Python Materials Genomics (pymatgen), and subsequently performed accurate DFT calculations to determine the ground state structure [23].
The voltage for Li insertion/removal was calculated by the following formula:
|
|
(1) |
where E(LixTMSO) represents the energy of the stable LixTMSO structure, and E(Li) stands for the energy of a single Li atom in Li metal.
To study Li migration pathway and energy barriers, we employed the climbing image nudged elastic band (CI-NEB) method, involving the use of five images and a force convergence criterion of 0.01 eV/Å [24].
As shown in Fig. 1, the anti-perovskite Li2FeSO exhibits a cubic structure with the Fd-3m space group. In Li2FeSO, Li and Fe atoms share the face-centered positions, forming (Li2/3Fe1/3)6-O octahedra. This would result in the formation of Li4Fe2-O6 octahedra. Due to the strong repulsion between Fe2+ ions, Fe atoms in the Li4Fe2-O6 octahedra tend to occupy the most distant vertices, leading to the Fe atoms in Fig. 1 being positioned at opposite vertices of the octahedron. As a result, in the same atomic layer, Fe atoms align along a straight line. In adjacent layers, to minimize the repulsive interaction between Fe atoms, the alignment direction of Fe atoms in neighboring layers is rotated by 90 degrees. Hence, in its ground state structure, Fe and Li are located at the center of the O2S4 octahedron in the Fe compartment arrangement. This structural arrangement is consistent with the ground-state structure reported by Lu et al. and Mikhail et al. [20,25]. To explore the effect of substituting S with Se and Te on the voltage characteristics, we conducted substitutions within the ground state structure of Li2FeSO, resulting in Li2FeSeO and Li2FeTeO.
By combining preliminary Ewald energy calculations with precise DFT calculations, we characterized the LixFeSO mesophase for Li2FeSO within the range of 1 < x < 2. The stable phase between LiFeSO and Li2FeSO in the phase diagram was determined by calculating the convex hull. As shown in Fig. 2a, Li2FeSO exhibits two distinct voltage platforms, which are consistent with experimental observations. Specifically, for the range of 1.875 < x < 2, the voltage is 2.64 V vs. Li/Li+, aligning with the experimental charging at 2.5 V vs. graphite [9]. However, for the range of 1 < x < 1.875, the voltage increases to 2.81 V. The average voltage for the removal of half Li is 2.79 V, slightly exceeding the experimental value. This variance may be attributed to structural changes occurring after the Li removal. Expanding our investigation to explore the convex hull and voltage profiles for Li2FeSeO and Li2SeTeO, we observed multiple voltage platforms (Figs. 2c and e). The average voltages for Li2FeSeO and Li2FeTeO are 2.72 V and 2.58 V, respectively. These results indicate that replacing S with Se and Te leads to a reduction in voltage for Li2FeSO.
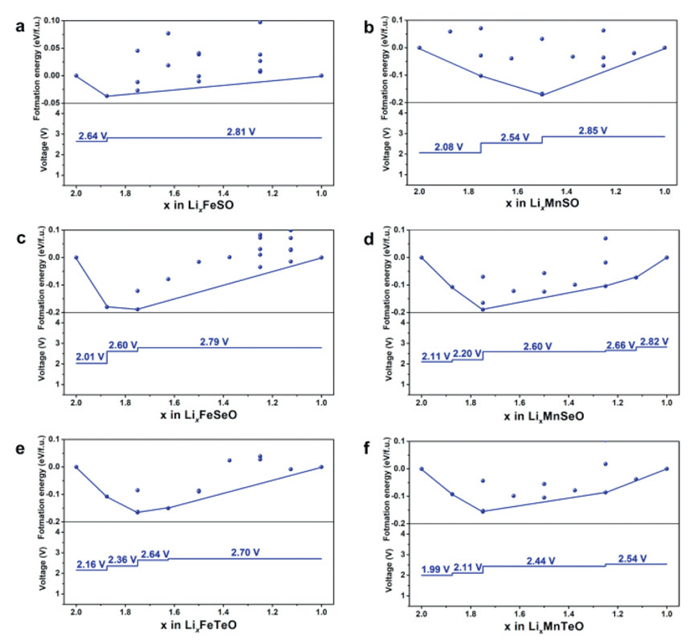
Furthermore, we calculated the voltage curves of Li2MnSO, Li2MnSeO, and Li2MnTeO, as displayed in Figs. 2b, d and f, respectively. The average voltages for Li2MnSO, Li2MnSeO, and Li2MnTeO are 2.67, 2.54, and 2.43 V, respectively. The consistent trend of voltage decreasing upon replacing S with Se and Te is attributed to the weak interaction between the higher energy level 4p and 5p electron orbitals and the 3d electron orbitals. This weaker interaction elevates the energy levels of Mn2+/3+ and Fe2+/3+ redox pairs, consequently reducing the voltage [3].
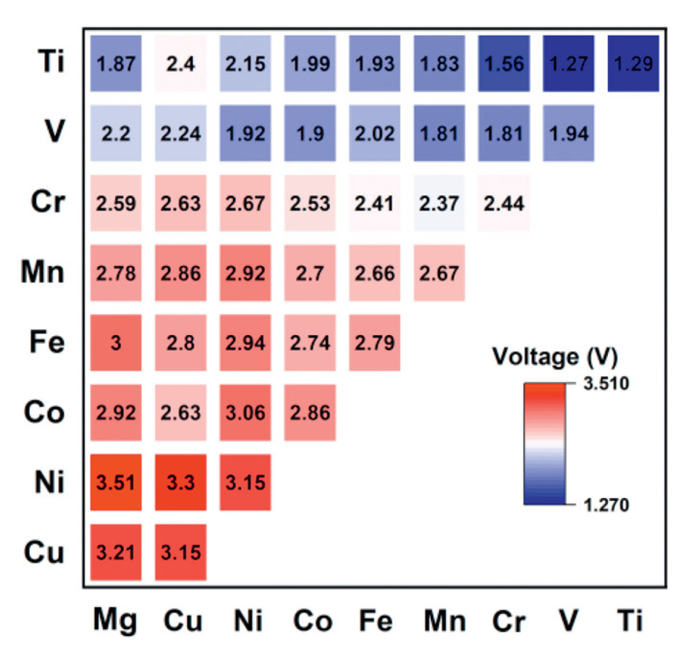
For typical cathode materials, the voltage hinges on alterations in the valence states of TMs during the Li extraction/insertion processes. Therefore, we examined the effect of substituting different TM metal elements on the voltage characteristics of Li2TMSO. Elements like Ti, V, Cr, Mn, Fe, Co, and Ni undergo a shift from a divalent state (TM2+) to a trivalent state (TM3+) when one Li is removed per formula unit. Our focus was on designing materials with enhanced voltages, and to achieve this, we explored the incorporation of divalent Mg and Cu into Li2TMSO. Since Cu and Mg cannot be converted into a higher valence state, they are inactive elements in Li2TMSO. When Li2TM0.5TM0.5SO, Li2Mg0.5TM0.5SO, and Li2Cu0.5TM0.5SO (TM = Ti, V, Cr, Mn, Fe, Co, Ni) are de-lithium, 0.5 mol of TM may lose 1 mol of electrons. This approach has the potential to facilitate the transition of TMs from a divalent to tetravalency state upon the removal of one Li per formula unit.
The voltages for Li2TM0.5TM0.5SO, Li2Mg0.5TM0.5SO, and Li2Cu0.5TM0.5SO (TM = Ti, V, Cr, Mn, Fe, Co, Ni) are depicted in Fig. 3. Among Li2TMSO materials, the voltage change follows an ascending trend as we move along the periodic table from Ti to Ni. Li2TiSO exhibits the lowest voltage at 1.29 V, while Li2NiSO shows the highest voltage at 3.15 V. The high voltage of Li2NiSO may inspire further research into the influence of Ni in enhancing voltage, much like in the case of LiNi0.8Co0.1Mn0.1O2 cathode [26,27]. By partially substituting Ni in Li2CoSO, Li2FeSO, Li2MnSO, Li2CrSO, and Li2TiSO, we observed increments of 0.20, 0.15, 0.25, 0.23, and 0.86 V, respectively, underscoring Ni's potential as an effective doping element for voltage enhancement. Our calculations also reveal that both Cu and Mg play a significant role in elevating the voltage. Compared to their counterparts without Cu doping, materials such as Li2Cu0.5Ni0.5SO, Li2Cu0.5Fe0.5SO, Li2Cu0.5Mn0.5SO, Li2Cu0.5Cr0.5SO, Li2Cu0.5V0.5SO, and Li2Cu0.5Ti0.5SO exhibit voltage increases of 0.15, 0.01, 0.09, 0.19, 0.3, and 0.86 V, respectively. Furthermore, with the inclusion of Mg, we attain even higher voltages. Notably, Li2Mg0.5Ni0.5SO achieves a voltage of 3.51 V, which can rival the voltage of LiFePO4 [28]. As shown in Fig. S2a (Supporting information), to further compare the effects of elemental substitution on the energy density of the materials, we calculated the energy density of the compounds mentioned above. The results indicate that Mg doping not only increases the voltage but also reduces the overall mass of the material due to its lighter atomic weight, thereby further enhancing the energy density of the battery material. Consequently, Li2Mg0.5Ni0.5SO exhibits the highest energy density among these materials. This suggests that anti-perovskite cathode materials hold great potential for application in high-energy-density batteries.
During repeated charge and discharge cycles, the changes in electrode's volume can have a profound impact on the cycling stability of the battery. This effect can lead to detachment at the electrode-electrolyte interface, resulting in increased interface impedance and stress on the battery pack. Therefore, evaluating the volume changes before and after Li removal is a crucial factor in determining the suitability of materials for battery applications. As shown in Fig. S2b (Supporting information), the volume change of Li2TMSO (TM = Ni, Co, Fe, V, Cr, Ti) exceed 10%, with Li2CuSO exhibiting the smallest volume change at 4%. In the Li2TM0.5TM0.5SO (TM = Mg, Cu, Ni, Co, Fe, V, Cr, Ti) system, Li2Co0.5Cu0.5SO demonstrates the least volume change (2%). Data analysis suggests that Cu doping effectively mitigates volume changes, reducing the volume change by 12%, 13%, 5%, 2%, 7%, and 3% when compared to the Li2TMSO (TM = Ni, Co, Fe, Mn, V, Cr, Ti) system. Similarly, Mg doping also restrains volume changes, resulting in volume change rates decreasing by 9%, 5%, 3%, 2%, 4%, 4%, and 0% in the Li2TM0.5Mg0.5SO (TM = Ni, Co, Fe, Mn, V, Cr, Ti) system. Regarding electronic structure, as show in Fig. S2c (Supporting information), there appears to be no discernable trend in band gap size with respect to element variations. Nevertheless, doping can lead to the formation of metallic materials.
As mentioned above, via element substitution, we obtained three materials with voltages surpassing 3 V: Li2Mg0.5Ni0.5SO, Li2Cu0.5Ni0.5SO, and Li2NiSO. To access their thermodynamic stability, we calculated the formation energy for these materials using reactants obtained from the OQMD database [29]. The reaction equations for these assessments are as follows:
|
|
(2) |
|
|
(3) |
|
|
(4) |
The calculated results show that Li2NiSO lacks thermodynamic stability, which aligns the findings reported by Lu et al. [20]. Li2Cu0.5Ni0.5SO also exhibits thermodynamic instability. Interestingly, Li2Mg0.5Ni0.5SO demonstrates better thermodynamic stability, suggesting its potential for synthesis.
Given that Li2NiSO and the Li2Mg0.5Ni0.5SO possess the highest voltages among Li2TMSO and Li2TM0.5TM0.5SO materials, it is essential to explore the underlying mechanisms responsible for the high voltage. Voltage is mainly determined by the electron structure and the energy required for electrons to leave the system [30–32]. To compare the energy levels of different materials system, we calibrated the energy level using the Li atom's 1s electron orbital. Here, we would like to emphasize that the d band center we calculated does not represent its true absolute position. To avoid errors introduced by different computational functionals affecting the d band center, we primarily focus on the energy trend of the d band center as the transition metal changes to analyze the voltage trend. Furthermore, we analyzed the trend in the energy difference between the d band center and the p band center to assess the likelihood of S undergoing anionic redox reactions. In Fig. 4a, we present the d band center energy levels for TMs in Li2TMSO materials. Notably, the TM-3d band center energy level shows a positive correlation with the voltage. However, this correlation exhibits two distinct stages: one from Ti to Cr and another from Mn to Ni. During the transition from Ti to Cr, the positive correlation is more pronounced, while it weakens during the transition from Cr to Ni, implying that the voltage is not solely determined by the d electron orbitals.

Mikhailova et al. reported that S element actively participates in redox reaction during the charging and discharging processes [33]. To gain further insights into the factors influencing the voltage of Li2TMSO, we calculated the band center energy levels for S-3p and O-2p orbitals. As shown in Fig. 4b, the TM 3d band center energy level of Ti, V, Cr, Mn, Fe, Co, Ni decreases sequentially. The S-3p band center energy level is higher than that of O-2p, making S more prone to anionic redox reactions. In contrast, the deeper O-2p energy level implies stronger binding of oxygen atoms in the lattice, reducing their reactivity and preventing lattice oxygen release. This greater reactivity of S, highlighted by electronic structure calculations and consistent with experimental findings, indicates that S undergoes reversible anionic redox during charge and discharge processes [13,33].
Figs. 4c and d illustrate the energy level disparities between S-3p, O-2p, and TM-3d orbitals. The transition from Ti to Ni demonstrates a shift from a positive to a negative energy gap between TM-3d and S-3p, paralleled by TM-3d and O-2p. However, the gap between TM-3d and S-3p is smaller, signifying an increased likelihood of S participating in oxidation-reduction during Li removal. In Fig. 4c, the gap between TM-3d and S-3p is 4.55, 3.70, 2.52 eV for Ti, V, Cr, indicating that the voltage is primarily governed by the TM in Li2TiSO, Li2VSO, Li2CrSO. This corresponds with the observation in Fig. 4a, where the voltage exhibited a stronger correlation with the 3d band center energy level from Ti to Cr. However, from Mn to Ni, the gap between TM-3d and S-3p are 1.07 eV (Mn), −0.22 eV (Fe), −0.93 eV (Co), −2.87 eV (Ni), rationalizing the weakened correlation between voltage and the TM-3d energy level from Mn to Ni. These results indicate S's likely involvement in redox reactions, with the S-3p orbital constraining voltage variations with the TM-3d energy level. To eliminate the influence of the selected U value in the DFT+U method on the results, we also used the HSE method to calculate the aforementioned results. As shown in Fig. S3 (Supporting information), the calculation results are consistent with those of DFT+U. There are two stages in the relationship between voltage and the energy levels of TM-3d orbitals. The energy level difference between TM-3d and S-3p, O-2p orbitals decreases progressively as the TM element changes from Ti to Ni.
In order to analyze the possibility of anion redox occurrence in the Li2TMSO system, we presented the density of states distribution of the Li2TMSO system in the range of electron energy level below the Fermi level. As shown in Fig. S4 (Supporting information), the proportion of density of states (DOS) of TM-3d decreases with the transition of TM from Ti to Ni, and the proportion of density of states of S element increases from less than 20% in Li2TiSO to more than 40% (Li2NiSO), which further confirms the possibility of S reaction in the process of Li deintercalation. On the other hand, the content of TM-3d orbitals in Li2TiSO, Li2VSO and Li2CrSO is higher than 60%, while in Li2TMSO (TM = Mn, Fe, Co, Ni), the content of TM-3d orbitals is less than 40%, which is consistent with the two-stage phenomenon of the correlation between the central energy level and voltage of TM-3d.
In the process of delithiumation of Li2TiSO, Li2VSO and Li2CrSO, the TM-3d orbital mainly reacts. In the process of Li deintercalation of Li2TMSO (TM = Mn, Fe, Co, Ni) system, the TM-3d orbital undergoes valence, and at the same time, the potential and the higher energy level S-3p orbital also participate in the reaction, and anion redox occurs. From another point of view, the S-3p electron orbital at the higher energy level limits the voltage increase of the Li2TMSO system, because the TM-3d electron orbital at the deeper energy level cannot participate in the reaction due to the presence of the S-3p orbital at the higher energy level, which in turn limits the increase of the Li2TMSO voltage.
In the case of Li2Mg0.5TM0.5SO, the introduction of Mg doping results in elevated 3d orbital energy levels for TM elements, such as Ti, V, Cr, Mn, Fe, and Co (Figs. S5 and S6 in Supporting information). This modification leads to higher voltages compared to Li2TMSO. Unlike Li2TMSO, Li2Mg0.5TM0.5SO incorporates a non-reactive Mg component. Consequently, electrons from deeper energy levels within Li2Mg0.5TM0.5SO actively participate in the delithiation reaction, contributing to an increase in voltage. Similar to Li2TMSO, as the TM element transitions from Ti to Ni, the contribution of TM-3d orbitals diminishes near the Fermi level, while the contribution of S-3p orbitals increases (Fig. S7 in Supporting information). This observation further supports the notion that the voltage enhancement is attributed to the involvement of electrons from deeper energy levels in the reaction. This phenomenon can be categorized into two scenarios: one where the divalent TM is converted into a tetravalent TM, and the other in which both the transition metal and the valence electrons from the deep energy level of the anion participate simultaneously in the reaction. This energy gap promotes the transition of TM from a divalent to a tetravalent state, with the S-3p orbital remaining uninvolved in the reaction. In cases where the energy level difference between TM-3d and S-3p is narrower, the transition of the TM element into a higher valence state is constrained by the influence of the S-3p orbital.
The determination of the valence state of transition metals can be achieved by examining their magnetic moments, as presented in Table S1. In Li2Mg0.5TM0.5SO, Ti2+ and V2+ ions exhibit magnetic moments of 1.87 μB and 2.81 μB, respectively, corresponding to approximately 2 and 3 electrons. Conversely, in LiMg0.5TM0.5SO, the magnetic moments of Ti and V are measured as 0 μB and 1.17 μB, respectively. As shown in Fig. S8 (Supporting information), Ti and V exhibit tetravalent behavior with 0 and 1 electron, respectively, contributing to the reaction. This behavior is attributed to the substantial energy level disparity between the TM-3d (TM = Ti, V) orbital and the S-3p orbital (Fig. S5c). In cases where the energy level difference between TM-3d and S-3p is narrower, the transition of the TM element into a higher valence state is constrained by the influence of the S-3p orbital. Table S1 (Supporting information) further illustrates that the magnetic moment difference between Li2Mg0.5TM0.5SO and LiMg0.5TM0.5SO decreases as the TM element progresses from Cr to Ni. This trend suggests that cations are progressively less involved in the reaction, highlighting the increased role of anions in the reaction process.
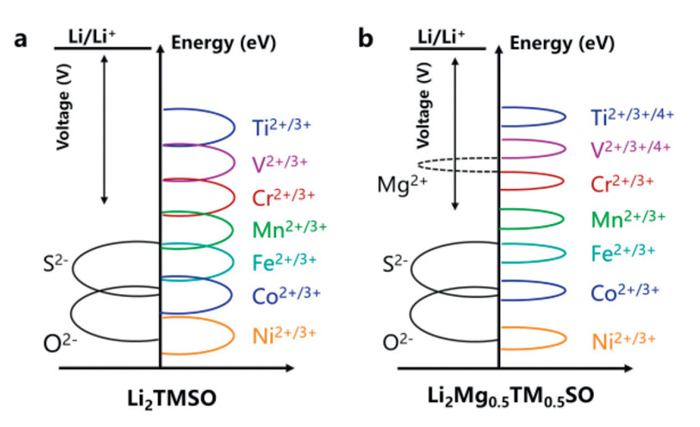
In Fig. 5, we present a detailed distribution of the electronic orbital energy levels for TM (Ti–Ni) alongside the corresponding energy levels of the S–3p and O–2p orbitals. Our study reveals that the voltage of the Li2TMSO material is determined by the interplay between the TM–3d and S–3p orbitals, manifesting in two primary scenarios: First, when there is a significant energy difference between the TM–3d and S–3p orbitals, the voltage is predominantly governed by the TM–3d orbitals (e.g., for TM = Ti, V, Cr). Second, when the energy level of the TM–3d orbitals is close to or even lower than that of the S–3p orbitals, both orbitals jointly influence the voltage. This indicates that the S–3p orbitals impose a limitation on the voltage enhancement of Li2TMSO. For Mg-doped systems, the doping facilitates the involvement of electrons from deeper energy levels, thereby increasing the voltage. For instance, in the Ti system, where the energy difference between the Ti–3d and S–3p orbitals is substantial, Mg doping enables the transition of Ti from a Ti2+ to a Ti4+ oxidation state. Consequently, deeper Ti–3d electrons participate in the reaction, leading to a higher voltage. These findings suggest that enhancing the voltage of such materials requires a comprehensive approach that considers both the structural changes induced by the cooperative reaction of anions and cations and strategies to maintain cycle stability.
Li-ion transport in cathodes is a critical factor for achieving high-rate capability. In the case of Li2FeSO, it exhibits a capacity of 270 mA/g at 0.1 C, whereas at 1 C, its capacity drops to 200 mA/g [33]. This indicates the need to improve Li-ion transport capability for high rates. As shown in Fig. 6, we identified the Li-ion migration path based on the stable ground-state structure. Li-ion diffusion was hindered by neighboring atoms. Therefore, we explored element doping to modify the local channel for Li-ion transport. Considering that element doping methods are widely used to enhance the ionic transport performance of battery materials [34–37]. We considered five different elements (N, P, F, Cl, Br) for doping at the S and O sites in Li2FeSO and Li2MnSO. Besides, Na and K were chosen for TM-site doping.
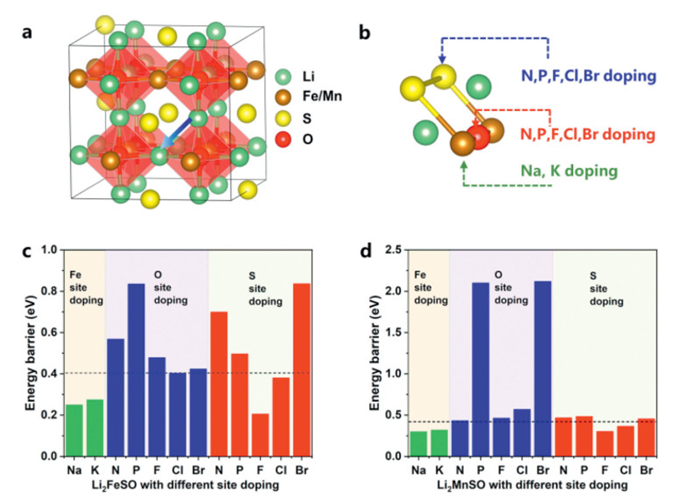
In Figs. 6c and d, the energy barriers for Li-ion migration are 0.40 eV and 0.42 eV for Li2FeSO and Li2MnSO, respectively. O-site doping in Li2FeSO did not significantly change the Li-ion transport barriers, with the lowest values observed in Li2FeSO7/8Cl1/8 (0.41 eV) and Li2FeSO7/8Br1/8 (0.43 eV). In contrast, S-site doping proved effective in regulating Li-ion migration barriers. Li2FeS7/8F1/8O and Li2FeS7/8Cl1/8O exhibited migration barriers of 0.21 eV and 0.38 eV, respectively. Anion-site doping in Li2MnSO displayed effect as in Li2FeSO. Regarding TM-site doping, Na and K reduced Li-ion migration barriers in Li2Fe7/8Na1/8SO, Li2Fe7/8K1/8SO, Li2Mn7/8Na1/8SO, and Li2Mn7/8K1/8SO, with barriers of 0.25, 0.28, 0.30, and 0.32 eV, respectively. To understand the reduction in Li-ion migration barriers due to F, Cl, Na, and K doping, we examined the size of the Li-ion migration channel (Fig. S9 in Supporting information). Doping with these elements increases the size of the channel, reducing repulsion during Li-ion migration and resulting in lower migration barriers.
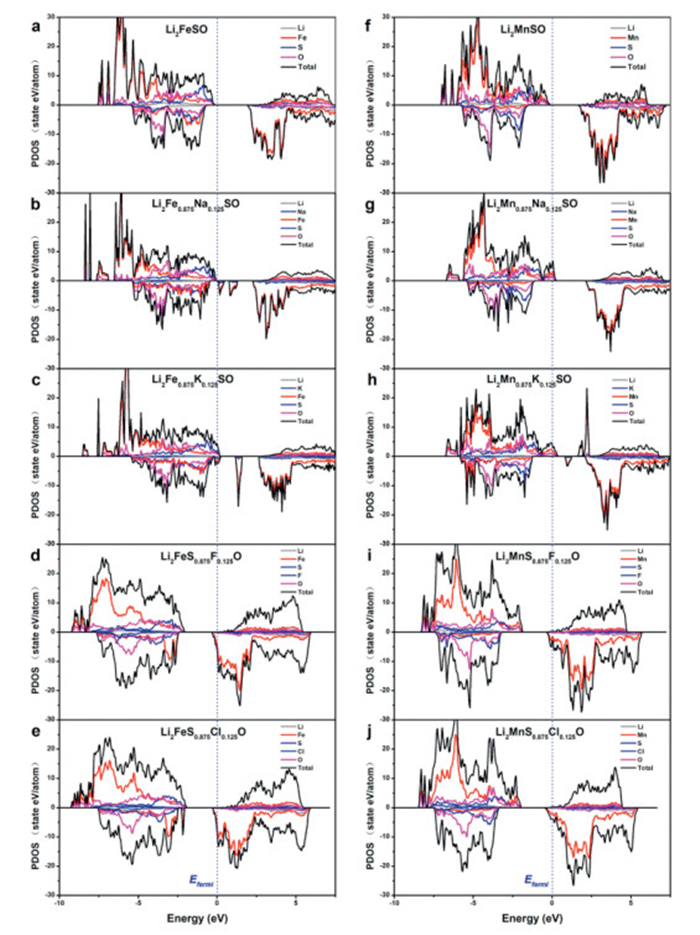
To achieve high-rate performance in battery materials, it is crucial to ensure robust electronic conductivity. Fig. 7a illustrates that Li2FeSO possesses a band gap of 2.19 eV, with the Fe-3d states predominantly influencing the DOS near the Fermi level. The DOS near the Fermi level are dominated by the Fe-3d state and the S-3p state, and the DOS with the lowest energy level above the Fermi level are mainly contributed by the Fe-3d electronic orbital. When Li2FeSO is doped with elements such as Na, K, F, and Cl, as depicted in Figs. 7b-e, it undergoes a transition to a metallic state. This is due to the addition/removal of valence electrons in the system after doping with these elements, which causes the Fermi level to shift upward/downward. In the case of anion doping with F or Br, this transition primarily arises from the substitution of monovalent anions (F or Br) for divalent sulfur (S), which introduces an additional valence electron into the system. This additional electron predominantly localizes in the Fe-3d orbitals, contributing to the shift towards a metallic state. This indicates that the Fe-3d orbitals have gained electrons. On the other hand, when Na and K are used for doping, they supply fewer valence electrons to the system compared to Fe and Mn. In order to maintain the charge balance, the other atoms undergo a partial valence and lose electrons. Therefore, the band-edge states of the Fe-3d orbital appear in Figs. 7b and c, and the band gap is reduced. Consequently, this leads to a downward shift of the Fermi level, ultimately resulting in the formation of a metallic state. A similar trend is observed with element doping in Li2MnSO (Figs. 7f-j). A smaller band gap or metallic state indicates an increase in the electronic conductivity of the doped material. This suggests that doping with Na, K, F, and Cl can enhance the electronic conductivity and improve the electrochemical performance of Li2TMSO (TM = Fe, Mn).
We also investigated the impact of elemental doping in Li2TMSO on voltage and energy density (Fig. S10 in Supporting information). The calculations indicate that Na, K, and F doping can enhance the voltage, with all three elements raising the voltage above 3 V. In terms of energy density, the lighter atomic masses of Na and K compared to Fe and Mn, as well as the lighter mass of F compared to S, combined with the increase in voltage, significantly improve the energy density of the material. This further demonstrates that doping with Na, K, and F can effectively enhance the electrochemical performance of the material, thereby promoting its potential applications in Li-ion batteries.
In this work, we systematically investigated the influence of element substitution and doping on both the voltage characteristics and Li-ion transport properties of anti-perovskite cathodes. Our findings revealed that Se and Te substitutions for S resulted in reduced voltage. For the TM element replacement, we observed a voltage increase as the atomic number rose from Ti to Ni, which was linked to decreased 3d orbital energy levels. The energy level difference between the TM-3d orbital and the S-3p orbital determines which electron orbital participates in the reaction. When the energy level difference is large, the TM-3d orbital mainly participates in the reaction and determines the voltage. The electronic states near the Fermi level are also mainly contributed by the TM-3d orbitals. When the energy level difference is small, the TM-3d orbital and the S-3p orbital participate in the reaction and jointly determine the voltage. In addition, the co-doping of inactive Mg and TM can promote the participation of electrons at deep energy levels in the reaction and increase the voltage. Anion-site doping with F and Cl and TM-site doping with Na and K led to significant reductions in Li-ion transport barriers, thereby improving transport properties. Our examination of the transport channel structure indicated that F, Cl, Na and K doping expanded the channel size, promoting Li-ion diffusion. Additionally, F, Cl, Na and K doping substantially improved electronic conductivity. These findings collectively enhance our understanding of how to design and optimize anti-perovskite cathodes for advanced battery applications.
The authors declare that they have no known competing financial interests or personal relationships that could have appeared to influence the work reported in this paper.
Dixing Ni: Writing – review & editing, Writing – original draft, Investigation, Data curation, Conceptualization. Jiarui Qi: Writing – original draft, Methodology, Investigation. Zhi Deng: Data curation, Conceptualization. Dong Ding: Project administration, Funding acquisition, Formal analysis, Data curation. Rui Wang: Writing – review & editing, Visualization. Wenjie Zhou: Formal analysis, Conceptualization. Sisi Zhou: Software, Resources, Funding acquisition. Yang Sun: Writing – review & editing, Project administration, Investigation. Shuai Li: Writing – original draft, Project administration, Methodology, Investigation, Funding acquisition. Zhaoxiang Wang: Writing – original draft, Visualization, Supervision.
This work was financially supported by the Program of the National Natural Science Foundation of China (No. 22209067), Stable Support Plan Program for Higher Education Institutions (No. 20220814235931001), Shenzhen Science and Technology Program (No. KQTD20200820113047086). R. Wang was supported by XXX-Project (No. 2020-XXXX-XX-246-00). Y. Sun was supported by the Fundamental Research Funds for the Central Universities, Sun Yat-sen University (No. 22hytd01). This work was supported by 21C Innovation Laboratory, Contemporary Amperex Technology Ltd. (No. C-ND-21C LAB-210044-1.0), and by Center for Computational Science and Engineering at Southern University of Science and Technology.
Supplementary material associated with this article can be found, in the online version, at doi:
B. Scrosati, J. Garche, J. Power Sources 195 (2010) 2419–2430.
J.M. Tarascon, M. Armand, Nature 414 (2001) 359–367.
J.B. Goodenough, Y. Kim, Chem. Mater. 22 (2010) 587–603. doi: 10.1021/cm901452z
A. Manthiram, Nat. Commun. 11 (2020) 1550.
K. Mizushima, P.C. Jones, P.J. Wiseman, J.B. Goodenough, Mater. Res. Bull. 15 (1980) 783–789.
M.M. Thackeray, W.I.F. David, P.G. Bruce, J.B. Goodenough, Mater. Res. Bull. 18 (1983) 461–472.
A.K. Padhi, K.S. Nanjundaswamy, J.B. Goodenough, J. Electrochem. Soc. 144 (1997) 1188–1194. doi: 10.1149/1.1837571
A. Manthiram, JOM 49 (1997) 43–46.
K.T. Lai, I. Antonyshyn, Y. Prots, M. Valldor, J. Am. Chem. Soc. 139 (2017) 9645–9649. doi: 10.1021/jacs.7b04444
K.T. Lai, I. Antonyshyn, Y. Prots, M. Valldor, Inorg. Chem. 57 (2018) 13296–13299. doi: 10.1021/acs.inorgchem.8b01850
M.V. Gorbunov, S. Carrocci, S. Maletti, et al., Inorg. Chem. 59 (2020) 15626–15635. doi: 10.1021/acs.inorgchem.0c01753
Z. Deng, D. Chen, M. Ou, et al., Adv. Energy Mater. 13 (2023) 2300695.
M.V. Gorbunov, S. Carocci, I.G. Gonzalez Martinez, V. Baran, D. Mikhailova, Front. Energy Res. 9 (2021) 657962.
J.P. Perdew, K. Burke, M. Ernzerhof, Phys. Rev. Lett. 77 (1996) 3865–3868.
G. Kresse, J. Furthmuller, Phys. Rev. B: Condens. Matter. 54 (1996) 11169–11186.
P.E. Blöchl, Phys. Rev. B 50 (1994) 17953–17979.
G. Kresse, D. Joubert, Phys. Rev. B 59 (1999) 1758–1775.
G. Shao, J. Phys. Chem. C 113 (2009) 6800–6808. doi: 10.1021/jp810923r
A. Jain, G. Hautier, S.P. Ong, et al., Phys. Rev. B 84 (2011) 045115. doi: 10.1103/PhysRevB.84.045115
Z. Lu, F. Ciucci, J. Mater. Chem. A 6 (2018) 5185–5192. doi: 10.1039/c7ta11074j
J. Heyd, G.E. Scuseria, M. Ernzerhof, J. Chem. Phys. 118 (2003) 8207–8215.
H.J. Monkhorst, J.D. Pack, Phys. Rev. B 13 (1976) 5188–5192.
S.P. Ong, W.D. Richards, A. Jain, et al., Comput. Mater. Sci. 68 (2013) 314–319.
G. Henkelman, B.P. Uberuaga, H. Jónsson, J. Chem. Phys. 113 (2000) 9901–9904.
M.V. Gorbunov, O. Janson, M. Stöber, V. Baran, D. Mikhailova, J. Mater. Chem. A 12 (2024) 13890–13900. doi: 10.1039/d4ta00153b
J. Cho, T.J. Kim, J. Kim, M. Noh, B. Park, J. Electrochem. Soc. 151 (2004) A1899.
Z. Lu, D.D. MacNeil, J.R. Dahn, Electrochem. Solid-State Lett. 4 (2001) A200–A201.
A. Yamada, S.C. Chung, K. Hinokuma, J. Electrochem. Soc. 148 (2001) A224.
S. Kirklin, J.E. Saal, B. Meredig, et al., NPJ Comput. Mater. 1 (2015) 15010.
H. Gerischer, F. Decker, B. Scrosati, J. Electrochem. Soc. 141 (1994) 2297–2330. doi: 10.1149/1.2055115
S. Schuld, R. Hausbrand, M. Fingerle, W. Jaegermann, K.M. Weitzel, Adv. Energy Mater. 8 (2018) 1703411.
Z. Wang, D. Wang, Z. Zou, et al., Nat. Sci. Rev. 7 (2020) 1768–1775. doi: 10.1093/nsr/nwaa174
D. Mikhailova, L. Giebeler, S. Maletti, et al., ACS Appl. Energy Mater. 1 (2018) 6593–6599. doi: 10.1021/acsaem.8b01493
J. Ke, Y. Zhang, Z. Wen, et al., J. Mater. Chem. A 11 (2023) 4428–4457. doi: 10.1039/d2ta09502e
K. Wang, C. Gao, J. Tu, K. Guo, Y.L. Ding, J. Mater. Chem. A 12 (2024) 6681–6692. doi: 10.1039/d3ta07300a
C. Zhu, T. Long, B. Feng, et al., Small 19 (2023) e2207716.
Y. Yao, Z. Xue, C. Li, et al., Energy Storage Mater. 71 (2024) 103666.

Figure 1 (a) Structure of the primitive cell of Li2FeSO with mixed occupancy of Li and Fe. (b) Ground state structure of the 2 × 2 × 2 supercell of Li2FeSO.

Figure 2 Theoretical voltage curves for (a) Li2FeSO, (b) Li2MnSO, (c) Li2FeSeO, (d) Li2MnSeO, (e) Li2FeTeO and (f) Li2MnTeO.

Figure 3 Voltage heat map depicting Li2TM0.5TM0.5SO characteristics after extracting one Li per formula unit (TM = Ti, V, Cr, Mn, Fe, Co, Ni, Mg, Cu).

Figure 4 (a) Correlation between the TM-3d band center energy level and the voltage for Li2TMSO. (b) The TM-3d, S-3p, and O-2p band center energy levels in Li2TMSO. (c) Energy level differences between TM-3d and S-3p orbitals. (d) Energy level differences between TM-3d and O-2p orbitals.

Figure 5 Schematic diagram of the relationship between electron orbital energy levels and the voltage. (a) Li2TMSO. (b) Li2Mg0.5TM0.5SO.

Figure 6 (a) The 2 × 2 × 2 supercell structure of Li2FeSO and Li2MnSO. (b) Li migration bottleneck, composed of two S atoms, two TM atoms, and one O atoms. Strategies for S-site doping, O-site doping, and TM-site doping are provided. (c, d) Li migration energy barriers with different element doping in Li2FeSO and Li2MnSO, with black dotted lines denoting the migration barriers of undoped Li2FeSO and Li2MnSO.

 扫一扫看文章

扫一扫关注我们
 DownLoad:
 下载:
下载:
