Figure 1.
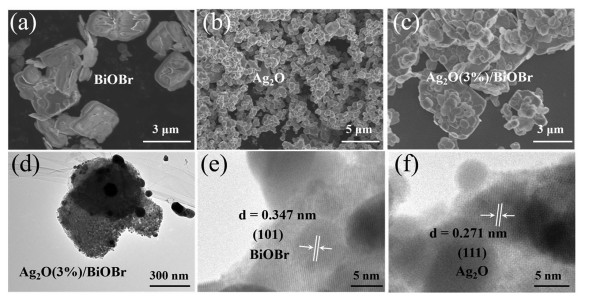
SEM images of BiOBr (a), Ag2O (b) and Ag2O(3%)/BiOBr (c). TEM images of Ag2O(3%)/BiOBr (d), HRTEM images of Ag2O(3%)/BiOBr (e, f).
Efficient removal for multiple pollutants via Ag2O/BiOBr heterojunction: A promoted photocatalytic process by valid electron transfer pathway
Zhiruo Zhou , Yanan Li , Mingmei Li , Yi Li , Sihui Zhan

Shortage of fresh water has become a world-wide problem because of industrialization, urbanization and populations [1]. However, most water resources are suffering both pathogenic microorganism and chemical pollutants [2]. Pathogenic microorganism and chemical pollutants could cause serious consequence. Pathogenic microorganism contaminations like Escherichia coli (E. coli) and Staphylococcus aureus (S. aureus) cause millions of deaths, diseases and disabilities every year. Chemical pollutants, like emerging organic contaminants (EOCs), are natural products or artificially synthesized that could break into the environment and cause environmental and ecological risks. Tetracycline (antibiotic) and acetaminophen (anti-inflammatory analgesic) are EOCs that were widely detected in surface water, underground water and drinking water [3, 4]. In Haihe River (Tianjin, China), antibiotic concentration reached up to 1.30176 ng/L [5]. However, wastewater treatment plants (WWTPs) have not aimed to remove pathogenic microorganism and EOCs [6, 7], causing low removal efficiencies for the pollutants and potential threat to the environment.
Thus, it is urgent to develop advanced technologies to solve the pollution situation. As one of these technologies, advanced oxidation process (AOP) has attracted wide attention. AOP like photocatalysis could efficiently remove pathogenic microorganism and deeply mineralize chemical contaminations using high oxidation potential radicals like ·OH, O2·-, 1O2 [8-11]. However, photocatalysis also faces challenges: Promotion of the separation and reduction of combination between photo-generated electrons and holes [12-15]. Therefore, it is necessary to develop novel photocatalysts.
A family of ternary layered semiconductor photocatalysts bismuth oxyhalides BiOBr have attracted considerable attentions because of their extraordinary photocatalytic ability of under visible light [16, 17]. BiOBr is a p type semiconductor, forming a tetragonal matlockite structure. Broad range of visible light response, favorable electro conductibility and high quantum efficiency make BiOBr excellent performance in contaminants treatments [18-20]. However, pure BiOBr is limited because of low efficiency in light absorbance, photo-generated charges and holes recombine at a high speed. Therefore, further improvement is needed to improve pure BiOBr. Silver(I) oxide (Ag2O) has been recognized as one of the most promising candidates which can couple with BiOBr due to the narrow band gap (1.2 eV), simple preparation and excellent light absorption capacity [21-23]. Considering these favorable attributes, Ag2O has attracted many research attentions in environmental remediation [21]. However, Ag2O often suffers from photocorrosion and poor capability to separate electron-hole pairs, and thus its practical applications were limited [24, 25]. Based on previous study, construction of the heterostructures between two semiconductors can remarkably increase light harvesting efficiency and speed up charge separation and transfer effectively. Therefore, it is possible to improve the photocatalytic activity of BiOBr and overcome the weak stability of Ag2O by constructing Ag2O/BiOBr heterojunction photocatalyst.
Herein, a range of Ag2O/BiOBr heterojunction photocatalyst was successfully prepared. The photocatalytic behaviors of prepared samples against E. coli, S. aureus, tetracycline and acetaminophen irradiated by visible light were studied. In contrast to pure Ag2O and BiOBr, Ag2O/BiOBr photocatalyst showed high disinfection activity with the optimal Ag2O amounts of 3 wt%. Results showed that the outstanding photocatalytic effect was ascribed to the synergetic effect from Ag2O and BiOBr, Ag2O was able to "catch" and "hold" electron due to higher work function and results of Mulliken charge population analysis, which resulted in rapid separation and transportation of photo-generated electrons-holes and less recombination. Active species trapping experiments and electron paramagnetic resonance confirmed that h+ and O2·- were the main active groups to attack pollutants. Ag2O/BiOBr was proved to a potential AOP material for WWTPs.
All chemicals are analytically pure and are used without further purification. Detailed informations of chemicals were given in the Text S1 (Supporting information). Detailed informations of synthesis of Ag2O/BiOBr, characterization and DFT computational methods etc. were given in Texts S2-7 (Supporting information).
The microstructure and morphology of BiOBr, Ag2O and the Ag2O(3%)/BiOBr composite were observed by scanning electron microscope (SEM), transmission electron microscope (TEM) and high resolution transmission electron microscope (HR-TEM). Fig. 1a shows a SEM image of BiOBr that consists of irregular square-like sheets with a diameter of about 5 μm. Fig. 1b shows the morphology of Ag2O, it can be seen that Ag2O particles are seriously aggregated together, and the size of individual Ag2O particle is about 200 nm. No significant difference is investigated between the pure BiOBr and Ag2O(3%)/BiOBr composite (Fig. 1c), indicating that the introduction of Ag2O has negligible effect on the morphology of BiOBr samples. As shown in Fig. 1d, Ag2O particles are dispersed on the surface of irregular square-like BiOBr, this phenomenon indicates that the aggregation of Ag2O particles can be inhibit, which can produce much more reactive heterojunction interface. Figs. 1e and f show typical HRTEM images of Ag2O(3%)/ BiOBr composite. The lattice spacing is 0.347 nm and 0.271 nm, which are in accordance with (101) BiOBr [26] and (111) Ag2O, respectively [27]. Energy dispersive X-ray spectra (EDS) of Ag2O (3%)/BiOBr are shown in Fig. S1 (Supporting information), Bi, Br, Ag and O could be found. The crystal structures of the as-prepared photocatalysts were studied by X-ray diffraction (XRD) and details were shown in Text S8 and Fig. S2a (Supporting information).
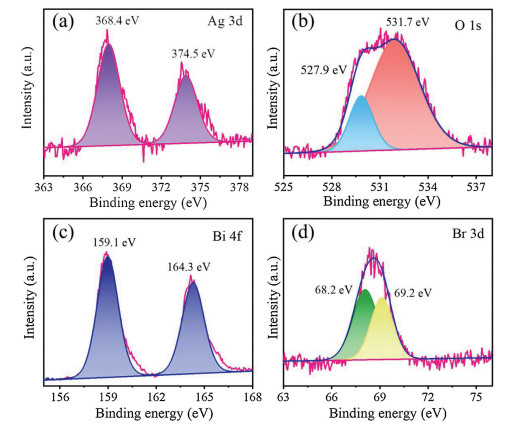
Chemical states and surface element composition of Ag2O, BiOBr and Ag2O(3%)/BiOBr samples are analyzed using XPS (XPS survey spectra and detailed analysis were given in Text S8 and Fig. S2b in Supporting information). In Fig. 2a, peaks of Ag 3d5/2 and Ag 3d3/2 are found at 368.4 eV and 374.5 eV, respectively, which are in accordance with the previous report about Ag2O [26]. O 1s spectra (Fig. 2b) shows two peaks at 527.9 eV and 531.7 eV respectively are attributed to absorbed hydroxyl and oxygen in Ag2O/BiOBr [26]. The Bi 4f7/2 and Bi 4f5/2 peaks show binding energy at 159.1 eV and 164.3 eV, respectively (Fig. 2c) [26]. Br 3d spectra shown in Fig. 2d shows two peaks at 68.2 and 69.2 eV respectively are attributed to Br 3d5/2 and Br 3d3/2 of Br- in BiOBr. The success of preparation of Ag2O(3%)/BiOBr is further testified in XPS analysis.
Nitrogen adsorption-desorption isotherm analysis was shown in Text S8, Table S1 and Fig. S3 (Supporting information).
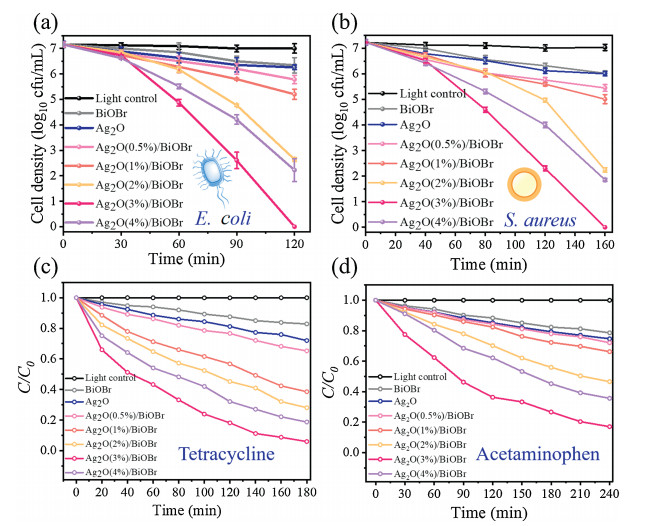
The photocatalytic activity of as-prepared photocatalysts (BiOBr, Ag2O, Ag2O(0.5%)/BiOBr, Ag2O(1%)/BiOBr, Ag2O(2%)/BiOBr, Ag2O(3%)/BiOBr and Ag2O(4%)/BiOBr) were observed by using E. coli, S. aureus, tetracycline and acetaminophen. As shown in Fig. S4a (Supporting information), all photocatalysts showed no removal efficiencies to E. coli in the dark, indicating the low cytotoxicity to E. coli in the absence of visible light. As shown in Figs. 3a-d, E. coli, S. aureus, tetracycline or acetaminophen were not removed without photocatalysts under visible light exposure (light control). In visible light exposure, BiOBr and Ag2O showed weak photocatalytic activity. For Ag2O/BiOBr with different content of Ag2O at 0.5%, 1%, 2%, 3%, 4%, log decrease of E. coli was 1.38, 1.96, 4.52, 7.16 (removal efficiency was 100%) and 4.94, respectively in 120 min of visible light exposure (Fig. 3a), log decrease of S. aureus was 1.78, 2.22, 4.99, 7.23 (removal efficiency was 100%), 5.38 respectively in 160 min of visible light exposure (Fig. 3b), C/C0 of tetracycline was 0.65, 0.39, 0.28, 0.06, 0.19 for photocatalysts respectively in 180 min of visible light exposure (Fig. 3c), C/C0 of acetaminophen was 0.72, 0.66, 0.47, 0.17, 0.36 for photocatalysts, respectively in 180 min of visible light exposure (Fig. 3d). The Ag2O (3%)/BiOBr exhibited the best photocatalytic activity despite its moderate Ag2O content, showed excellent performance in removal of pathogenic microorganism and emerging organic contaminations (EOCs).
Langmuir model was used to analyze photo-degradation kinetics of tetracycline and acetaminophen, more information was given in Text S9 and Fig. S5 (Supporting information).
Photocatalytic activity was obviously enhanced via combination of BiOBr and Ag2O. However, more doped Ag2O did not mean batter performance. It was possible that excess Ag2O occupied active center of BiOBr or act as the recombination center of charges and holes, resulting in worse photocatalytic activity. According to the above-mentioned performance, optimum doping content of Ag2O to BiOBr was 3%. Therefore, Ag2O(3%)/BiOBr was chosen for further study. Since removal efficiency of Ag2O(3%)/BiOBr on E. coli was the best (120 min reached up to 100%), E. coli was chosen as the model contaminant.
Adaptability, repeatability and stability of photocatalysis were confirmed to be in good quality by serial of experiments, specific details were shown in Text S10 and Figs. S4b-d (Supporting information).
Visualized death process of E. coli, fluorescent test and the morphologies of E. coli cells at different stages during the disinfection process were conducted. The trend was consistent with Fig. 3, details see Text S11 and Fig. S6 (Supporting information).
Scavengers tests in order to investigate the contribution of each reactive oxygen species (ROS) and electron spin-resonance spectroscopy (ESR) spectra to prove the existence of ·OH and O2·- generated by Ag2O(3%)/BiOBr was conducted and particular analysis was given in Text S12 and Figs. S7a-c (Supporting information).
To prove the important role that ROS played, superoxide dismutase (SOD) and catalase (CAT) tests were conducted. SOD and CAT are two important antioxidant enzymes in bacteria, which can protect bacteria from ROS (like ·OH and O2·-) stress. They can be considered as effective indicators of oxidative stress of cells when bacteria are exposed to adverse conditions such as UV and disinfectant. Figs. 4a and b showed the activity level of SOD and CAT produced by E. coli induced by Ag2O(3%)/ BiOBr during photocatalysis. The activity of SOD and CAT showed the same trend, they increased rapidly from 0 to 20 min, and reached the maximum value in 20 min. That means in the initial stage of the disinfection process, E. coli produces the most SOD and CAT, which is the inherent defensive behavior of E. coli, protecting cells from the destruction of active oxidants such as O2·- and H2O2. After 20 min of illumination, the activity of SOD and CAT decreases with the increase of sterilization efficiency, which means the SOD and CAT activity decreases with the increase of sterilization efficiency. The increase of efficiency leads to the decrease, which means that the oxidation pressure caused by the ROS produced by Ag2O(3%)/BiOBr exceeds the self-defense of E. coli, resulting in large-batch death of E. coli. The important role of ROS played in bacteria removal process has been confirmed by this work.

Photoluminescence (PL) spectra of the photocatalysts can provide information about the separation and recombination of photo-induced charge carriers [28, 29]. Fig. 5a showed the PL spectra of pure BiOBr and Ag2O/BiOBr composites with an excitation wavelength of 368 nm and emission wavelength of 474 nm. Pure BiOBr showed the highest PL intensity, revealing the highest recombination rate of the photoexcited charge carriers. It could be seen that the emission peak intensities of the Ag2O/BiOBr composites were weaker than that of pure BiOBr, which suggested that the doping of Ag2O could effectively prevent the e--h+ recombination rate. Ag2O(3%)/BiOBr showed the lowest peak intensity, which corresponded to its best photocatalytic activity (Fig. 3).

Time-resolved PL decay spectra of BiOBr, Ag2O and Ag2O(3%)/ BiOBr was shown in Fig. 5b. When introduced Ag2O into BiOBr, the electronic life was obviously lengthened, electronic life of Ag2O (3%)/BiOBr was 2.16 ns, which was 1.17 times compared with BiOBr. That indicated less combination of electron and holes, and ROS generated ability was improved.
The transient photocurrent generations were conducted for BiOBr and Ag2O(3%)/BiOBr electrodes to evaluate the separation ability of photogenerated electron-hole pairs. As shown in Fig. 5c, under visible light irradiation, a prompt and steady photocurrent generation was observed during several on and off cycles. Compared with pure BiOBr, Ag2O(3%)/BiOBr composites exhibited significantly enhanced photocurrent intensity, illustrating a longer lifetime of photoexcited charge carriers for Ag2O(3%)/BiOBr composites. Generally, the photogenerated electrons and holes would recombine fast and result in relative low photocurrent intensity [27]. When Ag2O particles were modified on the surface of BiOBr to form intimate heterostructure, the effective separation of photogenerated charge carriers was followed as a result.
To investigate the charge carrier transfer process, the typical Nyquist plots of pure BiOBr and Ag2O(3%)/BiOBr have been performed. It could be seen from Fig. 5d that Ag2O(3%)/BiOBr photocatalyst exhibited smaller arc radius as compared to pure BiOBr, which indicated that Ag2O(3%)/BiOBr composites possessed lower interface electron transfer resistance than pure BiOBr and the higher separation rate of photogenerated charge carriers. And thus the photocatalytic activity of Ag2O(3%)/BiOBr composite was improved.
UV–vis diffuse reflectance was used to investigate the optical properties of photocatalyst. The ability of absorbing visible light of the Ag2O/BiOBr composites was significantly improved compared with Ag2O and BiOBr as shown in Fig. S8a (Supporting information). Band gap energy (Eg) was calculated via Kubelt-Munk method. As shown in Figs. S8b and c (Supporting information), Eg of Ag2O and BiOBr was 1.25 and 2.90 eV, respectively. More information was given in Text S13 (Supporting information).
Ultraviolet photoelectron spectroscopy (UPS) spectra was applied to investigate the valence gap and work function of BiOBr and Ag2O. As shown in Fig. 6, valence gap with the edge of maximum energy of BiOBr and Ag2O was 2.28 and 1.40 eV, respectively. UPS photoelectron spectroscopy has a threshold value of Ecutoff at the low kinetic energy end, which corresponds to the cut-off of secondary electron emission. Based on Einstein law, work function and Ecutoff are related as follow (Eq. 1):

|
|
(1) |
In which hv was based on excitation energy. In this work, the HeI ultraviolet light was used as excitation energy, and hv = 21.22 eV. Work function of BiOBr and Ag2O was 7.38 and 8.40 eV, respectively. The value of work function indicates the binding strength of electron in catalysis. Larger work function represents better ability to hold or catch electron. Therefore, in Ag2O/BiOBr heterostructure, electron would transfer from BiOBr to Ag2O, and stored by Ag2O.
To further confirm the conclusion, charge density difference of Ag2O/BiOBr was determined by density functional theory (DFT) calculation. The exposed lattice of each semiconductor was based on the TEM images mentioned above. According tothe DFTcalculations, it has been determined that the Br-terminated 12-layer BiOBr (101) surface is less stable than Bi-terminated 12-layer BiOBr(101)surface. Hence, only the stable one is considered in this work. Mulliken charge population analysis was adopted. Based on DFT calculation results, Mulliken charge population of Ag in Ag2O was 0.33~0.35 e, O in Ag2O was -0.70~ -0.65 e (Fig. 7a). In BiOBr, Mulliken charge population of Bi was 1.27–1.42 e, O was -1.00~ -0.90 e, Br -4.70~ -0.35 e (Fig. 7b). Optimized Br-terminated BiOBr (101) surface was shown in Fig. S9 (Supporting information). In Fig. 7c, it can be seen that there were two types of charge transfer channels, Ag to Br and O to Bi. Totally, the electron transfer direction of this interface is from the substrate BiOBr to Ag2O, which makes the charge of BiOBr was 2.38 e, and Ag2O was -2.38 e. Thus, the electron transfer direction was further confirmed: from BiOBr to Ag2O. Ag2O would act as an "electron storage", reduced the combination of electron and holes, promote the photocatalytic activity.

Based on the results of various characterization analysis, the mechanism of enhanced photocatalytic performance of Ag2O (3%)/BiOBr photocatalyst under visible light irradiation was proposed and elucidated in Fig. S10 (Supporting information). The values of conduction band (CB) and valence band (VB) of Ag2O were 0.2 eV and 1.4 eV [30], respectively. The value of CB and VB of BiOBr were -0.53 eV and 2.28 eV [26], respectively. When the visible light hit the surface of Ag2O(3%)/BiOBr, both Ag2O and BiOBr could be excited to generate electrons (e-) and holes (h+) [31]. Meanwhile, ECB of BiOBr (-0.53 eV vs. NHE) was negative than that of Ag2O (0.20 eV vs. NHE), and EVB of BiOBr (2.28 eV vs. NHE) was positive than that of Ag2O (1.40 eV vs. NHE). Take into consideration of the inner electric field and energy band structure of Ag2O/BiOBr photocatalyst. Thus, the enhanced photocatalytic activity of Ag2O/BiOBr photocatalyst was attributed to the efficient separation of photogenerated electrons and holes. The photogenerated electrons on CB of BiOBr might be captured by O2 to generate O2·- (O2/O2·- = -0.16 eV vs. NHE). In addition, considering the potentials of OH-/·OH (2.40 eV vs. NHE) were positive than the VB of Ag2O and BiOBr, which could not oxidize OH- to generate ·OH. Instead, ·OH might generate from O2·-. Ag+ in Ag2O may partially reduce to metallic Ag by photogenerated electrons on the CB of Ag2O. The formed Ag0 could acts as an electron pool and transfer electrons from Ag2O to combine with O2 to produce O2·-. Subsequently, the produced O2·- could combine with H2O to be further form ·OH.
In summary, a novel Ag2O/BiOBr heterojuction photocatalyst were successfully constructed via in-situ loading Ag2O onto BiOBr sheets. Ag2O/BiOBr photocatalyst exhibited outstanding photocatalytic efficiency to remove E. coli, S. aureus, tetracycline and acetaminophen compared with pure Ag2O or BiOBr. The photocatalyst was adaptive to complicated and changeable conditions in natural waters. The outstanding photocatalytic effect was ascribed to the synergetic effect from Ag2O and BiOBr, Ag2O was able to "catch" and "hold" electron due to higher work function and results of Mulliken charge population analysis, which resulted in rapid separation and transportation of photogenerated electrons-holes and less recombination. Active species trapping experiments and electron paramagnetic resonance confirmed that h+ and O2·- were the main active groups. In consideration of the excellent removal efficiency to multiple pollutants, it is expected that the Ag2O/BiOBr materials could be used as a promising AOP material for environmental remediation and WWTPs application.
The authors declare no conflict of interest.
The authors gratefully acknowledge the financial support by the National Natural Science Foundation of China as general projects (Nos. 21722702 and 21677080), the Tianjin Commission of Science and Technology as Key Technologies R&D Projects (Nos.118YFZCSF00730, 18YFZCSF00770 and 18ZXSZSF00230).
Supplementary material related to this article can be found, in the online version, at doi:https://doi.org/10.1016/j.cclet.2020.07.003.
D. Xia, W. Wang, R. Yin, et al., Appl. Catal. B:Environ. 214 (2017) 23-33. doi: 10.1016/j.apcatb.2017.05.035
B.W. Grehs, A.R. Lopes, N.F. Moreira, et al., Water Res. 166 (2019)115056. doi: 10.1016/j.watres.2019.115056
J. Lu, Y. Zhang, J. Wu, J. Wang, Y. Cai, J. Hazard. Mater. 382 (2020)121025. doi: 10.1016/j.jhazmat.2019.121025
Q. Chen, L. Chen, J. Qi, et al., Chin. Chem. Lett. 30 (2019) 1214-1218. doi: 10.1016/j.cclet.2019.03.002
S. Li, W.Z. Shi, W. Liu, et al., Sci. Total Environ. 615 (2018) 906-917. doi: 10.1016/j.scitotenv.2017.09.328
X. Wu, J. Pan, M. Li, et al., Water Res. 165 (2019)114979. doi: 10.1016/j.watres.2019.114979
W. Wang, T. An, G. Li, et al., Appl. Catal. B:Environ. 217 (2017) 570-580. doi: 10.1016/j.apcatb.2017.06.027
X. Luo, X. Wei, J. Chen, et al., Water Res. 166 (2019)115083. doi: 10.1016/j.watres.2019.115083
W. Liu, W. Zhang, M.S. Liu, et al., Chin. Chem. Lett. 30 (2019) 2177-2180. doi: 10.1016/j.cclet.2019.07.050
F. Chen, X. Yang, Q. Wu, Environ. Sci. Technol. 43 (2009) 4606-4611. doi: 10.1021/es900505h
X.F. Li, X.B. Liu, J.Y. Chao, et al., Sci. China Chem. 62 (2019) 1634-1638. doi: 10.1007/s11426-019-9600-2
S.L. Ma, S.H. Zhan, Y.N. Jia, Q.X. Zhou, ACS Appl. Mater.Inter. 7 (2015) 21875-21883. doi: 10.1021/acsami.5b06264
Z. Zhang, W. Wang, E. Gao, S. Sun, L. Zhang, J. Phys. Chem. C 116 (2012) 25898-25903. doi: 10.1021/jp309719q
F. Xiong, Z. Wang, Z. Wu, et al., Sci. China Chem. 62 (2019) 199-204. doi: 10.1007/s11426-018-9377-x
H.D. Ji, Y.M. Zhu, J. Duan, et al., Chin. Chem. Lett. 30 (2019) 2163-2168. doi: 10.1016/j.cclet.2019.06.004
H. Li, J. Shang, Z. Ai, L. Zhang, J. Am. Chem. Soc. 137 (2015) 6393-6399. doi: 10.1021/jacs.5b03105
H. Li, J. Li, Z. Ai, F. Jia, L. Zhang, Angew. Chem. Int. Ed. 57 (2018) 122-138. doi: 10.1002/anie.201705628
D. Yue, T. Zhang, M. Kan, X. Qian, Y. Zhao, Appl. Catal. B:Environ.183 (2016) 1-7. doi: 10.1016/j.apcatb.2015.10.020
W. Guo, Q. Qin, L. Geng, et al., J. Hazard. Mater. 308 (2016) 374-385. doi: 10.1016/j.jhazmat.2016.01.077
X. Xiong, L. Ding, Q. Wang, et al., Appl. Catal. B:Environ. 188 (2016) 283-291. doi: 10.1016/j.apcatb.2016.02.018
S. Yang, D. Xu, B. Chen, B. Luo, W. Shi, Appl. Catal. B:Environ. 204 (2017) 602-610. doi: 10.1016/j.apcatb.2016.10.013
M. Yang, Q. Yang, J. Zhong, et al., Appl. Surf. Sci. 416 (2017) 666-671. doi: 10.1016/j.apsusc.2017.04.206
M.W. Ma, D.H. Kuo, J. Hazard, Mater. 301 (2016) 84-91.
J. Chen, H. Che, K. Huang, C. Liu, W. Shi, Appl. Catal. B:Environ. 192 (2016) 134-144. doi: 10.1016/j.apcatb.2016.03.056
J. Roithová, D. Schröder, J. Am. Chem. Soc. 129 (2007) 15311-15318. doi: 10.1021/ja075628p
J. Di, J. Xia, M. Ji, et al., Appl. Catal. B:Environ. 183 (2016) 254-262. doi: 10.1016/j.apcatb.2015.10.036
W. Liu, W. Zhang, M.S. Liu, et al., Chin. Chem. Lett. 30 (2019) 2177-2180. doi: 10.1016/j.cclet.2019.07.050
H.T. Ren, S.Y. Jia, J.J. Zou, S.H. Wu, X. Han, Appl. Catal. B:Environ. 176 (2015) 53-61.
H.D. Ji, P.H. Du, D.Y. Zhao, et al., Appl. Catal. B:Environ. 263 (2020) 118357. doi: 10.1016/j.apcatb.2019.118357
Y. Chen, G. Zhu, M. Hojamberdiev, et al., J. Hazard. Mater. 344 (2018) 42-54. doi: 10.1016/j.jhazmat.2017.10.015
X.J. Wen, C.G. Niu, L. Zhang, C. Liang, G.M. Zeng, Appl. Catal. B:Environ. 221 (2018) 701-714. doi: 10.1016/j.apcatb.2017.09.060

Figure 1 SEM images of BiOBr (a), Ag2O (b) and Ag2O(3%)/BiOBr (c). TEM images of Ag2O(3%)/BiOBr (d), HRTEM images of Ag2O(3%)/BiOBr (e, f).

Figure 3 (a) Inactivation efficiency against E. coli (107 cfu/mL) with photocatalysts (100 μm/mL). (b) Inactivation efficiency against S.aureus (107 cfu/mL) with as-prepared photocatalysts (100 μm/mL). (c) Removal efficiency against tetracycline (60 μm/mL) with as-prepared photocatalysts (100 μm/mL). (d) Removal efficiency against acetaminophen (5 μm/mL) with as-prepared photocatalysts (100 μm/mL).

Figure 4 SOD (a) and CAT (b) activities during photocatalytic disinfection process against E. coli (108 cfu/mL).

Figure 5 (a) Photoluminescence (PL) spectra of the as-prepared samples. (b) Time-resolved PL decay spectra. (c) Transient photocurrent and (d) EIS Nyquist plots of BiOBr and Ag2O(3%)/BiOBr.

Figure 7 (a) Optimized Ag2O (111) surface and the calculated Mulliken charge population. Silver and red balls represent Ag and O atoms, respectively. (b) Optimized Bi-terminated BiOBr(101) surface and thecalculated Mulliken charge population. Purple, brown and red balls represent Bi, Brand O atoms, respectively. (c) Optimized Br-terminated BiOBr (101) surface. Purple, brown and red balls represent Bi, Br and O atoms, respectively. The total energy of this structure is 4 meV higher than the structure in (b).

 扫一扫看文章

扫一扫关注我们
 DownLoad:

 下载:
下载:

