Key Laboratory of Mass Spectrometry Imaging and Metabolomics (Minzu University of China), State Ethnic Affairs Commission, Beijing 100081, China
b.
College of Life and Environmental Sciences, Centre for Imaging & Systems Biology, Minzu University of China, Beijing 100081, China
* Corresponding author at: Key Laboratory of Mass Spectrometry Imaging and Metabolomics (Minzu University of China)
State Ethnic Affairs Commission
Beijing 100081
China. E-mail address: Xiaodong@muc.edu.cn (X. Wang). 1 These authors contributed equally to this work.
Received Date:
03 June 2023 Accepted Date:
12 September 2023 Revised Date:
21 August 2023 Available Online:
15 June 2024
Abstract:
Low-molecular-weight (LMW) compounds are ubiquitous in living organisms and play essential roles in biological processes. The direct analysis of LMW compounds in biological tissues by matrix-assisted laser desorption/ionization mass spectrometry imaging (MALDI-MSI) could provide a more comprehensive understanding of their essential functions. Here, we evaluated 4-nitrocatechol (4-NC) as a novel positive-ion matrix for enhancing in situ detection and imaging of LMW compounds from the rat liver, brain, and germinating Chinese-yew seed by MALDI-MS. Our results showed that the 4-NC possessed remarkable features, including strong ultraviolet absorption, uniform matrix crystal, excellent chemical stability, and fewer matrix-related background peaks. The use of 4-NC led to the successful detection of 232, 218, and 193 LMW compounds from the three abovementioned tissue sections, respectively. Also, the use of 4-NC improved the imaging quality of LMW compounds in tissue sections through MALDI-MSI and has the potential as a matrix for MALDI tissue imaging of LMW compounds.
Endogenous low-molecular-weight (LMW) compounds (< 1000 Da) are involved in various life activities, such as cytoskeleton formation, signal transduction, nutrient transport, and energy metabolism [1,2]. However, imbalances in LMW compounds are a hallmark of various diseases, e.g., cancers [3], metabolic diseases [4], and cardiocerebrovascular diseases [5]. Understanding the abundance and spatial distribution of LMW compounds is crucial for revealing their roles in biological processes and elucidating pathophysiological mechanisms [6].
Generally, chemical stains [7], immunohistochemical tags [8], and radiolabels [9] are typically limited to determining the localization of target compounds rather than quantifying their abundance in tissues. Additionally, these methods are incapable of measuring multiple compounds simultaneously [10]. However, label-free mass spectrometry (MS)-based visualization techniques enable the simultaneous detection and imaging of molecules from biological tissues with histological structure [11]. Matrix-assisted laser desorption/ionization mass spectrometry imaging (MALDI-MSI) is an excellent tool for detecting and visualizing various compounds, e.g., small molecules [12], lipids [13,14], nucleotides [15], peptides [16], and proteins [17]. It also offers many remarkable advantages, such as soft ionization, high sensitivity, high throughput, and high salt tolerance [18]. As a result, MALDI-MSI has been extensively applied in diverse fields over the past two decades, such as zoology [19], botany [20], medical science [21], pharmaceutical science [22], food science [23], and environmental science [24].
During MALDI-MSI experiments, a proper matrix is crucial for analyzing LMW compounds in biological tissues [25,26]. In general, a suitable MALDI matrix should possess specific properties, e.g., strong absorption at the operational wavelength, high salt tolerance capacity, high ionization efficiency, and fewer matrix-related background peaks [27]. Currently, 2-mercaptobenzothiazole (2-MBT) and 2,5-dihydroxybenzoic acid (DHB) as the commonly used matrices for detecting and imaging LMW compounds, exhibit some limitations including strong background signals and low detection sensitivity of LMW compounds [28]. Of late, 2,4-dinitrophenylhydrazine (DNPH) [29], α-cyano-4-hydroxycinnamic acid (CHCA) [30], para-nitroaniline (PNA) [30] have been reported as excellent positive-ion (+)MALDI matrices for analysis of LMW compounds, but they still have some limitations. For instance, DNPH may not be widely used due to its explosive performance [29]. Meanwhile, CHCA similar to 2-MBT tends to produce matrix-related peaks that interfere with LMW compounds analysis [30]. In addition, the low vacuum stability of PNA makes it incompatible with the imaging of large tissues [29]. Moreover, several negative-ion (−)MALDI matrices, e.g., 9-aminoacridine (9-AA) [31], 1,8-bis(dimethyl amino)naphthalene (DMAN) [32], 2,6-dihydroxy acetophenone (DHA) [33], and 1,5-diaminonaphthalene (1,5-DAN) [34], have been widely used for LMW compounds detection and imaging. However, their application still has limitations. For instance, 9-AA reduces the MALDI-MS reproducibility due to its uneven co-crystallization with analytes [31]. Also, DMAN and DHA exhibit high volatility, making them unsuitable for analyzing LMW compounds in larger tissues [32]. A previous study has proved that 1,5-DAN was highly toxic [30]. Despite numerous efforts, efficient matrices for comprehensive LMW compounds analysis by MALDI-MS remain rare.
Here, 4-nitrocatechol (4-NC) was successfully screened and evaluated as a novel (+)MALDI matrix for in situ detection and imaging of LMW compounds from rat liver, rat brain, and germinating Chinese-yew (Taxus chinensis var. mairei) seed tissues by MALDI-MS. Our findings indicated that the matrix 4-NC possessed exceptional properties, including strong ultraviolet absorption, uniform matrix crystal, super vacuum stability, and fewer matrix-related background peaks. Additionally, the use of 4-NC significantly enhanced MALDI-MS detection and imaging of LMW compounds in both animal and plant tissue sections.
A favorable ultraviolet absorption at the laser wavelength is essential for screening a potential MALDI matrix [35]. Here, the Nd: YAG UV laser (355 nm) was equipped to the MALDI-MS. The ultraviolet absorption spectrum of 4-NC was compared to those of two commonly used matrices (i.e., 2-MBT and DHB). Fig. S1 (Supporting information) showed that 4-NC exhibited the strongest UV absorption in the wavelength ranges of 220–270 and 300–400 nm (especially at 355 nm) versus the other two matrices. Furthermore, the 4-NC exhibited the highest molar extinction coefficient at 355 nm, with a value of 30,800 L mol−1 cm−1. The results show that 4-NC exhibits great potential as a MALDI matrix.
The strong UV absorbance of a matrix during laser desorption and ionization may result in excessive background ion signals in the low-mass range [2]. Here, the matrix-related background peaks of 4-NC were compared to those of two widely used matrices (i.e., 2-MBT and DHB). As shown, the use of 4-NC led to lower background ion signals, with only 17 matrix-related peaks (signal-to-noise ratio (S/N) > 3), compared to 81 and 97 matrix-related peaks detected by using 2-MBT and DHB, respectively. Notably, the use of 4-NC resulted in almost no background ion signals in the lipids detectable main region (Fig. S2 in Supporting information). Therefore, we further assessed the performance of 4-NC for detecting LMW compounds by dissolving 50 mg/mL of 4-NC matrix solutions in an 80% ACN aqueous solution containing 2% TFA based on our preliminary experiments. As shown, 4-NC enabled the clear detection of numerous LMW compounds, whereas no better results were observed in the negative-ion mode within the rat liver tissue slices (Fig. S3 in Supporting information). Although the underlying reason remains unclear, 4-NC is effective in detecting LMW compounds in positive-ion mode. Our findings suggest that the use of 4-NC exhibits fewer matrix-related background peaks in the low-mass range when detecting LMW compounds.
In MALDI-MS experiments, organic solvents with specific additives are commonly used to dissolve the matrices [30,36]. Previous studies have focused on optimizing the overall composition of matrix solutions while neglecting the optimization of solvent systems for dissolving matrices [37,38]. This aspect deserves further attention to enhance the performance of MALDI matrices. Therefore, a total of 12 different organic solvent systems were obtained from a randomized block experiment, comprising four types of organic solvents (i.e., ACN, MeOH, EtOH, and iPrOH) and three additives (i.e., FA, TFA, and NH3·H2O) (Table S1 in Supporting information). Herein, a mixture of 20 amino acid standards was used for the evaluation of 12 different organic solvent systems containing 50 mg/mL 4-NC matrix by MALDI-MS. As shown, an aqueous solution with 80% ACN and 2% TFA showed better detection of all amino acid standards with greater intensities than the other 11 organic solvent systems (Fig. S4 in Supporting information). Further experiments using an 80% ACN aqueous solution containing 2% TFA showed smaller crystal sizes and more uniform matrix crystallization, implying higher ionization efficiency of 4-NC in this solvent system (Fig. S5 in Supporting information). We speculated that the reason for the optimal results when using an 80% ACN aqueous solution containing 2% TFA are as follows: (ⅰ) ACN may have superior solubility to 4-NC compared to the other three solvents, facilitating effective matrix crystallinity as well as co-crystallization of the matrix-analyte; (ⅱ) TFA acts as a proton donor which facilitates 4-NC to generate more [M + H]+ ion signals; (ⅲ) TFA exhibits stronger acidity than the other two additives, which may greatly enhance the dissolution of 4-NC and promote protonation during the desorption/ionization of the analyte. So, we think that an ACN solution containing TFA is an excellent solvent system to dissolve 4-NC matrix for LMW compounds detection.
The optimal formulation of the matrix solution is crucial for obtaining better profiling and imaging data [2,13,29]. Therefore, we optimized the composition of the 4-NC matrix solution using orthogonal-array testing with aqueous ACN containing TFA as the solvent. The concentrations of 4-NC, ACN, and TFA were chosen as three experimental variables, and each variable was tested at three levels (i.e., 40, 45, and 50 mg/mL 4-NC; 70%, 80%, and 90% ACN; and 1%, 2%, and 4% TFA). As the proportion of TFA concentrations in the 4-NC matrix solvent composition was lower, we chose a geometric series of TFA concentrations rather than an arithmetic series, as it provided an evaluation of the effect of TFA concentrations on LMW compounds detection in a broader range. In general, the optimal 4-NC matrix solution could be obtained with only 9 experiments, which encompass all effects of 27 experiments involving three factors and three levels in orthogonal-array testing. As a result, a total of 140, 190, 164, 132, 183, 198, 133, 188, and 145 LMW compounds were successfully detected from parallel rat liver tissue sections coated with 9 different 4-NC matrix solution compositions (Figs. S6 and S7, Table S2 in Supporting information). In conclusion, the optimal combination of matrices was 40 mg/mL 4-NC dissolved in an aqueous solution containing 80% ACN and 2% TFA. To assess its chemical stability, a series of rat liver tissue sections were coated with 4-NC matrix solvents and stored under a high vacuum MALDI source (~10−7 mbar) with a modified standby mode (The high voltage on target plate is switched off, and the UV laser in MALDI source is in a non-excited state). As shown in Fig. S8 (Supporting information), the use of 4-NC resulted in negligible changes in the intensity of LMW compounds and morphologies of matrix crystals, even after the coated tissue sections were stored under the vacuum for up to 48 h. Thus, the optimal 4-NC solution exhibits excellent chemical stability and low volatility even under high vacuum conditions.
The optimal 4-NC solution was further compared to two commonly used matrices (i.e., 2-MBT and DHB) for detecting LMW compounds from rat liver tissue sections by (+)MALDI-MS. Fig. S9 (Supporting information) showed that the optimized 4-NC matrix solution exhibited superior performance in detecting LMW compounds with higher intensities from rat liver tissue sections, compared to 2-MBT and DHB matrix solutions. In addition, the use of optimized 4-NC matrix solutions led to in situ detection of 232 LMW compounds, whereas only 132 and 116 LMW compounds were detected using the two aforementioned matrix solutions, respectively (Table S3 in Supporting information). Taken together, the use of optimized 4-NC matrix solutions could detect more LMW compounds from rat liver tissues by MALDI-MS. As a result, this optimal 4-NC solution was used for subsequent experiments.
We also evaluated the quantitative accuracy of 4-NC as a new matrix for MALDI-MS through the analysis of a range of 30 concentrations of bradykinin (1–7) standard compounds, ranging from 0 to 10 µg/mL. Fig. S10a (Supporting information) showed that the limit of detection (LOD) for bradykinin (1–7) was 0.0006 µg/mL, with a S/N ratio of 3. In addition, the standard curve of bradykinin (1–7) exhibited a good linear correlation (R2 = 0.9982) between the concentration and the ion intensity, with a limit of quantitation (LOQ, S/N = 9) of 0.004 µg/mL and a limit of linear response (LOL) of 3.02 µg/mL (Fig. S10b in Supporting information). Thus, these results indicate that 4-NC matrix has outstanding performance in the quantitative analysis of LMW compounds, and support its potential application for in situ metabolites quantification in tissue sections.
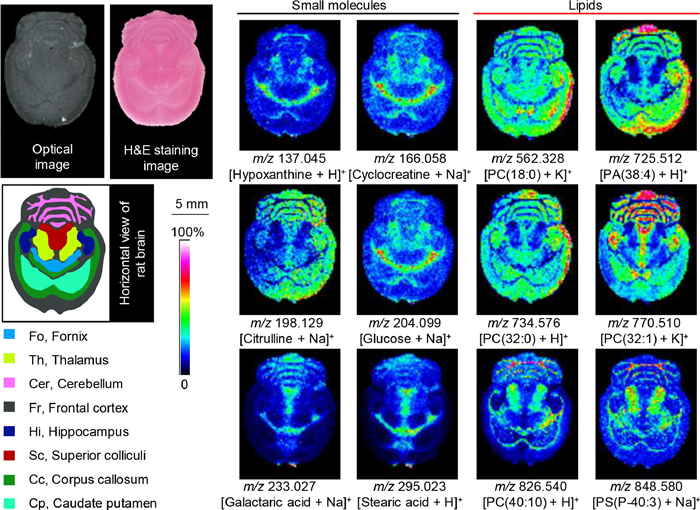
To evaluate 4-NC for detecting LMW compounds in animal tissues, we applied the optimal 4-NC matrix solution onto sections of rat brain tissue and used MALDI-MSI to investigate the distribution of LMW compounds. According to previous studies [2,39], LMW compounds were categorized into small molecule metabolites (< 500 Da) and lipids to facilitate our further analysis. Fig. S11a (Supporting information) showed that small molecule metabolites were predominantly detected in the m/z 100–300, while lipids were detected in the m/z 500–900. Additionally, a total of 218 LMW compound ion signals could be detected from a rat brain tissue section (Table S4 in Supporting information). Upon further analysis using MALDI-MS/MS and LC-MS/MS, we identified 212 LMW compounds, including 160 lipids (i.e., 41 phosphatidylcholines (PCs), 22 phosphatidylserines (PSs), 12 phosphatidic acids (PAs), 12 phosphatidylglycerols (PGs), 12 phosphatidylethanolamines (PEs), 10 diacylglycerols (DGs), 9 lysoPCs (LPCs), 9 sphingomyelins (SMs), 7 cyclic PAs (CPAs), 6 ceramides (Cers), 5 phosphatidylinositols (PIs), 3 monoacylglycerols (MGs), 2 triacylglycerols (TGs), 2 fatty acids (FAs), 2 lysoPEs (LPEs), 1 lysoPA (LPA), 1 lysoPI (LPI), 1 glucosylceramide (Glc-Cer), 1 ceramide PE (PE-Cer), and 1 ceramide PI (PI-Cer)), 1 PI monophosphate (PIP)), and 52 small molecule metabolites (Fig. S11b and Table S4 in Supporting information). Our results showed the strong ability of 4-NC for detecting LMW compounds in biological tissues. The optical and H & E staining images further showed distinct compartments within the structure of rat brain, including cerebellum (Cer), hippocampus (Hi), thalamus (Th), fornix (Fo), caudate putamen (Cp), corpus callosum (Cc), superior colliculi (Sc), and frontal cortex (Fr) (Fig. 1). Meanwhile, several lipid ions (i.e., m/z 562.328 [PC(18:0) + K]+, m/z 725.512 [PA(38:4) + H]+, m/z 734.576 [PC(32:0) + H]+, and m/z 770.510 [PC(32:1) + K]+, were observed in Cc, Cer, Cp, Fo, Fr, Hi, and Sc. Moreover, m/z 826.540 [PC(40:10) + H]+ and 848.580 [PS(P-40:3) + Na]+) were mainly detected in Cc, Cer, and Th. These distributions of lipids in rat brain tissue sections are related to the structures and biological functions [13]. Notably, these lipids are essential for transmembrane transport, membrane localization, and signal transmission [40]. Additionally, specific small molecules (i.e., m/z 137.045 [hypoxanthine + H]+ and m/z 166.058 [cyclocreatine + Na]+) were mainly distributed in Cc, Cer, Cp, and Th. Also, m/z 198.129 [citrulline + Na]+ and m/z 204.099 [glucose + Na]+ were mainly detected in Cc, Cer, Cp Fr, Hi, and Th. Meanwhile, m/z 233.027 [galactaric acid + Na]+ and m/z 295.023 [stearic acid + H]+, were mainly detected in Cc, Cer, Sc, and Fr. Generally, the localization of small molecule metabolites and lipids is crucial for discovering biomarkers, understanding signaling pathways, and uncovering disease mechanisms [2,41]. These findings suggest that 4-NC has great potential for detecting and imaging LMW compounds in animal tissue samples.
Figure 1
Figure 1.
Representative ion images of small molecules and lipids in a rat brain tissue section by MALDI-MSI with 4-NC as a matrix. The MS imaging was acquired at a spatial resolution of 150 µm. Ion images were generated with a bin width of ±0.2%. Scale bar: 5 mm.
To assess the applicability of matrix 4-NC for detecting and imaging LMW compounds in plant tissues, parallel germinating Chinese-yew seed sections were used for (+)MALDI-MS. As shown, small molecules were mainly detected within m/z 100–400, whereas lipids were predominantly detected in m/z 700–900. These results are consistent with previous MALDI-MSI studies [42,43]. In addition, a total of 193 LMW compounds were detected on the germinating Chinese-yew seed tissue sections. Among these, 171 LMW compounds were identified and classified into 11 classes of lipids (i.e., 19 PCs, 17 PAs, 13 PSs, 13 PIs, 12 TGs, 10 PEs, 10 PGs, 4 DGs, 2 SMs, 1 MG, and 1 LPC) and 69 small molecule metabolites, by MALDI-MS/MS combined with LC-MS/MS analysis (Fig. S12 and Table S5 in Supporting information). Consequently, our results show that 4-NC exhibits superior capability in detecting various LMW compounds in germinating Chinese-yew seed tissue sections. To show the advantages of 4-NC for MALDI imaging, we presented the distribution of twelve selected LMW compound ion signals in germinating Chinese-yew seed tissue (Fig. 2). Specifically, four lipids (i.e., m/z 756.547 [PE(34:0) + K]+, m/z 782.562 [PC(34:1) + Na]+, m/z 846.505 [PE(40:6) + K]+, and m/z 975.772 [TG(58:5) + K]+) were mainly distributed in the embryo of the germinating Chinese-yew seed, whereas m/z 824.512 [PC(38:8) + Na]+ and m/z 921.692 [TG(56:10) + Na]+ were mainly observed in endopleura and endosperm. In plants, phospholipids are crucial for biological membranes and signaling cascades. The spatial heterogeneity and dynamics of their phospholipid profiles directly impact the structure and function of different regions of the seed. In addition, Fig. 2 also illustrated the distribution of small molecule metabolites. Among these, four signal ions (i.e., m/z 106.049 [serine + H]+, m/z 147.112 [lysine + H]+, m/z 193.035 [isocitrate + H]+, m/z 381.080 [sucrose + K]+) were mainly detected in the embryo and embryonic axis. Meanwhile, m/z 156.076 [histidine + H]+ and m/z 233.065 [sedoheptulose + Na]+ were found in the endopleura and endosperm. These small molecule metabolites are crucial to plant biological processes, and their specific distribution may be related to seed germination. In conclusion, our results prove the great potential of 4-NC for detecting and imaging LMW compounds in plant tissue sections.
Figure 2
Figure 2.
Representative ion images of small molecules and lipids in a germinating Chinese-yew seed section by MALDI-MSI with 4-NC as a matrix. The MS imaging was acquired at 100 µm spatial resolution. Ion images were generated with a bin width of ±0.2%. Scale bar: 2 mm.
Here, we have screened and optimized 4-NC as an effective positive-ion matrix for detecting and imaging LMW compounds in rat liver, brain, and germinating Chinese-yew seed tissue sections by MALDI-MS. Our results showed that 4-NC possessed several outstanding properties, such as strong ultraviolet absorption, uniform matrix crystal morphology, excellent chemical stability, fewer matrix-related background peaks, and high ionization efficiency for LMW compounds. The use of 4-NC led to 232, 218, and 193 LMW compounds detection from rat liver, rat brain, and germinating Chinese-yew seed tissue sections, respectively. Additionally, the use of 4-NC enabled clear visualization of the spatial distribution of LMW compounds in both rat brain and germinating Chinese-yew seed tissue sections. Overall, our study proved that 4-NC as a novel (+)MALDI matrix successfully enhanced detection and imaging of LMW compounds in both animal and plant tissue sections.
Declaration of competing interest
The authors declare no competing financial interest.
Acknowledgments
This work was supported by the National Natural Science Foundation of China (Nos. 31770384 and 21605164), the Youth Academic Team Project of MUC (No. 10301–02200301), the Huayi Technology Innovation Center for Research Resources (No. HTIC P01RR2017001A), and the Key Laboratory Construction Funds of State Ethnic Affairs Commission of China (No. 10301–02200303).
Supplementary materials
Supplementary material associated with this article can be found, in the online version, at doi:10.1016/j.cclet.2023.109095.
M. Kompauer, S. Heiles, B. Spengler, Nat. Methods 14 (2017) 90–96. doi: 10.1038/nmeth.4071
Figure 1
Representative ion images of small molecules and lipids in a rat brain tissue section by MALDI-MSI with 4-NC as a matrix. The MS imaging was acquired at a spatial resolution of 150 µm. Ion images were generated with a bin width of ±0.2%. Scale bar: 5 mm.
Figure 2
Representative ion images of small molecules and lipids in a germinating Chinese-yew seed section by MALDI-MSI with 4-NC as a matrix. The MS imaging was acquired at 100 µm spatial resolution. Ion images were generated with a bin width of ±0.2%. Scale bar: 2 mm.

 DownLoad:


 下载:
下载:


