Key Laboratory of Chemical Biology and Traditional Chinese Medicine Research (Ministry of Education), College of Chemistry and Chemical Engineering, Hunan Normal University, Changsha 410081, China
b.
Department of Chemistry, Beijing Key Laboratory for Analytical Methods and Instrumentation, Key Laboratory of Bioorganic Phosphorus Chemistry & Chemical Biology of Ministry of Education, Tsinghua University, Beijing 100084, China
Received Date:
06 June 2024 Accepted Date:
08 October 2024 Revised Date:
29 August 2024 Available Online:
15 August 2025
Abstract:
Rapid and robust identification of bacteria is crucial for environmental monitoring and clinical diagnosis. Herein, a bioinspired interface-mediated multichannel sensor array was developed based on three-color-emitting antimicrobial functional carbon dots (FCDs) and concanavalin A doped polydopamine nanoparticles (ConA-PDA) for identification of bacteria. In this sensor, the fluorescence intensity of the three FCDs was quenched by the ConA-PDA. Upon addition different types of bacteria, the fluorescence intensity of the three FCDs was restored or further quenched. Recur to statistical analysis methods, it is employed to accurately discriminate 10 types of bacteria (including three probiotics and seven pathogenic bacteria) in natural water samples and human urine samples. The discrimination ability of the sensor array was highly enhanced via different competing binding of the FCDs and the bacteria toward ConA-PDA. The proposed array-based method offers a rapid, high-throughput, and reliable sensing platform for pathogen diagnosis in the field of environmental monitoring and clinical diagnosis.
Bacterial infections pose a significant threat to human health. They are one of the leading causes of disease and death [1]. Accurately and readily identifying bacteria in the early stages can effectively improve the survival rate of patients [2]. At present, the golden standard method for detecting bacterial infections is bacterial culture, which is time-consuming (takes 24−72 h) [3]. Although polymerase chain reaction (PCR) [4] and enzyme-linked immunosorbent assay (ELISA) [5] achieved sensitive and rapid detection, they have poor reproducibility and may produce false positive results. Common techniques such as surface-enhanced Raman spectroscopy (SERS) [6] and mass spectrometry (MS) [7] have been utilized to detect and identify bacteria. However, these methods require expensive equipment and comprehensive databases to identify bacteria, which prevents them from being used in practice. Therefore, it is great value to develop rapid and accurate bacterial detection technique.
Bacterial cell wall has a lot of biomarkers on their surfaces including lipopolysaccharide, peptidoglycan, teichoic acid, protein [8]. Employing bacterial cell wall as targets, lots of "lock-key" based methods have been developed for bacterial detection [9]. While these assays are reliable and robust, they can only detect individual or specific bacteria and cannot identify multiple bacteria in complex environments. Alternatively, array-based sensing is recognized as powerful protocols for detecting and identifying mixtures [10]. This strategy is composed of multiple sensing units, which rely on cross-responses between sensor units and overall analytes. The sensor array is recognized as powerful method for multiple bacteria identification [11]. However, they typically rely on electrostatic and/or hydrophobic interactions between the sensing elements and the bacteria, limiting their recognition and sensitivity [12, 13]. Therefore, there is still a high demand to establish a robust recognition strategy for bacterial analysis in a complex environment.
Antibiotics with high stability, low cost, and broad availability are wieldy used to treat bacterial infections. Certain antibiotics can inhibit bacterial growth by targeting the cell wall or outer membrane and disrupting their structure. For instance, vancomycin can attach to d-Ala-d-Ala moieties in the cell walls through a five-point hydrogen-bond binding [14], cephalosporins can bind to penicillin-binding proteins on the bacterial surface, disrupting cell wall synthesis [15]. They have been utilized as recognition molecules for bacterial detection [16]. However, antibiotics often have a broad spectrum, and a single antibiotic probe cannot accurately identify bacterial mixtures. Developing a sensor array that combines multiple antibiotic probes can effectively enhance the ability to differentiate between bacteria [17]. On the other hand, as a typical bioinspired nanomaterial, the polydopamine nanoparticles (PDA) can efficiently quench various types of fluorescent species through energy transfer [18]. They have been utilized in the development of different biosensors to detect a variety of biomolecules [19]. In addition, the concanavalin A (ConA) can reversibly bind carbohydrates. It can bind a range of microbial sugars [20]. Thus, an increased interaction between ConA and glycans can be driven, which can availably enhance the discrimination of array-based sensing platforms.
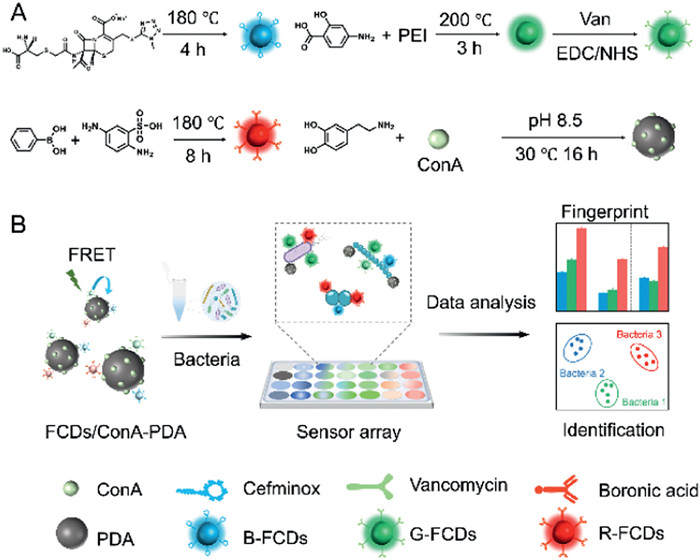
Herein, a bioinspired interface-mediated multichannel sensor array based on three receptor (cefminox, vancomycin, and boronic acid) functionalized carbon dots (FCDs) and concanavalin A-doped polydopamine nanoparticles (ConA-PDA) was developed for bacteria discrimination. In this sensor, the three FCDs (including blue-emitting FCDs: B-FCDs, green-emitting FCDs: G-FCDs, and red-emitting FCDs: R-FCDs) serves as both the signal reporter and recognition elements, in which cefminox can specifically bind penicillin-binding proteins, vancomycin can directly bind to d-Ala-d-Ala, and boronic acid selectively bind to cis-diol structure on the surface of bacterial cell walls [21], respectively. By modulating functional molecules on the surface of carbon dots, the three-color-emitting FCDs demonstrate varying binding affinities towards different bacteria [22]. For each type of FCDs, the interactions with different bacteria also vary based on the negative charge density and hydrogen bonding site of each bacterium [23]. To further enhance the selectivity, ConA was doped with PDA and used as both recognition elements and fluorescence quenchers and the ConA can increase the binding ability to the bacterial membrane [24]. Scheme 1A exhibited the preparation mechanism of the sensor unit. Initially, the three FCDs are close to the ConA-PDA, which leads to the fluorescence quenching through energy transfer. In the presence of bacteria, the binding equilibria between FCDs and ConA-PDA are altered, resulting in the fluorescence intensity of FCDs recovered or further quenched. The fluorescence response of the three emission channels varies significantly depending on the characteristics of the bacterium surfaces. As a result, an accurate assessment of the bacterium types can be achieved (Scheme 1B).
Scheme 1
Scheme 1.
Illustration of the bioinspired interface-mediated multichannel sensor array for the discrimination of bacteria. (A) Schematic of the preparation mechanism of the sensor unit. (B) Schematic of the sensor array for bacteria discrimination.
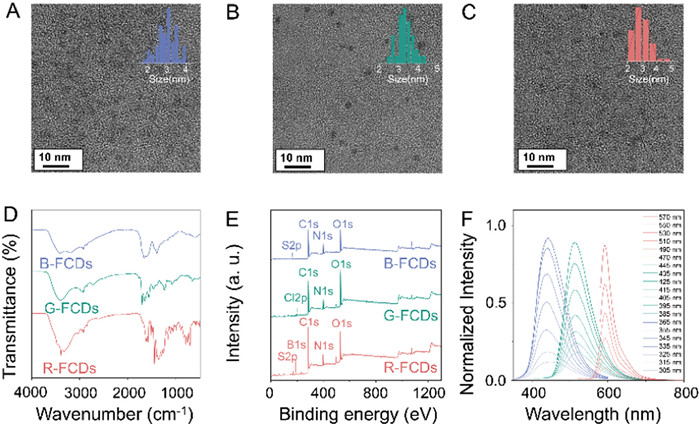
The three FCDs were synthesized according to previously protocols [25-27]. Their morphologies, surface functional groups, and optical properties were characterized by transmission electron microscopy (TEM), Fourier transform infrared (FTIR), X-ray photoelectron spectra (XPS), UV–vis spectra, and fluorescence spectra, respectively. TEM results indicated that all the three FCDs were monodispersed with spherical morphology. The diameters of B-FCDs, G-FCDs and R-FCDs are 3.0 ± 0.5 nm, 3.3 ± 0.4 nm, 2.9 ± 0.5 nm, respectively (Figs. 1A-C). The FTIR and XPS showed that the surface modified receptor without significant changes, indicting the receptor FCDs have been successful prepared (Figs. 1D and E, Figs. S1-S4 in Supporting information). All the three FCDs show obvious absorption peak of π-π* and n-π* transition (Fig. S5 in Supporting information). The fluorescence spectra of the three FCDs are independent of the excitation wavelength (Fig. 1F), and the optimal excitation and emission wavelengths of B-FCDs, G-FCDs and R-FCDs are 365/445 nm, 445/515 nm and 570/593 nm, respectively, which can be obtain independent responses from each channel (Fig. S6 in Supporting information).
Figure 1
Figure 1.
Characterizations of the three FCDs. TEM images and the corresponding size distribution histograms of (A) B-FCDs, (B) G-FCDs, and (C) R-FCDs. (D) FTIR, and (E) XPS of the three FCDs. (F) Fluorescence emission spectra of the three FCDs recorded at different excitation wavelengths.
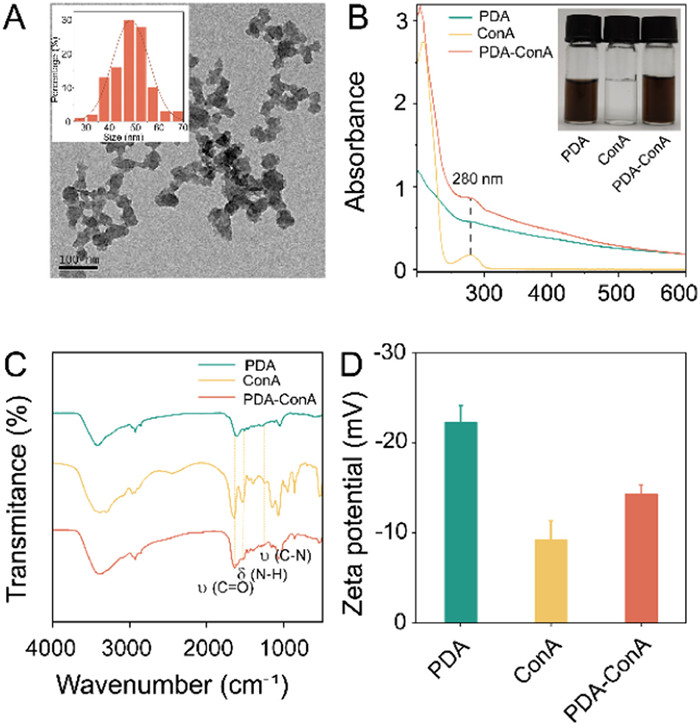
The ConA-PDA was synthesized by polymerization of dopamine monomer in the presence of ConA. The as-prepared ConA-PDA exhibited a torispherical morphology with an average diameter of 48.4 ± 7.4 nm (Fig. 2A). A typical absorption peak at 280 nm were observed in the UV–vis spectra of the ConA-PDA, which corresponded well to that of ConA (Fig. 2B) [28]. In addition, the emergence of characteristic peaks of C = O stretching vibration, N—H bending vibration and C—N stretching vibration in the amide Ⅰ, Ⅱ, and Ⅲ regions are observed at 1647 cm-1, 1535 cm-1, and 1257 cm-1 (Fig. 2C) [29]. Moreover, zeta potential of ConA-PDA became more positive than that of pure PDA (Fig. 2D), further verifying that the PDA were successfully doped with ConA. All the results indicated that the PDA has been successfully doped with ConA. The amount of ConA was determined by protein bicinchoninic acid (BCA) assay, indicating approximately 10.3 ± 0.3 wt% (Fig. S7 in Supporting information).
Figure 2
Figure 2.
Characterizations of the ConA-PDA. (A) TEM image with the corresponding size distribution histograms of ConA-PDA. (B) UV−vis spectra of the PDA, ConA, and ConA-PDA. The inset is a digital image of the PDA, ConA, and ConA-PDA (from left to right) dispersed in Tris-HNO3. (C) FTIR and (D) zeta potential of PDA, ConA, and ConA-PDA.
With the three FCDs and ConA-PDA in hand, the fluorescence responses of ConA-PDA toward the three FCDs were investigated. The fluorescence titration experiments indicated that the ConA-PDA can observably quench the fluorescence intensity of the three FCDs (Fig. S8 in Supporting information). The binding constants (Ka) between the three FCDs and ConA-PDA varied significantly (Fig. S9 and Table S1 in Supporting information), indicating that different fluorescence responses would be produced for each FCD upon interaction with the sensor array for various bacteria. To achieve a wide dynamic range, the concentration of three FCDs and ConA-PDA were optimized. After the optimal concentration of the three FCDs were obtained (B-FCDs 3 µg/mL, GFCDs 10 µg/mL, and R-FCDs 5 µg/mL), the sensor array was built upon the fluorescence intensity of three FCDs were uniformly quenched to about 40% by ConA-PDA.
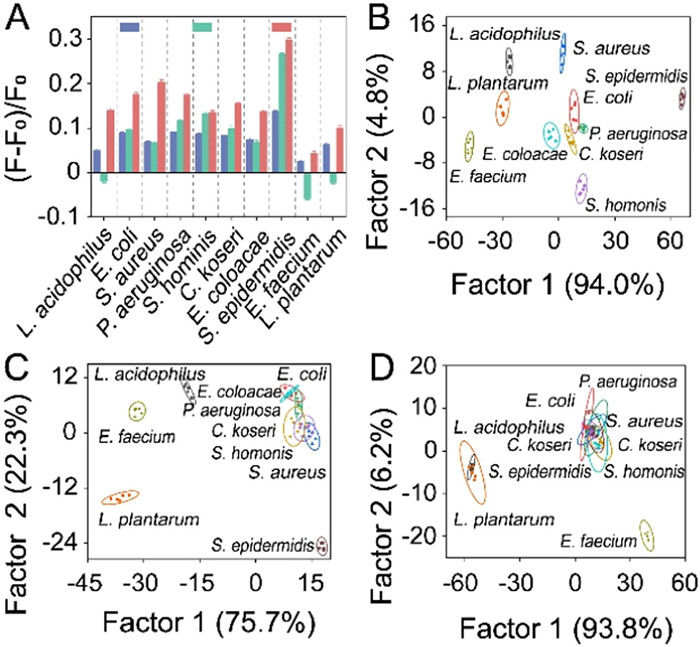
To verify the feasibility of the sensor array, 10 species bacteria (including three probiotics and seven pathogenic bacteria) were chosen for testing (Table S2 in Supporting information). As shown in Fig. 3A, a unique fluorescence response pattern for each bacterium can be observed in the presence of different bacteria, suggesting differential interactions of the bacteria with the FCDs/ConA-PDA. The distinctive response patterns for each bacterium can be more easily recognized in the heat map (Fig. S10A in Supporting information). Linear discriminant analysis (LDA) showed that all the 10 types of bacteria are well distinguished without any overlap in the 2D space, indicting the as-proposed sensor array could effectively distinguish different bacteria (Fig. 3B). Further hierarchical cluster analysis (HCA) showed that the 10 types of bacterial clusters similar to the LDA diagram, and three probiotics and seven pathogenic bacteria could be clearly distinguished (Fig. S10B in Supporting information). According to the Jackknifed Classification Matrix, the classification accuracy of the 10 types of bacteria was 100% (Table S3 in Supporting information). To verify the selectivity of the sensor array, unmodified carbon dots (CDs) and pure polydopamine nanoparticles (PDA) were selected as controls. When the FCDs/PDA and CDs/ConA-PDA were used, both of them produced a fluorescent response to bacteria (Fig. S11 in Supporting information), but the LDA maps showed that there were overlap among different bacteria (Figs. 3C and D). These results demonstrated that the selectivity of the sensor array could significantly improve after recognition engineering. Moreover, the sensor array could discriminate the 10 types of bacteria at different concentrations (OD600 = 0.3 and OD600 = 0.5, as shown in Fig. S12 in Supporting information). Furthermore, the robustness of the sensor array was also tested. Notably, after comparing and classifying standard bacterial samples and unknown bacterial samples, 59 of 60 unknown samples were accurately recognized, with a 98.3% accuracy (Figs. S13 and S14, Table S4 in Supporting information). The above results showed that the fabricated sensor array exhibited outstanding discrimination ability for bacteria.
Figure 3
Figure 3.
(A) Fluorescence response of FCDs/ConA-PDA for identification of 10 bacteria (OD600 = 0.1). LDA plots for the discrimination of the ten bacteria (OD600 = 0.1) with (B) FCDs/ConA-PDA, (C) FCDs/PDA and (D) bare CDs/ConA-PDA. Ellipses in LDA are generated using 95% confidence.
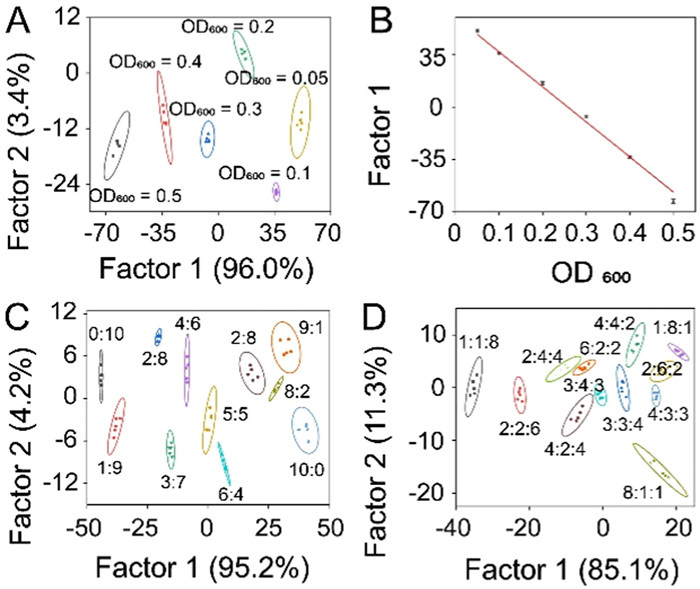
The existence of bacteria in nature poses a great threat to the ecological environment and human health. Rapid quantitative detection of bacteria is a crucial problem. As an important pathogen, S. aureus seriously hazard human health [30]. Thus, different concentrations of S. aureus were selected to investigate the quantitative capacity of the sensor array. As shown in Fig. S15 (Supporting information), when the concentration of S. aureus increased, the fluorescence response was gradually enhanced, and different concentrations of S. aureus (OD600 = 0.05–0.5) could be distinguished in the LDA diagram (Fig. 4A). In addition, the value of factor 1 revealed a linear relationship with the concentrations of bacteria (Fig. 4B). Based on the standard 3σ criteria, the limit of recognition of the sensor array is estimated to be OD600 = 0.01. Additionally, other individual bacterium (including E. coli and P. aeruginosa) at different concentrations can also be distinguish from each other, as well as a good linear correlation between the value of factor 1 and the concentrations of different bacteria (Fig. S16 in Supporting information). The results indicate that our sensor array can sensitive determination of individual bacterium. Compared with other strategies used for bacterial sensing in recent years, the as-prepared sensor array has multiple selective recognition units for bacterial cell walls, and exhibits improved or comparable performance in recognizing bacteria benefited to dual recognition of antibiotics and ConA (Table S5 in Supporting information).
Figure 4
Figure 4.
(A) LDA plot and (B) linear relationship of the sensor array responses to different concentrations of S. aureus. LDA plots of the sensor array responses to a mixture of (C) P. aeruginosa and S. aureus, and (D) E. coli, S. aureus, and P. aeruginosa with different ratios. The concentration of bacteria is OD600 = 0.5. Ellipses in LDA are generated using 95% confidence.
Since most bacteria in the actual environment are coexisting, the detection and identification of pure bacteria is not challenging. To verify the ability of the sensor array to distinguish coexisting bacteria, the bacterial mixtures were investigated. Considering the threat posed by pathogenic bacteria to the environment and human health, three common pathogenic bacteria was selected as the target analyte, including different ratios of S. aureus and E. coli, P. aeruginosa and E. coli, S. aureus and P. aeruginosa binary bacterial mixtures, and different ratios of ternary bacterial mixtures (the final bacterial concentration was OD600 = 0.5). The results showed that mixed samples of bacteria with different proportions showed anisotropic fluorescence responses (Figs. S17 and S18 in Supporting information). Each binary bacterial mixture was located in the middle of the two pure bacterial samples, and with the gradual increase of the proportion, it gradually approached the pure bacterial sample (Fig. 4C). Moreover, the different ternary bacterial mixtures were also separated from each other without any overlap (Fig. 4D and Fig. S19 in Supporting information). These results indicated that our sensor array had a good discriminant ability in bacterial mixtures.
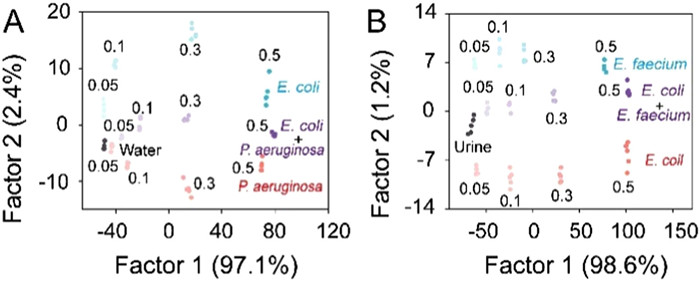
Water pollution by microorganisms is a major route for bacterial transmission [31]. The characteristics of pathogenic bacteria in different environmental water are vastly different, so the detection of pathogenic bacteria in environmental water is essential for human health and environmental protection. Thus, the identification of bacteria in environmental water samples were tested through the standard addition method. As a result, the sensor array could effectively distinguish a variety of pathogenic bacteria in complex environmental water samples (including tap water, river water, and lake water. See detail in Fig. S20 in Supporting information). Then, the sensor array was applied to distinguish common pathogenic bacteria (E. coli and P. aeruginosa) in environmental water samples [32]. As shown in Fig. 5A, the two kinds of pathogenic bacteria and mixed bacteria with different concentrations showed regular distribution. The result demonstrated that the proposed sensor array can discriminate individual bacterium and mixtures of bacteria in natural water samples.
Figure 5
Figure 5.
(A) LDA plot of the sensor array discrimination of E. coli, P. aeruginosa, and their mixtures at different concentrations in river water sample. (B) LDA plot of the sensor array discrimination of E. coli, E. faecium, and their mixtures at different concentrations in urine.
Given the significance of identifying bacteria in clinical diagnosis, the sensor array was also used to differentiate bacteria in urine samples. Two common bacteria causing urinary tract infections (E. coli and E. faecium) were chosen as the target analytes [33]. After various concentrations of E. coli, E. faecium, and their mixtures were spiked to the human urine sample, the position of bacteria with higher concentration was farther from the position of urine sample, and the position of bacteria with lower concentration was closer to the position of pure urine sample (Fig. 5B). In addition, the sensor array also had a good ability to distinguish ten types of bacteria in the urine (Fig. S21 in Supporting information). These results indicated that our sensor array exhibits excellent discrimination capabilities, providing an excellent opportunity to the diagnosis of diseases caused by bacterial infection.
In summary, a bioinspired interface-mediated multichannel sensor array was developed based on antimicrobial and ConA-mediated strategy for discriminating 10 types of bacteria. Combined with the specific affinity of antimicrobial and ConA, the selectivity of the sensor array was significantly enhanced. The proposed sensor array could identify bacteria at various concentrations and mixtures. It can also be used to identify various bacteria in environmental water samples and urine sample. Remarkably, the sensor array provides a new idea for the identification and analysis of multiple bacteria in complex environment, which is of great significance for environmental purification and clinical diagnosis.
Declaration of competing interest
The authors declare that they have no known competing financial interests or personal relationships that could have appeared to influence the work reported in this paper.
This work was supported by National Natural Science Foundation of China (Nos. 22376057, 22174048, 22274048, 22274045, 22274047, and 21904039), and the Foundation of the Science & Technology Department of Hunan Province (Nos. 2023JJ30394 and 2023ZJ1123).
Supplementary materials
Supplementary material associated with this article can be found, in the online version, at doi:10.1016/j.cclet.2024.110530.
M. Malmsten, Curr. Top. Med. Chem. 16 (2016) 16–24.
[23]
T. Bollenbach, Curr. Opin. Microbiol. 27 (2015) 1–9.
[24]
Y. Li, B. Zhu, Y. Li, et al., Angew. Chem. Int. Ed. 53 (2014) 5837–5841. doi: 10.1002/anie.201310135
[25]
Y. Kuang, M. Song, X. Zhou, et al., Chem. Eng. J. 470 (2023) 143988.
[26]
D. Zhao, X. Li, M. Xu, et al., Int. J. Biol. Macromol. 231 (2023) 123303.
[27]
S. Huang, E. Yang, J. Yao, et al., Anal. Chim. Acta 1035 (2018) 192–202.
[28]
Z. Chen, Y. Liu, Y. Wang, et al., Anal. Chem. 85 (2013) 4431–4438. doi: 10.1021/ac303572g
[29]
M. Xu, J. Huang, S. Jiang, et al., Int. J. Biol. Macromol. 202 (2022) 296–308.
[30]
X. Hu, H. Gan, Z. Qin, et al., J. Am. Chem. Soc. 145 (2023) 8917–8926. doi: 10.1021/jacs.2c12798
[31]
P. Zhang, Y.P. Chen, W. Wang, et al., TrAC-Trend. Anal. Chem. 85 (2016) 153–165.
[32]
E.T. Gensberger, M. Polt, M. Konrad-Koeszler, et al., Water Res. 67 (2014) 367–376.
[33]
A.L. Flores-Mireles, J.N. Walker, M. Caparon, et al., Nat. Rev. Microbiol. 13 (2015) 269–284. doi: 10.1038/nrmicro3432
Scheme 1
Illustration of the bioinspired interface-mediated multichannel sensor array for the discrimination of bacteria. (A) Schematic of the preparation mechanism of the sensor unit. (B) Schematic of the sensor array for bacteria discrimination.
Figure 1
Characterizations of the three FCDs. TEM images and the corresponding size distribution histograms of (A) B-FCDs, (B) G-FCDs, and (C) R-FCDs. (D) FTIR, and (E) XPS of the three FCDs. (F) Fluorescence emission spectra of the three FCDs recorded at different excitation wavelengths.
Figure 2
Characterizations of the ConA-PDA. (A) TEM image with the corresponding size distribution histograms of ConA-PDA. (B) UV−vis spectra of the PDA, ConA, and ConA-PDA. The inset is a digital image of the PDA, ConA, and ConA-PDA (from left to right) dispersed in Tris-HNO3. (C) FTIR and (D) zeta potential of PDA, ConA, and ConA-PDA.
Figure 3
(A) Fluorescence response of FCDs/ConA-PDA for identification of 10 bacteria (OD600 = 0.1). LDA plots for the discrimination of the ten bacteria (OD600 = 0.1) with (B) FCDs/ConA-PDA, (C) FCDs/PDA and (D) bare CDs/ConA-PDA. Ellipses in LDA are generated using 95% confidence.
Figure 4
(A) LDA plot and (B) linear relationship of the sensor array responses to different concentrations of S. aureus. LDA plots of the sensor array responses to a mixture of (C) P. aeruginosa and S. aureus, and (D) E. coli, S. aureus, and P. aeruginosa with different ratios. The concentration of bacteria is OD600 = 0.5. Ellipses in LDA are generated using 95% confidence.
Figure 5
(A) LDA plot of the sensor array discrimination of E. coli, P. aeruginosa, and their mixtures at different concentrations in river water sample. (B) LDA plot of the sensor array discrimination of E. coli, E. faecium, and their mixtures at different concentrations in urine.

 DownLoad:

 下载:
下载:


