Figure 1.
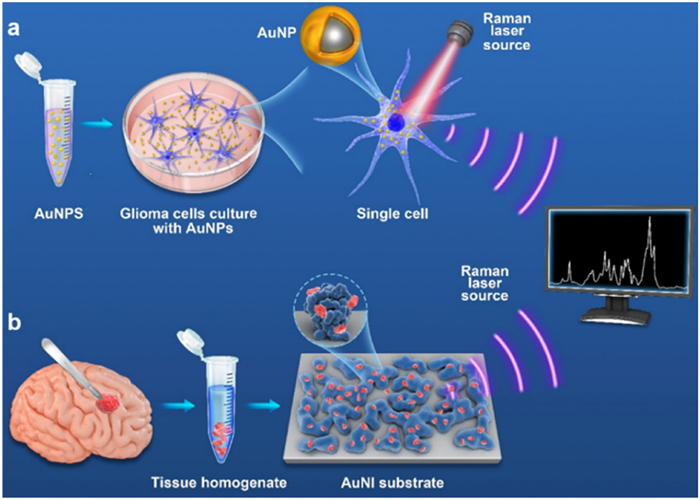
Schematic illustration of procedures to obtain Raman spectra of glioma cells (a) and glioma tissues (b).
A distinction of gliomas at cellular and tissue level by surface-enhanced Raman scattering spectroscopy
Chengde Wang , Liping Huang , Shanshan Wang , Lihao Wu , Yi Wang , Jun Dong

Glioblastoma multiforme (GBM) is regarded as the most malignant primary brain tumor in adults with a poor prognosis [1,2]. Due to intratumoral high cellular heterogeneity, the indistinct margin of GBM, and its infiltrative growth [3,4], GBM remains a major therapeutic challenge clinically. GBM tissue contains glioma stem cells (GSCs) with various differentiation degrees and multiple interstitial cells, which are featured as being pathologically heterogeneous [5,6]. This complex environment has been broadly involved in the clinical treatment of brain cancer patients who have poor prognoses [7].
To develop strategies for precise diagnosis and treatment of GBM, cellular-level heterogeneity should be delineated and distinguished [8]. Conventional biomedical techniques, such as cell immunochemical staining and tissue sectioning, are time-consuming, complicated, and infeasible to identify tumors promptly and accurately during operation, thus it cannot meet the requirements for guiding surgery of GBM [9]. Besides, the degree of cytoreduction in surgical resection is critical for the treatment of non-central nervous system (CNS) malignancies and is directly correlated to the overall survival of patients [10–12]. However, because of the heterogeneity and aggressive nature of GBM, tumor margin is usually invisible or indefinable for surgeons [13,14]. Therefore, developing a new method for non-invasive, highly sensitive, and label-free identification of GBM to distinguish closely related cellular phenotypes and tissue samples is in urgent need.
Raman spectroscopy is a powerful optical tool for studying biological samples in a label-free way and provides the molecular fingerprints of biological samples [15]. However, the Raman signal is usually weak and covered by a strong autofluorescence background [16], which hinders its further clinical application. Surface-enhanced Raman spectroscopy (SERS) which offers a high Raman signal of target molecules has been widely developed through the electromagnetic field enhancement from nanostructured metal or colloid surfaces [17–19] or chemical enhancement by non-metal materials [20]. It has been therefore employed extensively as a non-invasive measurement and a label-free ultra-sensitive technique for chemical or biomedical analysis [21–23].
Furthermore, given the complexity of biological samples and their corresponding spectra, various artificial intelligence algorithms are employed for spectral analysis and automatic identification [24–26]. In previous work, lung cancer cells were successfully differentiated from circulating tumor cells from peripheral blood by intracellular SERS nanoprobes combined with machine learning [27,28]. The technique has also been applied to effectively differentiate different pathological stages of carcinoma. For instance, nasopharyngeal cancer at T1 stage can be successfully distinguished from T2–T4 stage by a label-free blood plasma test based on the SERS technique [29]. Early gastric cancer can be distinguished from advanced gastric cancer with specific biomarkers measurement based on SERS biosensors [30]. These remarkable achievements underscore the immense potential of the SERS technique in cancer diagnosis and the identification of various cancer stages.
Several works have reported label-free discrimination of brain tumor by SERS technique [31,32]. However, there is still a lack of detailed differentiation of different pathological types of gliomas and comparison of various auxiliary algorithms. In this paper, we aim to develop a sensitive and non-invasive SERS method for the rapid identification of different GBM cells and tissues. Silica nanoparticles coated with Au nanoshells (SiO2@Au) were accordingly developed for the detection of GBM at the single-cellular level (Fig. 1a). Besides, a gold nanoisland (AuNI) 3D SERS substrate was explored for distinguishing glioma tissues with various pathological types (Fig. 1b). Furthermore, several multivariate analysis chemometrics methods were employed for the identification and classification of spectra collected from different samples.
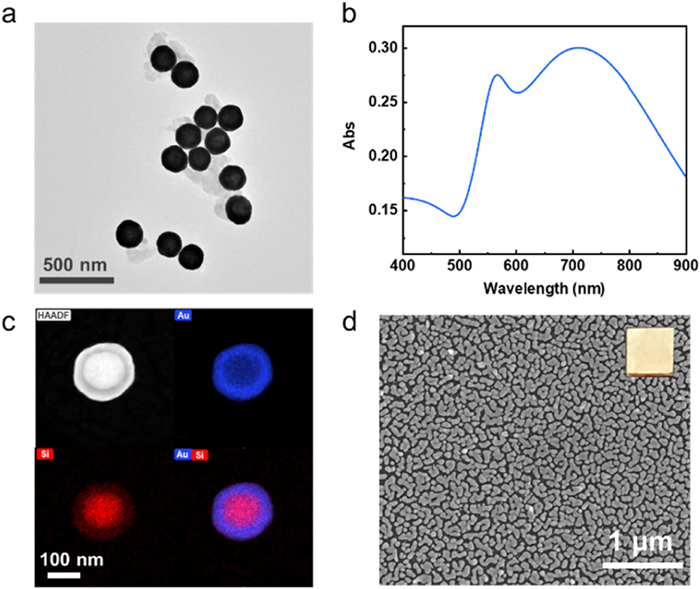
Two SERS-active materials, including SiO2@Au particles and AuNI substrates, were employed for SERS measurement of GBM cells and glioma tissue, respectively. The morphology of the prepared SiO2@Au particles was characterized by transmission electron microscopy (TEM), which shows an average diameter of 171 ± 10 nm (Fig. 2a and Fig. S1a in Supporting information). The extinction spectrum of Au nanoshells in an aqueous solution with a strong and broad peak centered at 712 nm (Fig. 2b). Element mapping images and EDX analysis clearly show the gold shell with an average thickness of 26 ± 3 nm (Fig. 2c and Fig. S1b in Supporting information). In addition, AuNI substrates were prepared on glass slides by liquid phase growth method. The morphology of the prepared SERS substrate of AuNI was also characterized by field emission scanning electron microscopy (FE-SEM) (Fig. 2d). The SEM image showed that the glass substrate was covered with a dense layer of island-shaped gold particles with an average diameter of about 50 nm, and the spacing between the particles varied from several to tens of nanometers. The diameter and spacing of island particles could be controlled by the concentration of the growth solution to regulate the plasmonic properties (Figs. S2 and S3 in Supporting information). Typically, a higher concentration of the growth solution results in a denser substrate and enhances the SERS performance. However, when the growth solution concentration is too high, the island-like particles tend to aggregate closely, causing the inter-island gaps to vanish, thereby diminishing the SERS effect (Fig. S2).
The SERS spectra of four different types of cells (including normal human astrocytes HA1800, human glioma cell lines U87 and U251, and human myeloma cell line U266) were acquired by incubating the cells with Au nanoshells. Brightfield images depicting representative examples of four types of cells with SERS nanoprobes internalization are presented in Fig. 3a. In these brightfield images, nanoparticle probes, appearing as black points, can be readily observed within the cells. In multi-cell imaging, it was observed that the nanoprobes were uniformly dispersed in most cells (Fig. S4 in Supporting information). According to previous reports about the cellular location of Au nanoparticles, our observation indicated that SERS nanoprobes were mainly located in the cytoplasm [33]. Cytotoxicity test shows that the nanoprobe has good cytocompatibility (Fig. S5 in Supporting information).
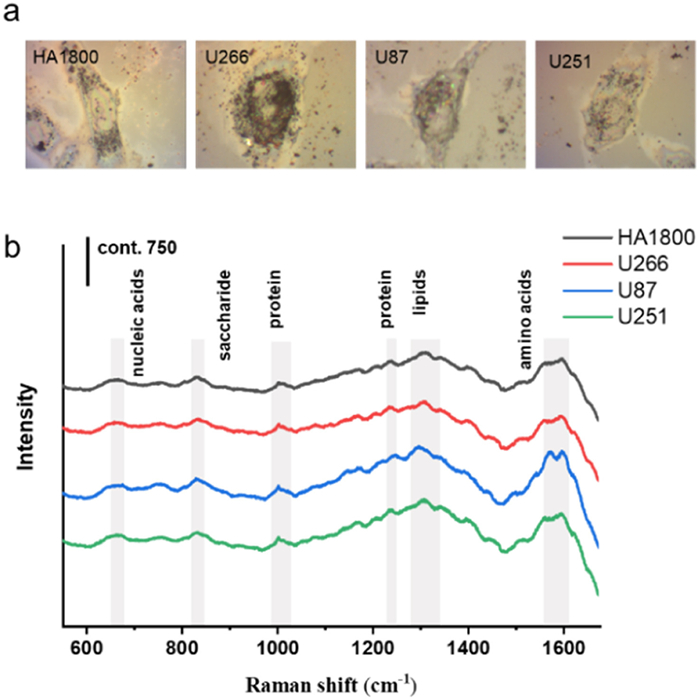
We utilized SERS spectra obtained from specific cells to characterize the cellular biochemical composition of each cell type, which were subsequently subjected to further statistical analysis. As shown in Fig. 3b, the average SERS spectra of different cell types exhibit a general similarity with subtle differences in certain peak positions and peak intensities. Some typical Raman peaks are marked with shaded bands. For instance, the Raman peaks at 1560 and 1586 cm−1 corresponding to tryptophan and phenylalanine, respectively, show a slight difference in their peak intensities. Due to the intricate nature of biological samples, we employed a range of multivariate statistical methods, including hierarchical Cluster Analysis (HCA), principal component analysis (PCA), and support vector machine (SVM), to enhance the discrimination of specific cell types. These algorithms leverage the distinctions present in spectral data by maximizing the variability between different groups while minimizing it within the same group. This approach enables us to effectively differentiate between diverse biological samples.
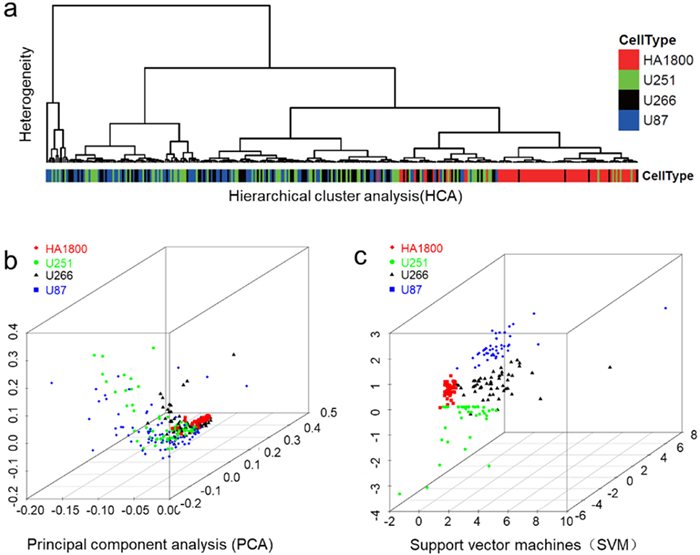
We initially employed the HCA method, which was based on the Euclidean distance and Ward's algorithm [34], to form clusters according to the specific cell type. This method generated two major groups as shown in the dendrogram (Fig. 4a). HCA successfully distinguished HA1800 cells from the other three tumor cell types. However, it exhibited limitations in distinguishing between different types of tumor cells, similar to previous challenges encountered in distinguishing lung cancer cells [33,35]. Therefore, the PCA method was further developed and employed to differentiate all four different cell types (normal astrocytes vs. glioma cells, and glioma cells vs. non-CNS tumor cells). Most HA1800 cells can be distinguished from the other three kinds of tumor cells by SERS spectra based on the intrinsic differences in both biomolecular composition and concentration (Fig. 4b). But there were still some misclassifications for different types of tumor cells. Therefore, an SVM model with a linear kernel was conducted, which created a classification model by finding an optimal three-dimensional hyperplane to separate the dataset. Consequently, the clustering in different colors and shapes (Fig. 4c) successfully separated the four cell types, underscoring the superior capability of the SVM model in distinguishing complex spectral data.
The SERS spectra of tissue samples from 64 glioma patients and 16 brain trauma patients were obtained (Fig. 5a). The detailed information of patients is listed in Table S1 (Supporting information). The research involved human tissues was carried out under guidelines approved by Ethics Committee of Wenzhou Medical University (Ethical Approval No. YS2022634). According to statistical analysis, the normalized peak areas of SERS peaks at 750, 970, 1130, 1230, 1370, 1390, 1560, 1586 and 1635 cm−1 were significantly lower in the glioma tissue group. These peaks are associated with amino acids, proteins, nucleic acids, and lipids (as shown in Fig. 5a). The band of amide I at 1390 cm−1 showed higher intensity for normal brain tissue, suggesting the decrease of collagen in glioma, which is in agreement with the previous reports [36,37]. Furthermore, the band at 1586 cm−1 corresponds to phosphorylated tyrosine, which plays a pivotal role as a Raman biomarker of the phosphorylation status in brain tumors [38], reduced in gliomas, suggesting that the tumor's overall protein phosphorylation level was low. The decreased intensities of the bands at 970 cm−1 of glioma correspond to octacalcium phosphate [39], which is attributed to the formation of hemoglobin and fibrin aggregates [40]. It was reported that a band near 1370 cm−1 was the most pronounced saccharide band, which had maximum intensity for gangliosides because of the increased saccharide content [41]. In our research, the SERS peak intensities obtained from non-tumor trauma brain tissue at 1370 cm−1 were higher than those from glioma tissue.
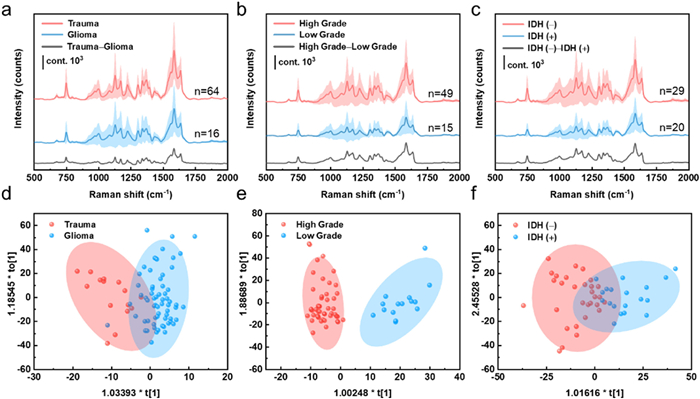
Furthermore, a more precise distinction of the samples of glioma patients was performed based on their SERS spectra, including the identification of tumor grades and isocitrate dehydrogenase (IDH) mutations (Figs. 5b and c). The tissues of high tumor grade presented higher spectral intensity than those of low grade. Specifically, the intensity of peaks at around 970, 1390, 1560, and 1635 cm−1 was significantly stronger in the high-grade group (Fig. 5b). In addition, the tissues without IDH mutation also showed higher spectral intensity than those with IDH mutation, especially for the Raman peaks at 970, 1000, 1080, 1130, 1230, and 1310 cm−1 (Fig. 5c). This indicated that the overall metabolic content in the tissue showed a downward trend with the progress of brain glioma. The determination of tumor grade and IDH mutation are of great significance in the diagnosis, treatment, and clinical prognosis of glioma [42].
Table S2 (Supporting information) presents SERS bands with significant differences observed different tissue groups, along with their corresponding band assignments. OPLS-DA model has an advantage in removing irrelevant variables and decreasing the risk of model overfitting, which is beneficial to the analysis of high-dimensional spectral data. An OPLS-DA model was built to differentiate two tissue groups based on their SERS spectra. The OPLS-DA plot (Fig. 5d) showed the groupings of glioma and the trauma brain tissue with good separation. The sensitivity and specificity of the diagnostic model for distinguishing glioma and trauma tissues were 100% and 87.50%, respectively, and the total accuracy was 97.50%, based on 7-fold cross-validation. OPLS-DA models were also built to differentiate different glioma tissues visually. As shown in Figs. 5e and f, the two clusters of the high-grade group and the low-grade group were separated, while the two groups with and without IDH mutation showed different dispersion with partial overlap. The above two models also showed high accuracy of 100% and 97.96%, respectively (Table S3 in Supporting information). ROC curves were plotted for three models, with AUC values over 0.99 (Fig. S6 in Supporting information), showing the good performance of the classifiers. These results demonstrated that the SERS spectral classification method based on OPLS-DA had a strong ability to identify and screen different glioma tissues.
The relationship between spectral changes and molecular changes in gliomas at both cell and tissue levels was interrogated in this work. Two SERS-active materials (Au nanoshells and AuNI) were prepared to collect SERS spectra from cell and tissue samples, respectively. The results demonstrated that the rational design of SERS materials coupled with proper algorithms is crucial for SERS biological analysis.
We not only achieved differentiation of glioma cell subtypes but also realized rapid, label-free identification of glioma tissues. Nevertheless, there are certain limitations in this study. Due to constraints in the clinical setting, the overall number of available clinical samples remains restricted. The number of samples should be increased in subsequent studies to identify more glioma subtypes and obtain more reliable results. Besides the spectral analysis from single-collection, Raman spectral imaging for biological diagnosis should also be developed. Although Raman or SERS-based imaging technology has already found applications in histopathological analysis and tumor resection [43,44], addressing the challenge of real-time, safe, and efficient in vivo brain tumor imaging for relatively delicate brain organs remains a complex problem requiring resolution.
Given the simplicity of sample preparation and the high accuracies of classification models, we conclude that SERS spectra in combination with the intelligent algorithm can be a powerful method for the discrimination of different glioma cell subtypes and the distinction between glioma tissue and non-tumor tissue. Furthermore, this method is expected to be used to examine tumor heterogeneity and distinguish the tumor margins in operation. The fast identification of glioma cell subtypes and glioma tissues by SERS spectra with multivariate analysis can assist doctors in choosing the appropriate treatment as quickly as possible. Further work needs to be carried out for large-scale validation of the reliability of this SERS-based detection method.
The authors declare that they have no known competing financial interests or personal relationships that could have appeared to influence the work reported in this paper.
This study was supported by Key Research and Development Program: Social Development Project (No. BE2021653), Natural Science Foundation of Jiangsu Province (No. BK20201172), Key Program of Health Commission of Jiangsu Province (No. ZBD2020016), Zhejiang Provincial Natural Science Foundation of China (No. LR19H180001).
Supplementary material associated with this article can be found, in the online version, at doi:
P.Y. Wen, S. Kesari, N. Engl. J. Med. 359 (2008) 492–507. doi: 10.1056/NEJMra0708126
D.N. Louis, A. Perry, G. Reifenberger, et al., Acta Neuropathol. 131 (2016) 803–820. doi: 10.1007/s00401-016-1545-1
A.P. Patel, I. Tirosh, J.J. Trombetta, et al., Science 344 (2014) 1396–1401. doi: 10.1126/science.1254257
S.A. Toms, W.C. Lin, R.J. Weil, et al., Neurosurgery 57 (2005) 382–391. doi: 10.1093/neurosurgery/57.2.382
D.M. Irvin, R.S. McNeill, R.E. Bash, C.R. Miller, Brain Pathol. 27 (2017) 36–50. doi: 10.1111/bpa.12348
P. Kleihues, D.N. Louis, B.W. Scheithauer, et al., J. Neuropathol. Exp. Neurol. 61 (2002) 215–225. doi: 10.1093/jnen/61.3.215
A. Kumar, E.A. Boyle, M. Tokita, et al., Genome Biol. 15 (2014) 530. doi: 10.1186/s13059-014-0530-z
M. Venere, H.A. Fine, P.B. Dirks, J.N. Rich, Glia. 59 (2011) 1148–1154. doi: 10.1002/glia.21185
D. Cialla-May, X.S. Zheng, K. Weber, J. Popp, Chem. Soc. Rev. 46 (2017) 3945–3961. doi: 10.1039/C7CS00172J
J.H. Philippon, S.H. Clemenceau, F.H. Fauchon, J.F. Foncin, Neurosurgery 32 (1993) 554–559. doi: 10.1097/00006123-199304000-00010
P. Janny, H. Cure, M. Mohr, et al., Cancer 73 (1994) 1937–1945. doi: 10.1002/1097-0142(19940401)73:7<1937::AID-CNCR2820730727>3.0.CO;2-G
W. Stummer, T. Meinel, C. Ewelt, et al., J. Neurooncol. 108 (2012) 89–97. doi: 10.1007/s11060-012-0798-3
A. Giese, L. Kluwe, B. Laube, et al., Neurosurgery 38 (1996) 755–764. doi: 10.1227/00006123-199604000-00026
N.Y. Agar, A.J. Golby, K.L. Ligon, et al., Neurosurgery 68 (2011) 280–289. doi: 10.1227/NEU.0b013e3181ff9cbb
N.M. Ralbovsky, I.K. Lednev, Chem. Soc. Rev. 49 (2020) 7428–7453. doi: 10.1039/d0cs01019g
C. Zong, M. Xu, L.J. Xu, et al., Chem. Rev. 118 (2018) 4946–4980. doi: 10.1021/acs.chemrev.7b00668
J.J.S. Rickard, V. Di-Pietro, D.J. Smith, et al., Nat. Biomed. Eng. 4 (2020) 610–623. doi: 10.1038/s41551-019-0510-4
X. Ren, L. Huang, C. Wang, et al., Eng. Regen. 3 (2022) 387–396.
X.R. Yang, Q. Zhou, F. Lu, J. Light Scatt. 34 (2022) 306–315. doi: 10.13883/j.issn1004-5929.202204007
S. Cong, X. Liu, Y. Jiang, W. Zhang, Z. Zhao, Innovation 1 (2020) 100051.
J. Langer, D.J. de Aberasturi, J. Aizpurua, et al. Acs Nano 14 (2020) 28–117. doi: 10.1021/acsnano.9b04224
L. Huang, Y. Zhu, C. Xu, et al., ACS Sens. 7 (2022) 1439–1450. doi: 10.1021/acssensors.2c00146
X. Ren, Q. Zhang, J. Yang, Anal. Chem. 93 (2021) 10841–10849. doi: 10.1021/acs.analchem.1c01108
L. Huang, H. Sun, L. Sun, et al., Nat. Commun. 14 (2023) 48. doi: 10.1038/s41467-022-35696-2
Y. Xu, X. Liu, X. Cao, et al., Innovation 2 (2021) 100179.
J.Q. Zuo, Y.K. Wang, H.Q. Wang, L. Geng, J. Light Scatt. 34 (2022) 1–5.
Y.Q. Zhang, X.J. Ye, G.X. Xu, et al., RSC Adv. 6 (2016) 5401–5407. doi: 10.1039/C5RA21758J
K.K. Reza, S. Dey, A. Wuethrich, et al., ACS Nano 15 (2021) 11231–11243. doi: 10.1021/acsnano.0c10008
D. Lin, J. Pan, H. Huang, et al., Sci. Rep. 4 (2014) 4751. doi: 10.1038/srep04751
Y. Chen, Y. Zhang, F. Pan, et al., ACS Nano 10 (2016) 8169–8179. doi: 10.1021/acsnano.6b01441
A.A. Kowalska, S. Berus, Ł. Szleszkowski, et al., Spectrochim. Acta A Mol. Biomol. Spectrosc. 231 (2020) 117769. doi: 10.1016/j.saa.2019.117769
J. Li, C. Wang, Y. Yao, et al., Talanta 216 (2020) 120983. doi: 10.1016/j.talanta.2020.120983
Y. Zhang, X. Ye, G. Xu, et al., RSC Adv. 6 (2016) 5401–5407. doi: 10.1039/C5RA21758J
G. Fan, T. Beta, J. Food Compost. Anal. 62 (2017) 217–222. doi: 10.1016/j.jfca.2017.07.001
P.D. Lewis, K.E. Lewis, R. Ghosal, et al., BMC Cancer 10 (2010) 640. doi: 10.1186/1471-2407-10-640
K.B. Pointer, P.A. Clark, A.B. Schroeder, et al., J. Neurosurg. 126 (2017) 1812–1821. doi: 10.3171/2016.6.JNS152797
V. Senner, S. Ratzinger, S. Mertsch, S. Grässel, W. Paulus, FEBS Lett. 582 (2008) 3293–3300. doi: 10.1016/j.febslet.2008.09.017
H. Abramczyk, A. Imiela, B. Brożek-Płuska, et al., Cancers 11 (2019) E2017. doi: 10.3390/cancers11122017
S.J. Smith, R. Emery, A. Pitsillides, C.E. Clarkin, S. Mahajan, Analyst 142 (2017) 1962–1973. doi: 10.1039/C6AN02469F
Y. Huang, Z. Wu, H. Lui, Sci. Adv. 5 (2019) eaan9388. doi: 10.1126/sciadv.aan9388
C. Krafft, L. Neudert, T. Simat, R. Salzer, Spectrochim. Acta A Mol. Biomol. Spectrosc. 61 (2005) 1529–1535. doi: 10.1016/j.saa.2004.11.017
M. Weller, W. Wick, K. Aldape, et al., Nat. Rev. Dis. Primers 1 (2015) 15017. doi: 10.1038/nrdp.2015.17
T.C. Hollon, B. Pandian, A.R. Adapa, et al., Nat. Med. 26 (2020) 52–58. doi: 10.1038/s41591-019-0715-9
X. Gao, Q. Yue, Z. Liu, et al., Adv. Mater. 29 (2017) 1603917. doi: 10.1002/adma.201603917

Figure 1 Schematic illustration of procedures to obtain Raman spectra of glioma cells (a) and glioma tissues (b).

Figure 2 Preparation and characterization of the SERS-active materials. (a) Transmission electron microscope electron microscopy image of SiO2@Au particles. (b) Extinction spectrum of the SiO2@Au in water. (c) HAADF-STEM image of SiO2@Au and the corresponding element mapping of Au, Si, and their overlap, respectively. (d) Field emission scanning electron microscopy image of AuNI. The inset is the photograph of the substrate.

Figure 3 Gold nanoprobe-based SERS detection at single cell level. (a) Bright-field images of four different types of cells (from left to right: HA1800, U266, U87, and U251) with gold nanoprobes. (b) Averaged SERS spectra obtained from four types of cells. Fifty cell samples were measured for each type of cell.

Figure 4 Identification and classification of different cells in vitro based on SERS spectra and different multivariate statistical methods. (a) Dendrogram from the hierarchical cluster analysis of different types of cells (HA1800: red, U251: green, U266: black, and U87: blue). (b) Principal component analysis (PCA) of four types of cells. Each spot represents one cell and each cell type was coded by different colors and shapes. (c) Analysis result of the support vector machines (SVM) with a linear kernel used for the classification of four cell types.

Figure 5 The average Raman spectra of different tissue samples, including (a) glioma and trauma tissues; (b) glioma tissue samples of patients with different grades; (c) glioma tissue samples of patients with and without IDH mutation. The shaded areas represented standard deviations of means. (d–f) The corresponding OPLS-DA plot of the above three groups. The shaded areas represented a 90% confidence interval.

 扫一扫看文章

扫一扫关注我们
 DownLoad:
 下载:
下载: