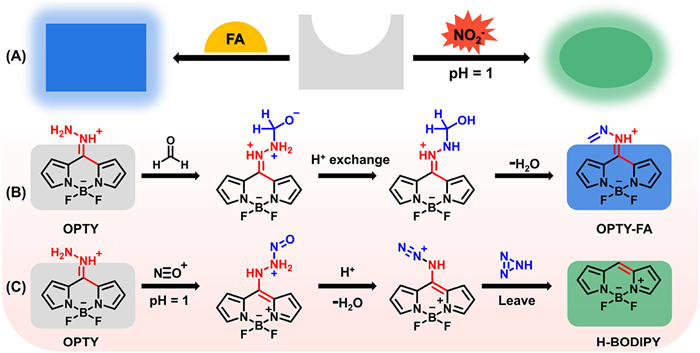
Scheme 1.
Schematic illustration of the probe for detecting formaldehyde and nitrite.
An intelligent sensing platform for discrimination of formaldehyde and nitrite in food
Huan Ye , Ying Yang , Lirong Jiang , Taotao Zhe , Junchao Xu , Lintao Zeng

Formaldehyde (FA) has diverse functions such as disinfection, antisepsis, and sterilization [1-3], and thus is often used illegally as a food additive [4-6]. For example, some illicit vendors spray FA onto cow louvers, duck intestines, squid, and shrimp to preserve their bright appearance, freshness, and tenderness [7,8]. However, excessive intake of FA can lead to leukemia, keratitis, Alzheimer's disease, and even cancer [9-12]. NO2− is commonly utilized as a food preservative to improve the color and flavor of pickled foods while extending their shelf life [13,14]. However, some studies have revealed that excessive consumption of NO2− can lead to diabetes [15], methemoglobinemia [16], cancer [17], and even death [18]. The International Agency for Research on Cancer (IARC) and the World Health Organization (WHO) have clearly identified FA and NO2− as carcinogens [19,20]. Given the potential health risks associated with FA and NO2−, it is crucial to develop efficient and sensitive sensors for their detection.
Up to now, several methods have been developed for the quantitative analysis of FA and NO2−, including chromatography [21,22], spectrophotometry [23], colorimetry [24,25], gas chromatography-mass spectrometry (GC–MS) [26,27], and electrochemical analysis [28]. However, both colorimetry and spectrophotometry suffer from low sensitivity. Chromatographic and electrochemical methods not only require complex sample pretreatment processes, but also rely on precise instruments that are costly and time-consuming, thus limiting their widespread application. The national standards of the People's Republic of China for detecting FA and NO2− are acetylacetone spectrophotometry and the Griess reagent method, respectively. However, these two methods also face issues such as complicated reagent preparation and significant potential for human error. In contrast, the fluorescence analysis offers significant advantages, such as high sensitivity, good selectivity, and real-time visual monitoring [29-32]. In particular, organic fluorescent probes present even greater benefits: (1) diverse chemical structures; (2) ease of modulation in sensing performance; and (3) good repeatability. In recent years, a variety of fluorescent probes for detecting FA have been successfully developed, based on ring-opening reactions [33], cyclization [34], aza-Cope rearrangement [35], and aldimine condensation [36,37]. Similarly, various fluorescent probes targeting NO2− have been developed, based on diazotization [38,39], nitration [40,41], and chelation [42]. Despite these advancements, most fluorescent sensors are limited to detecting only a single analyte. As a new generation of robust analytical tools, a single fluorescent sensor that produces distinct emission responses to multiple targets offers several advantages: (1) cost-effectiveness; (2) high adaptability and efficiency; (3) avoidance of crosstalk when using two or more fluorescent chemical sensors simultaneously; (4) greater portability and intelligence. Since FA and NO2− often coexist in the human diet, their detection is critical. Therefore, it is highly desirable to develop dual-analyte responsive probes that can produce two different fluorescence signals to detect FA and NO2−, though this remains a significant challenge.
Based on the above considerations, we designed a smart fluorescent probe, 8-hydrazine-boron dipyrromethene (OPTY), utilizing boron-dipyrromethene (BODIPY) and hydrazine hydrate. This probe can react with FA and NO2− through different chemical reactions, resulting in two distinguishable fluorescence bands at 465 and 510 nm, respectively. To meet the demand for rapid on-site detection of FA and NO2−, the sensing platform should be portable, sensitive, accurate, and highly efficient. To this end, we used OPTY and acetate cellulose filter paper to fabricate simple, portable, and user-friendly sensing chips. Cellulose-based paper is an ideal material due to its convenience, practicality, low cost, and wide accessibility. Furthermore, the sensing chip was combined with intelligent devices to build a portable sensing platform for detecting FA and NO2−. This platform enables quantitative on-site measurement of FA and NO2− in food samples, achieving low detection limits and satisfactory recovery rates. Therefore, this straightforward and effective sensing platform offers a quick and easy tool for both consumers and regulatory departments to assess food safety.
FA and NO2− are commonly used as food preservatives in daily life, posing significant risks to human health. To ensure food safety, we aimed to design a single powerful fluorescent probe for the simultaneous detection of FA and NO2− (Scheme 1). The BODIPY fluorophore is an excellent building block for fluorescent probes due to its outstanding light stability, high fluorescence quantum yield, good biocompatibility, and ease of chemical modification. In this work, we developed a dual-analyte responsive fluorescent probe, OPTY, by covalently linking hydrazine to BODIPY, with hydrazine serving as the recognition site for both FA and NO2−. OPTY is initially non-fluorescent and colorless due to the formation of a C=N bond between hydrazine and BODIPY. In the presence of 365 nm UV light, OPTY remains non-fluorescent due to a photo-induced electron transfer (PET) process mediated by hydrazine, which quenches the fluorescence. However, in the presence of FA, hydrazine undergoes aldimine condensation to form a hydrazone (OPTY-FA, Figs. S25–S27 in Supporting information), inhibiting the PET pathway and producing strong blue fluorescence. Similarly, NO2− reacts with hydrazine through a diazotization reaction followed by an intramolecular cyclization cascade, generating ordinary BODIPY (H-BODIPY, Figs. S22–S24 in Supporting information), which emits strong green fluorescence. Therefore, OPTY enables the distinct detection of FA and NO2− in food through their respective fluorescence emissions. This fluorescent probe offers several advantages, including high efficiency, simplicity, sensitivity, cost-effectiveness, and environmental friendliness, making it a promising tool for on-site detection of FA and NO2− in food. The chemical structure of OPTY was confirmed by 1H nuclear magnetic resonance (NMR), 13C NMR and high-resolution mass spectrometry (HRMS) (Figs. S17–S21 in Supporting information).
In order to investigate the optimal pH for the test solution, we measured the fluorescence spectral response of OPTY to the analytes in buffers at various pH levels. As illustrated in Fig. S2 (Supporting information), when the buffer pH was set to 1, the solution exhibited negligible fluorescence. With increasing pH, an emission peak centered at 465 nm appeared, accompanied by a gradual enhancement in fluorescence intensity. At pH 7, the fluorescence intensity reached its maximum. These results indicate that OPTY exhibits the most effective fluorescence response to FA under neutral conditions. This can be attributed to the high reactivity of the amino group in neutral environments. At lower pH levels, the amino group is protonated, reducing its reactivity. Furthermore, acidic conditions promote hydrolysis of the reaction products between the probe and FA, resulting in diminished fluorescence. In contrast, the fluorescence response of OPTY to NO2− most pronounced in strongly acidic conditions (Fig. S3 in Supporting information). At pH 1, OPTY displayed a strong absorption peak for NO2− centered at 510 nm. As the pH increased, the fluorescence intensity progressively declined and became nearly non-fluorescent at pH 6. These results demonstrate that OPTY exhibits its best fluorescence response to NO2− at pH 1. This is because diazo salts must be synthesized under strongly acidic conditions. As the pH increases, the acidity diminishes, significantly reducing the reaction activity. Consequently, the fluorescence intensity gradually decreases.
Subsequently, we investigated the optical responses of OPTY to FA and NO2−, respectively. As shown in Fig. 1A, OPTY itself exhibited a strong ultraviolet–visible spectroscopy (UV–vis) absorption band at 383 nm, which redshifted to 422 nm upon reacting with FA. In contrast, interaction with NO2− caused the maximum absorption wavelength of OPTY to shift from 383 nm to 483 nm, accompanied by an obvious color change from colorless to yellow. Furthermore, OPTY also showed distinct fluorescence responses to FA and NO2−. As shown in Fig. 1B, OPTY itself was nearly non-fluorescent. Upon the addition of 100 µmol/L FA, a bright blue fluorescence at 465 nm (Φ = 79.93%) was observed. Conversely, the addition of 70 µmol/L NO2− resulted in high-contrast green fluorescence at 510 nm (Φ = 82.33%). Given these distinct fluorescence responses, we conducted a detailed investigation into the quantitative detection of FA and NO2− using OPTY.
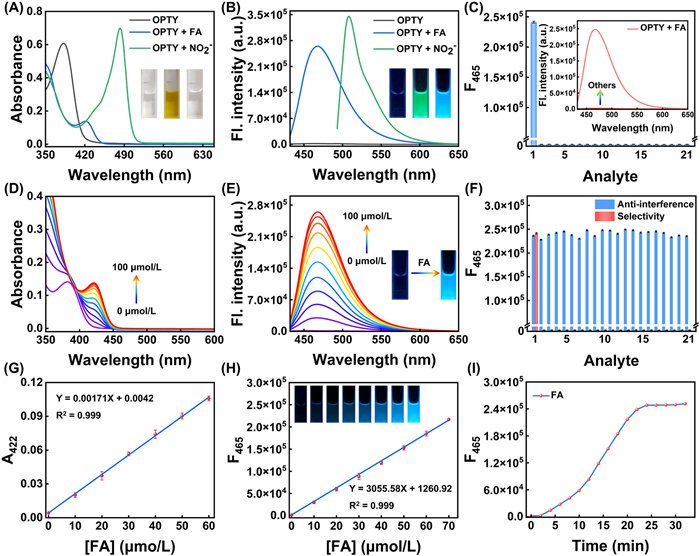
We evaluated the spectral response of OPTY to FA in double-distilled water. As shown in Fig. 1D, OPTY itself exhibited a maximum absorption peak at 383 nm, which differs from traditional BODIPY due to its C=N configuration. Upon the addition of FA (0–100 µmol/L), the absorption peak at 383 nm gradually diminished, while a new absorption band emerged at 422 nm. This shift was attributed to the condensation reaction between the hydrazine group in OPTY and FA, resulting in the formation of a hydrazone group (Figs. S25–S27). This reaction effectively expanded the conjugation structure of the resulting molecule, OPTY-FA. An excellent linearity curve (R2 = 0.999) was obtained when plotting the absorbance at 422 nm against FA concentrations (Fig. 1G). Notably, OPTY itself showed negligible fluorescence. However, with increasing FA concentrations, OPTY activated a blue fluorescence channel at 465 nm, driven by the suppression of the PET effect and the initiation of intramolecular charge transfer (ICT) effect (Fig. 1E). Moreover, the fluorescence intensity at 465 nm showed a favorable linear relationship with FA concentration (R2 = 0.999) (Fig. 1H). Based on the 3σ/k calculation, OPTY demonstrated a limit of detection (LOD) of 26.5 nmol/L for FA (Fig. S4A in Supporting information), indicating its high sensitivity to FA. To assess the response time of OPTY to FA, we monitored the fluorescence intensity changes over time after exposure to 100 µmol/L FA. The fluorescence intensity reached its maximum within 22 min and remained stable thereafter (Fig. 1I).
We also investigated the optical response of OPTY to NO2− in double-distilled water (pH 1). As shown in Fig. 2A, the absorption peak gradually redshifted from 383 nm to 483 nm upon the addition of NO2− (0–70 µmol/L), accompanied by a visible color change from colorless to yellow. This shift was attributed to the diazotization and intramolecular cyclization cascade between the hydrazine group in OPTY and NO2−, which resulted in the formation of a classic BODIPY structure. Moreover, the disappearance of the C=N bond increased molecular planarity, leading to the observed 100 nm redshift. This distinct chromogenic reaction enables the visual detection of NO2− with the naked eyes. A favorable linearity curve (R2 = 0.998) was observed when plotting the UV–vis absorbance at 465 nm against NO2− concentrations (Fig. 2D). In terms of fluorescence, the reaction with NO2− produced a classic BODIPY structure, resulting in an intense fluorescent band at 510 nm. This corresponds to a green fluorescence channel being activated by the structural transition from C=N to C–N (Fig. 2B). As shown in Fig. 2E, a highly linear relationship (R2 = 0.999) was obtained when plotting fluorescence intensity against NO2− concentrations (0–56 µmol/L). Using the 3σ/k method, OPTY demonstrated a LOD of 20.8 nmol/L for NO2− (Fig. S4B in Supporting information), confirming its high sensitivity. To assess response speed, we recorded the fluorescence intensity at 510 nm after the addition of 70 µmol/L NO2−. The fluorescence intensity plateaued within 9 s (Fig. 2H), suggesting OPTY's rapid response to NO2−.
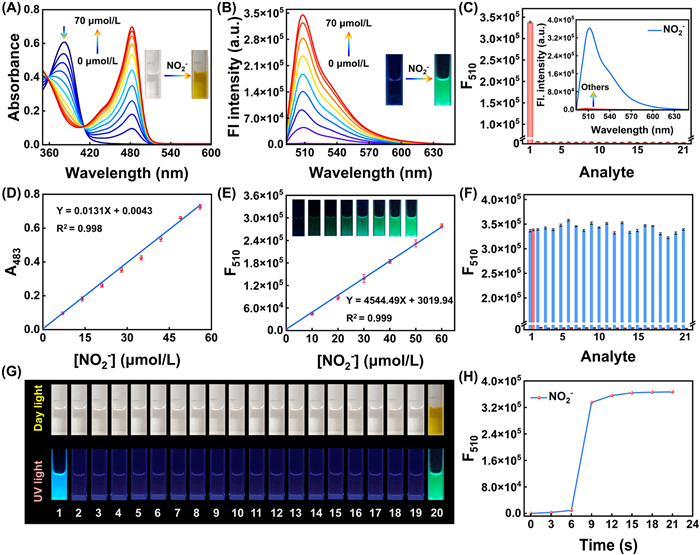
We also evaluated the specificity of OPTY towards FA and NO2− (Fig. 2G). Fluorescence changes were measured upon exposure to various analytes, including cysteine (Cys), isoleucine (Ile), leucine (Leu), lysine (Lys), methionine (Met), phenylalanine (Phe), serine (Ser), tryptophan (Trp), valine (Val), H2O2, CO32−, S2−, SO42−, Cl−, Ca2+, Mg2+, malonaldehyde, 2,4-dihydroxybenzaldehyde, 4-hydroxybenzaldehyde, trifluoroacetic acid, and FA. As shown in Fig. 1C, FA enhanced the fluorescence intensity by 70-fold, accompanied by bright blue fluorescence, whereas the fluorescence changes caused by other substances were negligible. This selectivity can be attributed to two factors: (1) FA is a strong electrophilic reagent and easy to condense with the hydrazine group in OPTY; (2) FA is the smallest aldehyde compared with other aldehydes, which has minimal steric hindrance, allowing it to efficiently form hydrazone with hydrazine [5]. The competitive selectivity test further demonstrated that the presence of other analytes had minimal influence on OPTY's fluorescence response to FA (Fig. 1F and Fig. S5 in Supporting information). These results confirm OPTY's excellent selectivity for FA, even in the presence of potential interfering substances. Next, we studied the selectivity of OPTY towards NO2−. The fluorescence spectra of OPTY were measured in the presence of various analytes (Cys, Ile, Leu, Lys, Met, Phe, Ser, Trp, Val, H2O2, HCO3−, CO32−, HS−, HSO3−, SO32−, SO42−, HPO42−, H2PO4−, Cl−, and Na+). No significant fluorescence response was observed between OPTY and these substances. However, in the presence of NO2−, OPTY exhibited a remarkable fluorescence enhancement (73-fold) at 510 nm (Fig. 2C), resulting in a yellow solution with bright green fluorescence. This highly selective fluorescence response can be attributed to the favorable configuration of the C=N bond, which facilitates intramolecular cycloaddition, thereby enhancing OPTY's specific interaction with NO2− [20]. The anti-interference experiment (Fig. 2F and Fig. S6 in Supporting information) further validated that OPTY maintained a robust fluorescence response to NO2−, even in the presence of potential interfering analytes. These results confirm that OPTY possesses excellent specificity and selectivity for NO2−. In summary, these findings demonstrate that OPTY is a highly selective and reliable probe for the detection of both FA and NO2−, with robust performance even in the presence of various interfering substances.
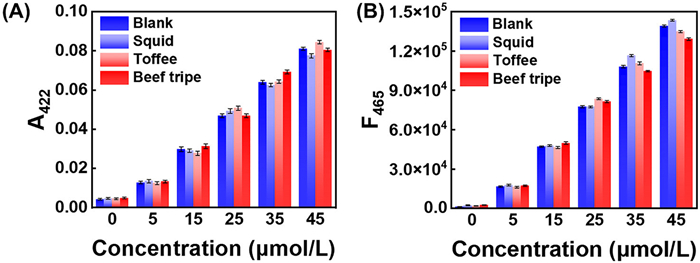
FA is often illegally used in food processing, posing serious health risks. To address this, we investigated the detection of FA in food. Squid, toffee, and beef tripe were selected as real food samples to evaluate the ability of OPTY to detect FA (Fig. 3). As shown in Fig. S7 (Supporting information), the spectral responses of OPTY to the three food extracts closely mirrored its interaction with FA (Figs. 1D and E), exhibiting consistent behavior as the spiked FA concentration increased. Notably, the UV–vis absorption at 422 nm and fluorescence intensity at 465 nm increased after the addition of food extracts, confirming the presence of FA in these samples. Using the established linear relationship between OPTY and FA concentration, the FA content in squid, toffee, and beef tripe was calculated to be 4.52, 3.40, and 4.37 µg/g according to their UV–vis absorption, respectively (Table S1 in Supporting information). Similarly, based on fluorescence intensity (Fig. S8 in Supporting information), the FA content was determined to be 4.70, 3.50, and 4.20 µg/g, respectively (Table 1). In addition, the recovery rates of FA in squid, toffee, and beef tripe ranged from 90.78% to 108.10%, with a relative standard deviation (RSD) of < 3%, based on UV–vis absorbance. And from 92.62% to 106.55% (RSD < 5%) based on fluorescence intensity. These results demonstrate that OPTY exhibits low analytical error, high accuracy, and excellent repeatability in FA detection. To validate the accuracy of the OPTY-based quantitative method, a commercial FA rapid detection tube designed for food analysis was used as a reference. The color changes observed in Fig. S13 (Supporting information) indicated FA concentrations ranging from 0 to 5 mg/kg in the tested food samples, further supporting the reliability of the OPTY method. Moreover, a comparison with other FA probes (Table S4 and Fig. S16 in Supporting information) revealed that OPTY offers superior selectivity, higher sensitivity, and better repeatability, making it a promising dual-response fluorescent probe for quantitative FA determination in real food samples.
 DownLoad:
CSV
DownLoad:
CSV
| Sample | FA (µg/g) | FA (µmol/L) | Spiked FA (µmol/L) | Found (µmol/L) | Recovery (%) | RSD (%) |
| Squid | 4.70 | 0.39 | 5.00 | 5.38 ± 0.12 | 100.58 | 3.38 |
| 15.00 | 15.25 ± 0.37 | 99.38 | 1.19 | |||
| 25.00 | 24.93 ± 0.34 | 98.40 | 3.41 | |||
| 35.00 | 37.67 ± 0.13 | 106.48 | 4.05 | |||
| 45.00 | 46.52 ± 0.22 | 102.56 | 2.73 | |||
| Toffee | 3.50 | 0.29 | 5.00 | 4.91 ± 0.16 | 94.39 | 4.03 |
| 15.00 | 14.78 ± 0.36 | 97.14 | 1.15 | |||
| 25.00 | 26.91 ± 0.33 | 106.55 | 3.67 | |||
| 35.00 | 35.76 ± 0.28 | 101.50 | 3.85 | |||
| 45.00 | 43.70 ± 0.47 | 96.66 | 2.57 | |||
| Beef tripe | 4.20 | 0.35 | 5.00 | 5.23 ± 0.25 | 99.05 | 3.26 |
| 15.00 | 15.88 ± 0.14 | 103.93 | 1.23 | |||
| 25.00 | 23.97 ± 0.38 | 94.82 | 3.14 | |||
| 35.00 | 33.86 ± 0.29 | 95.98 | 3.65 | |||
| 45.00 | 41.83 ± 0.11 | 92.62 | 2.45 |
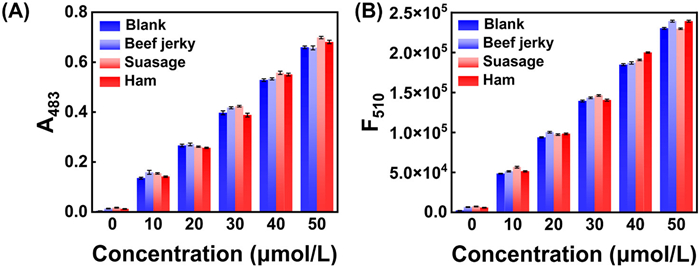
NO2− levels exceeding the standard in food can be harmful to human health, making its determination in food essential. Since sausage, beef jerky, and ham commonly use NO2− to extend shelf life, these were chosen as food samples to investigate the ability of OPTY to detect NO2− (Fig. 4). As shown in Fig. S9 (Supporting information), the maximum UV–vis absorption wavelength of OPTY redshifted from 383 nm to 483 nm, and the fluorescence band at 510 nm was enhanced after the addition of food sample extracts. In addition, as NO2− concentrations increased, the spectral responses of the food extracts to OPTY were consistent with the spectra of OPTY in response to NO2−. These results suggest that NO2− is present in the food samples. Based on the linearity curve established between UV–vis absorption and NO2−, the NO2− content in sausage, beef jerky, and ham was calculated to be 20.18, 26.34, and 16.81 µg/g, respectively. Similarly, using the linearity curve established between fluorescence intensity and NO2− (Fig. S10 in Supporting information), the NO2− content in these foods was calculated to be 21.85, 26.41, and 17.39 µg/g, which is below the maximum allowable content for food (30 µg/g). The national standard method, the Griess assay, was used to calibrate the content of NO2− in these food samples. As shown in Fig. S14 (Supporting information), the NO2− content of three food extracts was calculated to be 21.29, 27.34, and 17.80 µg/g, respectively. The accuracy of the fluorescence method was 102.63%, 96.60% and 97.70%, demonstrating that this quantitative method is reliable. In addition, based on the calibration curve between the probe and NO2−, the NO2− content in the spiked food samples was calculated, and the results are summarized in Table 2 and Table S2 (Supporting information). The recovery rates of NO2− in the three food types ranged from 92.98% to 108.20% (RSD < 3%) as determined by UV absorbance. The recovery rates based on fluorescence intensity were 97.87% to 107.44%, with an RSD of < 2%. These data demonstrate that the OPTY detection method has low analysis error, high accuracy, and good repeatability, making it a reliable tool for the quantitative detection of NO2− in food. To further illustrate the performance of OPTY, we compared it with other NO2− probes in Table S3 and Fig. S15 (Supporting information). It is evident that the double response fluorescent probe OPTY possesses higher sensitivity, faster response and better repeatability than other probes.
 DownLoad:
CSV
DownLoad:
CSV
| Sample | NO2− (µg/g) | NO2− (µmol/L) | Spiked NO2− (µmol/L) | Found (µmol/L) | Recovery (%) | RSD (%) |
| Beef jerky | 21.85 | 0.79 | 10.00 | 10.64 ± 0.10 | 98.65 | 0.12 |
| 20.00 | 21.41 ± 0.21 | 103.00 | 0.31 | |||
| 30.00 | 30.88 ± 0.34 | 100.29 | 0.42 | |||
| 40.00 | 40.48 ± 0.13 | 99.24 | 0.37 | |||
| 50.00 | 51.98 ± 0.23 | 102.35 | 0.56 | |||
| Sausage | 26.41 | 0.96 | 10.00 | 11.78 ± 0.26 | 107.44 | 1.13 |
| 20.00 | 20.75 ± 0.31 | 99.00 | 0.61 | |||
| 30.00 | 31.50 ± 0.14 | 101.77 | 0.82 | |||
| 40.00 | 41.30 ± 0.43 | 100.84 | 0.27 | |||
| 50.00 | 49.88 ± 0.38 | 97.87 | 0.36 | |||
| Ham | 17.39 | 0.63 | 10.00 | 10.64 ± 0.25 | 100.13 | 0.44 |
| 20.00 | 20.97 ± 0.14 | 101.66 | 0.47 | |||
| 30.00 | 30.25 ± 0.34 | 98.75 | 0.46 | |||
| 40.00 | 43.36 ± 0.15 | 106.72 | 1.07 | |||
| 50.00 | 51.98 ± 0.13 | 102.67 | 0.58 |
Achieving rapid on-site determination of food contaminants is crucial for ensuring food safety. However, this task is challenging because the inspection tools should be portable. To address this, OPTY was loaded onto acetate cellulose to make a portable sensing strip for on-site detection of FA/NO2− in food. By combining the information acquisition and processing capabilities of a smartphone with OPTY sensing chips, an intelligent sensing method was developed. Fluorescent images can be captured through a smartphone, and the red, green, blue (RGB) signals are extracted and converted into digital signals through an intelligent data analysis module. As a result, this intelligent sensing method allows for the detection of FA/NO2− in food without the need for large-scale instruments.
As shown in Fig. 5A, the blue fluorescence intensity of the sensing chips gradually increased after the addition of different concentrations of FA. This observation demonstrated that the OPTY sensing chips could effectively respond to FA, enabling the on-site detection of FA in food. Fluorescence images were captured using a smartphone, and the RGB values were extracted for analysis. Fig. 5C displayed that the B value associated with the chip's coloration, showed a linear correlation with FA concentrations (0–80 µmol/L) (R2 = 0.996). Similarly, as NO2− concentration increased, an incremental rise in green fluorescence was observed for the sensing chips (Fig. 5B). As shown in Fig. 5D, after reacting with NO2−, fluorescence images were captured, and RGB values were extracted. The G value corresponding to the fluorescence color of the chip exhibited a good linear relationship with NO2− concentrations (0–60 µmol/L) (R2 = 0.997). In addition, selectivity tests revealed that some interfering substances caused negligible fluorescence changes in the sensing chips (Figs. S11 and S12 in Supporting information). These results indicate that the portable OPTY sensing chips have good selectivity and high sensitivity, making them ideal for rapid on-site detection of FA/NO2− in food. This intelligent sensing method is simple, cost-effective, and portable, providing an efficient way to accurately detect FA/NO2− in food.
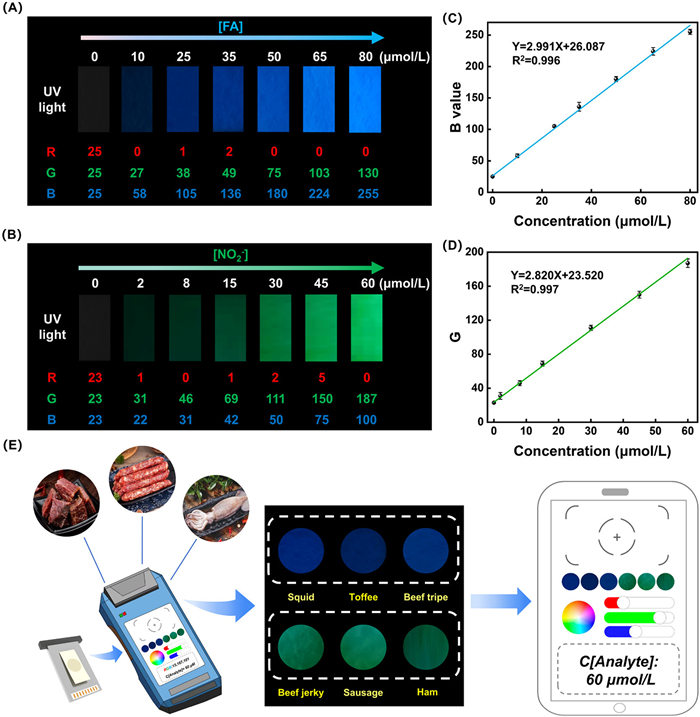
Accurate and efficient on-site inspection is crucial for ensuring food safety. To achieve this, a novel intelligent sensing platform was developed by combining a UV lamp, an intelligent device, and an OPTY sensing chip into a single kit for the detection of FA/NO2− in food. The platform could record and read the RGB values from the sensing chip, and the analyte concentration of analytes could be determined through intelligent data analysis based on a standard curve. As shown in Fig. 5E, food sample extracts were directly dripped on the sensing chip to measure the analyte content in food. After reacting with toffee, squid, and beef tripe, the sensing chip displayed blue fluorescence, indicating the presence of FA in these foods. The FA content in toffee, squid, and beef tripe was calculated to be 3.26, 4.61, and 4.36 µg/g, respectively. To verify the accuracy of the sensing chips, commercial FA detection reagents for food were used, yielding consistent results (Fig. S13 in Supporting information). In addition, the sensing chip showed green fluorescence after reacting with beef jerky, sausage, and ham, indicating the presence of NO2− in these foods. The content of NO2− in beef jerky, sausage, and ham was calculated to be 20.67, 25.56, and 18.22 µg/g, respectively. To assess the accuracy of this platform, the Griess assay was used to measure NO2− content in these food samples. The intelligent sensing platform demonstrated excellent accuracy with rates of 97.07%, 93.49% and 102.35%, respectively. These results indicating that the new intelligent sensing platform offers excellent applicability, precision, and reliability for the rapid on-site detection of FA/NO2− in food, providing a straightforward and effective tool for food safety monitoring.
In summary, we constructed a smart fluorescent probe, OPTY, based on BODIPY and hydrazine hydrate. This probe can react with FA and NO2− through different chemical reactions, producing two distinguishable fluorescence bands at 465 and 520 nm, respectively. The fluorescent sensor offers several advantages, including high sensitivity, low detection limits, good selectivity, and a high contrast ratio. Moreover, a portable sensing platform was established by integrating OPTY sensing chips with a UV lamp and an intelligent device, which can quantify the concentrations of FA/NO2− by analyzing the RGB values from the sensing chips. The platform has been successfully applied to detect FA/NO2− in food, demonstrating high sensitivity, low cost, ease of use, good portability, and high accuracy. It provides a simple and practical detection tool for food safety monitoring by regulatory authorities and ordinary consumers alike. This work not only presents an accurate, reliable, and practical intelligent platform for the rapid on-site detection of FA/NO2−, but also offers a promising strategy for designing novel fluorescent probes capable of detecting dual analytes.
The authors declare that they have no known competing financial interests or personal relationships that could have appeared to influence the work reported in this paper.
Huan Ye: Writing – original draft, Methodology, Investigation, Formal analysis. Ying Yang: Writing – original draft, Methodology, Investigation, Formal analysis. Lirong Jiang: Writing – review & editing, Methodology, Formal analysis. Taotao Zhe: Methodology, Investigation. Junchao Xu: Methodology, Formal analysis. Lintao Zeng: Writing – review & editing, Supervision.
Acknowledgement for the Natural Science Foundation of Guangxi (No. 2020GXNSFDA297030), the National Natural Science Foundation of China (Nos. 22464002, 22468014, 21978222), and the China Postdoctoral Science Foundation (No. 2023M741129).
Supplementary material associated with this article can be found, in the online version, at doi:
Y. Suzuki, N. Nakano, K. Suzuki, Environ. Sci. Technol. 37 (2003) 5695–5700. doi: 10.1021/es0305050
J. Xu, Y. Zhang, L. Zeng, et al., Talanta 160 (2016) 645–652. doi: 10.1016/j.talanta.2016.08.010
Z. Xu, J. Chen, L.L. Hu, et al., Chin. Chem. Lett. 28 (2017) 1935–1942. doi: 10.1016/j.cclet.2017.07.018
G. Yuan, H. Ding, L. Peng, et al., Food Chem. 331 (2020) 127221. doi: 10.1016/j.foodchem.2020.127221
H. Ye, Y. Ke, C. Yue, et al., Dyes Pigm. 207 (2022) 110782. doi: 10.1016/j.dyepig.2022.110782
Y. Wang, C. Zhang, R. Yu, et al., Spectrochim. Acta A 309 (2024) 123794. doi: 10.1016/j.saa.2023.123794
T. Zhang, X. Xin, Y. Xue, et al., LWT - Food Sci. Technol. 97 (2018) 676–683. doi: 10.1016/j.lwt.2018.07.056
F. Bianchi, M. Careri, M. Musci, et al., Food Chem. 100 (2007) 1049–1053. doi: 10.1016/j.foodchem.2005.09.089
Z. Li, Y. Xu, H. Zhu, et al., Chem. Sci. 8 (2017) 5616–5621. doi: 10.1039/C7SC00373K
L. Jiang, B. Zhu, Y. Shao, et al., Dyes Pigm. 220 (2023) 111771. doi: 10.1016/j.dyepig.2023.111771
Y. Zhang, Y. Yang, X. He, et al., J. Cell. Mol. Med. 25 (2021) 5358–5371. doi: 10.1111/jcmm.16602
Y.T. Zhang, L.G. Liao, M. Tan, et al., Microchem. J. 199 (2024) 110090. doi: 10.1016/j.microc.2024.110090
A.U. Alahakoon, D.D. Jayasena, S. Ramachandra, et al., Trends Food Sci. Technol. 45 (2015) 37–49. doi: 10.1016/j.tifs.2015.05.008
W. Bedale, J.J. Sindelar, A.L. Milkowski, Meat. Sci. 120 (2016) 85–92. doi: 10.1016/j.meatsci.2016.03.009
Z. Bahadoran, A. Ghasemi, P. Mirmiran, et al., World J. Diabetes 7 (2016) 433–440. doi: 10.4239/wjd.v7.i18.433
J. Wu, L. Jiang, P. Verwilst, et al., Chem. Commun. 55 (2019) 9947–9950. doi: 10.1039/C9CC05048E
R. Peng, L. Wang, P. Yu, et al., J. Agric. Food Chem. 70 (2022) 353–359. doi: 10.1021/acs.jafc.1c04591
A. Mudan, D. Repplinger, J. Lebin, et al., J. Emerg. Med. 59 (2020) E85–E88. doi: 10.1016/j.jemermed.2020.06.031
Z. Soltanpour, Y. Mohammadian, Y. Fakhri, Environ. Res. 204 (2022) 112094. doi: 10.1016/j.envres.2021.112094
Y. Ke L. Zeng, X. Yang, et al., Food Chem. 438 (2024) 138044. doi: 10.1016/j.foodchem.2023.138044
Z. Lin, W. Xue, H. Chen, et al., Anal. Chem. 83 (2011) 8245–8251. doi: 10.1021/ac202039h
H.S. Lim, S.J. Lee, E. Choi, et al., Food Chem. 382 (2022) 132280. doi: 10.1016/j.foodchem.2022.132280
S. Huang, Z. Li, M. Liu, et al., Chem. Commun. 58 (2022) 1442–1453. doi: 10.1039/D1CC05644A
W. Wongniramaikul, W. Limsakul, A. Choodum, Food Chem. 249 (2018) 154–161. doi: 10.1016/j.foodchem.2018.01.021
C. Fàbrega, L. Fernández, O. ́Monereo, et al., ACS Sens. 2 (2017) 1612–1618. doi: 10.1021/acssensors.7b00463
H.S. Shin, H.H. Lim, Int. J. Food Sci. Technol. 47 (2012) 350–356. doi: 10.1111/j.1365-2621.2011.02845.x
S.X. Zhang, R. Peng, R. Jiang, et al., J. Chromatogr. A 1538 (2018) 104–107. doi: 10.1016/j.chroma.2018.01.026
S. Lu, H. Jia, M. Hummel, et al., RSC Adv. 11 (2021) 4472–4477. doi: 10.1039/D0RA10522H
C.J. Chang, T. Gunnlaugsson, T.D. James, Chem. Soc. Rev. 44 (2015) 4484–4486. doi: 10.1039/C5CS90065D
Y. Liao, Liang Y, Y. Huang, et al., Chin. Chem. Lett. 35 (2024) 109092. doi: 10.1016/j.cclet.2023.109092
P. Huang, W. Zhang, J. Wang, et al., Chin. Chem. Lett. 36 (2025) 109778. doi: 10.1016/j.cclet.2024.109778
W. Chen, Y. Guan, Q. Chen, et al., Dyes Pigm. 200 (2022) 110134. doi: 10.1016/j.dyepig.2022.110134
Z. Li, Z. Xue, Z. Wu, et al., Org. Biomol. Chem. 9 (2011) 7652–7654. doi: 10.1039/c1ob06448g
C. Liu, X. Jiao, S. He, et al., Dyes Pigm. 138 (2017) 23–29. doi: 10.1016/j.dyepig.2016.11.020
T.F. Brewer, C.J. Chang, J. Am. Chem. Soc. 137 (2015) 10886–10889. doi: 10.1021/jacs.5b05340
Y. Cao, Z. Teng, J. Zhang, et al., Sens. Actuator B: Chem. 320 (2020) 128354. doi: 10.1016/j.snb.2020.128354
N. Ding, Z. Li, Y. Hao, et al., Food Chem. 384 (2022) 132426. doi: 10.1016/j.foodchem.2022.132426
Z. Ma, J. Li, X. Hu, et al., Adv. Sci. 7 (2020) 2002991. doi: 10.1002/advs.202002991
V. Kumar, M. Banerjee, A. Chatterjee, Talanta 99 (2012) 610–615. doi: 10.1016/j.talanta.2012.06.045
L. Singh, N. Ranjan, J. Am. Chem. Soc. 145 (2023) 2745–2749. doi: 10.1021/jacs.2c10850
Q. Wang, S. Ma, H. Huang, et al., Food Control 63 (2016) 117–121. doi: 10.1016/j.foodcont.2015.11.023
L. Xie, R. Zheng, L. Li, Dyes Pigm. 203 (2022) 110374. doi: 10.1016/j.dyepig.2022.110374

Figure 1 (A) UV–vis absorption spectra and (B) fluorescence spectra of OPTY (10 µmol/L) in the presence of FA (100 µmol/L) and NO2− (70 µmol/L). (C) Fluorescence response of OPTY (10 µmol/L) to various analytes: (1) FA, (2) Cys, (3) Leu, (4) Lys, (5) Met, (6) Phe, (7) Ser, (8) Trp, (9) Val, (10) Ile, (11) Mg2+, (12) Ca2+, (13) SO42−, (14) S2−, (15) CO32−, (16) Cl−, (17) H2O2, (18) 2,4-dihydroxybenzaldehyde, (19) 4-hydroxybenzaldehyde, (20) malonaldehyde, and (21) trifluoroacetic acid. The concentrations of all analytes were 100 µmol/L. (D) UV–vis absorption spectra and (E) fluorescence spectra of OPTY in response to FA. (F) Anti-interference capability of OPTY towards FA. Linear relationships between (G) UV–vis absorbance at 422 nm and (H) fluorescence intensity at 465 nm of OPTY with varying FA concentrations. (I) Time-dependent fluorescence intensity changes of OPTY (10 µmol/L) in response to FA (100 µmol/L). Error bars represent mean ± SD (n = 3).

Figure 2 (A) UV–vis absorption spectra and (B) fluorescence spectra of OPTY (10 µmol/L) in response to NO2−. (C) Fluorescence response of OPTY (10 µmol/L) to various analytes: (1) NO2−, (2) Ile, (3) Leu, (4) Lys, (5) Met, (6) Phe, (7) Ser, (8) Trp, (9) Val, (10) Cys, (11) Na+, (12) HS−, (13) HSO3−, (14) SO32−, (15) SO42−, (16) HPO42−, (17) H2PO4−, (18) HCO3−, (19) Cl−, (20) CO32−, and (21) H2O2. The concentrations of all analytes were 70 µmol/L. Linear relationship between (D) UV–vis absorbance at 483 nm and (E) fluorescence intensity at 510 nm of OPTY with varying NO2− concentrations. (F) Anti-interference capability of OPTY towards NO2−. (G) Images illustrating the response of OPTY to various analytes under daylight and UV light: (1) FA, (2) malonaldehyde, (3) 2,4-dihydroxybenzaldehyde, (4) 4-hydroxybenzaldehyde, (5) trifluoroacetic acid, (6) Cys, (7) Ile, (8) Leu, (9) Lys, (10) Met, (11) Phe, (12) Ser, (13) Trp, (14) Val, (10) Na+, (11) Cl−, (12) HS−, (13) HSO3−, (14) SO32−, (15) SO42−, (16) HPO42−, (17) H2PO4−, (18) HCO3−, (19) H2O2 and (20) NO2−. (H) Time-dependent fluorescence intensity changes of OPTY (10 µmol/L) in response to NO2− (70 µmol/L). Error bars represent mean ± SD (n = 3).

Figure 3 Comparison of (A) UV–vis absorption and (B) fluorescence intensity of FA in food. The excitation wavelength is 422 nm. Slit: 2.0/2.0 nm. Error bars represent mean ± SD (n = 3).

Figure 4 Comparison of (A) UV–vis absorption and (B) fluorescence intensity of NO2− in food. The excitation wavelength is 483 nm. Slit: 2.0/2.0 nm. Error bars represent mean ± SD (n = 3).

Figure 5 Fluorescence response of OPTY sensing chip towards different concentrations of (A) FA and (B) NO2−. (C) Linear relationship between the B value of the OPTY sensing chip and the FA concentration (0–80 µmol/L). (D) Linear relationship between the G value of the OPTY sensing chip and the NO2− concentration (0–60 µmol/L). (E) Detection of different food samples by the OPTY intelligent sensing platform.
Table 1. The content of FA in real food samples was quantified using OPTY.
| Sample | FA (µg/g) | FA (µmol/L) | Spiked FA (µmol/L) | Found (µmol/L) | Recovery (%) | RSD (%) |
| Squid | 4.70 | 0.39 | 5.00 | 5.38 ± 0.12 | 100.58 | 3.38 |
| 15.00 | 15.25 ± 0.37 | 99.38 | 1.19 | |||
| 25.00 | 24.93 ± 0.34 | 98.40 | 3.41 | |||
| 35.00 | 37.67 ± 0.13 | 106.48 | 4.05 | |||
| 45.00 | 46.52 ± 0.22 | 102.56 | 2.73 | |||
| Toffee | 3.50 | 0.29 | 5.00 | 4.91 ± 0.16 | 94.39 | 4.03 |
| 15.00 | 14.78 ± 0.36 | 97.14 | 1.15 | |||
| 25.00 | 26.91 ± 0.33 | 106.55 | 3.67 | |||
| 35.00 | 35.76 ± 0.28 | 101.50 | 3.85 | |||
| 45.00 | 43.70 ± 0.47 | 96.66 | 2.57 | |||
| Beef tripe | 4.20 | 0.35 | 5.00 | 5.23 ± 0.25 | 99.05 | 3.26 |
| 15.00 | 15.88 ± 0.14 | 103.93 | 1.23 | |||
| 25.00 | 23.97 ± 0.38 | 94.82 | 3.14 | |||
| 35.00 | 33.86 ± 0.29 | 95.98 | 3.65 | |||
| 45.00 | 41.83 ± 0.11 | 92.62 | 2.45 |
 下载: 导出CSV
Table 2. The content of NO2− in real food samples was quantified using OPTY.
| Sample | NO2− (µg/g) | NO2− (µmol/L) | Spiked NO2− (µmol/L) | Found (µmol/L) | Recovery (%) | RSD (%) |
| Beef jerky | 21.85 | 0.79 | 10.00 | 10.64 ± 0.10 | 98.65 | 0.12 |
| 20.00 | 21.41 ± 0.21 | 103.00 | 0.31 | |||
| 30.00 | 30.88 ± 0.34 | 100.29 | 0.42 | |||
| 40.00 | 40.48 ± 0.13 | 99.24 | 0.37 | |||
| 50.00 | 51.98 ± 0.23 | 102.35 | 0.56 | |||
| Sausage | 26.41 | 0.96 | 10.00 | 11.78 ± 0.26 | 107.44 | 1.13 |
| 20.00 | 20.75 ± 0.31 | 99.00 | 0.61 | |||
| 30.00 | 31.50 ± 0.14 | 101.77 | 0.82 | |||
| 40.00 | 41.30 ± 0.43 | 100.84 | 0.27 | |||
| 50.00 | 49.88 ± 0.38 | 97.87 | 0.36 | |||
| Ham | 17.39 | 0.63 | 10.00 | 10.64 ± 0.25 | 100.13 | 0.44 |
| 20.00 | 20.97 ± 0.14 | 101.66 | 0.47 | |||
| 30.00 | 30.25 ± 0.34 | 98.75 | 0.46 | |||
| 40.00 | 43.36 ± 0.15 | 106.72 | 1.07 | |||
| 50.00 | 51.98 ± 0.13 | 102.67 | 0.58 |
下载: 导出CSV

 扫一扫看文章

扫一扫关注我们
