
Scheme 1.
Schematic illustrations of (A) synthesis procedure of magnetic bimetallic hydrogel and (B) ion-interferential cell cycle arrest for melanoma treatment.
Ion-interferential cell cycle arrest for melanoma treatment based on magnetocaloric bimetallic-ion sustained release hydrogel
Zheyi Li , Xiaoyang Liang , Zitong Qiu , Zimeng Liu , Siyu Wang , Yue Zhou , Nan Li

Melanoma is kind of skin cancer results from the uncontrolled growth of melanocytes, which has important features including excessive cell division and continuous proliferation. Currently, melanoma shows a yearly increase in incidence, a tendency to younger age of onset, easy metastasis, and poor prognosis [1-4]. The treatment of localized melanoma depends upon the stage of disease, which mainly include surgery, radiotherapy, immunotherapy and chemotherapy [5-8]. Among these methods, chemotherapeutic drugs targeting the cell cycle such as platinum, amides and paclitaxel are widely used in the clinic. However, melanoma becomes resistant to the drugs as patients use them over time, leading to further melanoma development and eventually patients' death [9,10]. Currently in the field of nanomedicine research for cancer treatment, although some nanomedicines have shown promising effects in killing tumor cells, there are certain risks associated with their safety, long-term treatment, and specific efficacy in melanoma treatment [11-14]. Therefore, there is an urgent need to develop options for melanoma-specific and efficient treatment.
The two phases of melanoma cell cycle are reported to be the most important: G1/S and G2/M. During the G1 phase, cells accomplish most of their growth and store proteins and organelles for normal functions of DNA synthesis. After this, the cells turn into the G2 phase, when they start to prepare the newly replicated DNA to the necessary organelles for entry into the mitosis phase [15-17]. Therefore, the inhibition of melanoma cell proliferation via cell cycle arrest represents a promising and effective anticancer strategy. However, preclinical studies have found that cell cycle inhibitors activate autophagy by suppressing cyclin D1 expression, which triggers the proliferation and metastasis of melanoma cells by degrading damaged organelles as well as inducing treatment failure by providing energy for the cell cycle process [18-21].
The method using ions to disturb intracellular biological process is called ion-interference therapy, which provides inspiration of simultaneously regulating cell cycle arrest to treat melanoma. Metal ions are involved in the regulation of numerous physiological activities, among which they have a prominent role in maintaining the homeostasis of the tumor cell environment, such as maintenance of osmotic pressure, activation of signaling pathways, and synthesis of proteins [22-25]. Many metal ions play a role in the cell cycle arrest, such as manganese ions (Mn2+) content could affect cellular functions like spreading, proliferation as well as gene expression [26-29]. Besides, a significant autophagy defect results from the iron ions (Fe2+/Fe3+) overload through mammalian target of rapamycin 1 (mTORC1)–UV radiation resistance associated gene (UVRAG) inhibition [30-33]. However, there exist serious limitations for the application of single ion arrest in the in vivo treatment, for example, its short duration of circulation, lack of discriminability between tumor and healthy tissues, and dose-limiting systemic toxicity. What is more, the permeability of the tumor vasculature limits the applicability of ions in most treatments. Therefore, interfering with intracellular metal ion homeostasis for cell cycle arrest could be a promising melanoma treatment strategy.
Hydrogels are a class of polymers with three-dimensional mesh structure, which have good biocompatibility, enhanced adhesion, and extended retention time [34-37]. Specifically, magnetic hydrogel is a polymer system with special functions formed by loading magnetic nanoparticles through various physical/chemical methods, which is commonly used for drug delivery, tumor magneto-thermal therapy, soft tissue repair, etc. [38-40]. When bimetallic magnetic nanoparticles are selected for forming hydrogels, not only functional enhancement of the delivery system but also optimization of in vivo therapeutic effects can be achieved. Therefore, we could design and construct a suitable magnetocaloric bimetallic ion sustained release hydrogel to maximize the effect of ion-interferential cell cycle arrest based on increasing its retention time and achieve efficient treatment of melanoma.
In this study, manganese iron oxide (MFO) nanocubes were firstly prepared by thermal reduction method and combined with PEG (MFO@PEG) to further enhance the biocompatibility. Subsequently, injectable magnetic bimetallic hydrogels (MFO@PEG-Gels) were designed by free-radical polymerization synergistic co-precipitation method with thermosensitive materials N-isopropyl acrylamide (NIPAM)/stearyl acrylate (SA) working as monomers and the cross-linking agent is N, N′-methylenebisacrylamide (MBA) (Scheme 1). After that, tumor site was exposed to alternating magnetic field (AMF) after intratumorally injected MFO@PEG-Gels, which could generate hyperthermia and adhere to the tumor site by sol-gel phase transition due to the magnetocaloric. Then, MFO could sustained release Mn2+ and Fe3+ within the hydrogel delivery system under the action of acidic microenvironment and hydrogen peroxide. On one hand, Mn2+ blocked G1/S phase through the regulation of p27 pathway. On the other hand, Fe3+ could arrest the G2/M phase via the regulation of polo-like kinase 4 (PLK4) and inhibit autophagy to achieve enhanced cell cycle arrest and promote apoptosis of melanoma cells. This study not only laid a good theoretical foundation and experimental basis for solving melanoma treatment, but also further expanded the application of magnetocaloric bimetallic ion hydrogel.
The MFO were prepared by oleylamine reduction method. Transmission electron microscope (TEM) images showed that MFO have been successfully synthesized with an average edge length of about 50 ± 0.79 nm (Fig. 1A). It was displayed in High resolution TEM (HR-TEM) figures that an obvious light-dark lattice fringes with the distance of 0.378 nm corresponded to a diffraction in the ordered structure, which proved that the MFO with highly ordered lattice was formed (Fig. 1B and Fig. S1A in Supporting information). The selected area electron diffraction (SAED) pattern was identified to belong to (1,1,1), (2,2,0), (3,1,1), (4,0,0), (5,1,1) and (4,4,0) (Fig. 1C). Three-dimensional coordinate polyplanar structure verified the isometric system structure of the product. The result showed that the nano-cube shape was successfully prepared, which was consistent with TEM and HR-TEM. Element mapping disclosed the distribution of the Mn, Fe, and O elements in MFO (Fig. 1D).
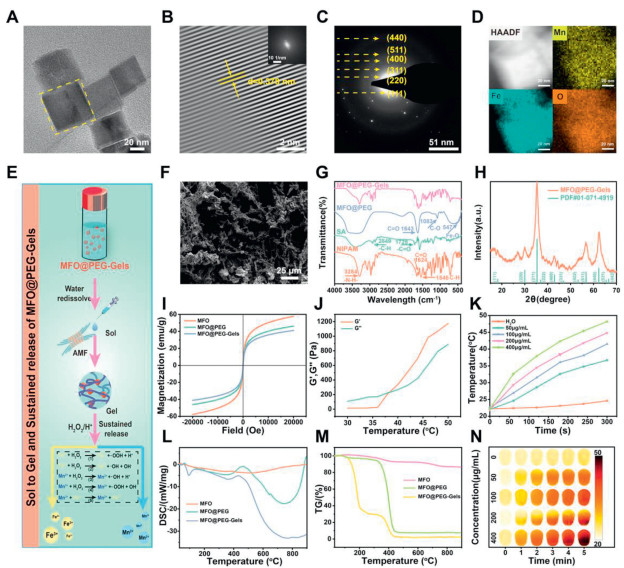
MFO were modified with PEG (MFO@PEG-Gels) to enhance the biocompatibility and hydrophilicity, which showed three-dimensional structure in TEM image (Fig. 1F). Fourier-transform infrared and ultraviolet–visible spectrophotometry (UV–vis) spectroscopy illustrated the presence of characteristic peaks of the monomers and PEG, implying successful ligand grafting to MFO (Fig. 1G and Fig. S2 in Supporting information). Besides, the crystal structures of MFO@PEG-Gels analyzed by X-ray diffraction (XRD) demonstrated that MFO@PEG-Gels exhibited a typical tetragonal crystal structure (PDF#01-071-4919) (Fig. 1H). The hydrodynamic diameter of MFO@PEG and MFO@PEG-Gels were analyzed to be 64.55 ± 0.54 nm and 112.87 ± 1.75 nm, with zeta potential of −25.70 ± 0.57 mV and −23.40 ± 0.66 mV, respectively, through dynamic light scattering (DLS) measurement (Fig. S1B). What is more, the XPS spectra confirmed the presence of Fe 2p, Mn 2p and O 1s in MFO@PEG-Gels. Specifically, MFO@PEG-Gels showed a higher percentage of Mn0 and Fe0 binding energy along with shoulder peaks of the oxidized forms (Mn2+ and Fe3+) (Figs. S1C–F in Supporting information). Therefore, it could be concluded that MFO@PEG-Gels was successfully prepared in our work.
The MFO@PEG-Gels could achieve sol-gel phase transition due to the presence of alternating magnetic field (AMF) after redissolving in water, which degraded into Mn2+ and Fe3+ under the action of acidic microenvironment and hydrogen peroxide (Fig. 1E). Firstly, the magnetic properties of MFO, MFO@PEG and MFO@PEG-Gels were characterized by measuring their magnetic hysteresis loop at 300 K, respectively. The saturation magnetization of MFO was as high as 57.69 emu/g, which was higher than the MFO@PEG (46.16 emu/g) and MFO@PEG-Gels (41.11 emu/g), implying their favorable superparamagnetic property for the biomedical applications (Fig. 1I). To determine the thermal performance, different concentrations of MFO@PEG-Gels aqueous solutions were exposed to AMF. The temperature increased from 22.3 ℃ to 48.2 ℃ (ΔTmax = 25.9 ℃) within 5 min at the concentration of 400 µg/mL. On the contrary, the pure water group did not show a significant temperature change, which represented the good thermal ability of MFO@PEG-Gels (Figs. 1K and N).
In this work, differential scanning calorimetry (DSC), thermogravimetry analysis (TG) and thermal-imaging were used to analyze the sol-gel behavior of the MFO@PEG-Gels. An endothermic peak belonging to the MFO@PEG-Gels could be observed in the DSC heating curves near 100 ℃, which revealed the thermal stability and phase transition temperature of the sample (Fig. 1L). The TG curve of MFO@PEG showed a rapid decline at near 400 ℃. In contrast, MFO@PEG-Gels displayed two rapid declines at near 200 and 400 ℃, revealing the stability of the hydrogel and the presence of the MFO@PEG ligands in the gels (Fig. 1M). Therefore, DSC and TG analysis proved the thermal stability and phase transition temperatures of different samples. Moreover, a sol-gel transition of MFO@PEG-Gels aqueous solution occurred after the immersion in the water bath, which demonstrated that it could undergo a macroscopic state transition with temperature increasing (Fig. S1I). Besides, we used rheology measurement to further evaluate the thermal sensitivity of this gel (Fig. 1J). The sol-gel transition finally turned out to start from 36 ℃ to 40 ℃ due to the storage and loss modulus (G′ and G″) curves of MFO@PEG-Gels during the heating process. These results indicated that we have successfully prepared the bio-applicable magnetocaloric bimetallic ion sustained release hydrogels.
The release profiles of Mn2+ and Fe3+ from MFO@PEG-Gels were obtained by detecting the released metal ions concentration via inductively coupled plasma-mass spectrometry (ICP-MS). In detail, metal ions release behaviors of the MFO@PEG-Gels were carried out at different pH value (pH 5.0 and 7.4) at 37 ℃. Specifically, Mn2+ and Fe3+ both exhibited a sustained release during 7 days at pH 5.0, with the total release amount of 95.08% and 93.78% from the MFO@PEG-Gels, respectively. However, less than 10% Mn2+ and Fe3+ were released in pH 7.4 phosphate buffer saline (PBS) for 7 days, which demonstrated the tumor microenvironment responsive ability of MFO@PEG-Gels (Fig. S1G, H in Supporting information).
We further examined the uptake ability and safety properties of MFO@PEG-Gels in cellular level, in order to evaluate the potential application. Firstly, in order to assess the cellular internalization profile, different concentrations of fluorescein isothiocyanate isomer I (FITC)-labeled MFO@PEG-Gels were added to melanoma cells for incubation. Compared with the control group (fresh culture medium), MFO@PEG-Gels incubated cells displayed stronger green fluorescence signals, which indicated that the cellular internalization of MFO@PEG-Gels was taken place efficiently (Fig. 2A). A significant overlap in the cellular localization between the MFO@PEG and the lysosomes was observed. Moreover, there was a corresponding enhancement in the fluorescence intensity of the lysosomes, which indicated the successful internalization of MFO@PEG into the cellular lysosomes, facilitating the subsequent therapeutic effects. The results from time-dependent uptake experiments indicated that melanoma cells were successfully internalized a greater amount of MFO@PEG-Gel within 4 h, compared to the MFO@PEG group (Fig. S3 in Supporting information). To evaluate the intracellular tumoricidal capacity of MFO@PEG-Gels, we employed cell counting kit-8 (CCK-8) assay to test the cytotoxicity in melanoma cells. Specifically, the cell viability was obeyed a concentration dependent pattern, which showed a relatively high cellular toxicity (57%) in 400 µg/mL group (Fig. 2B).
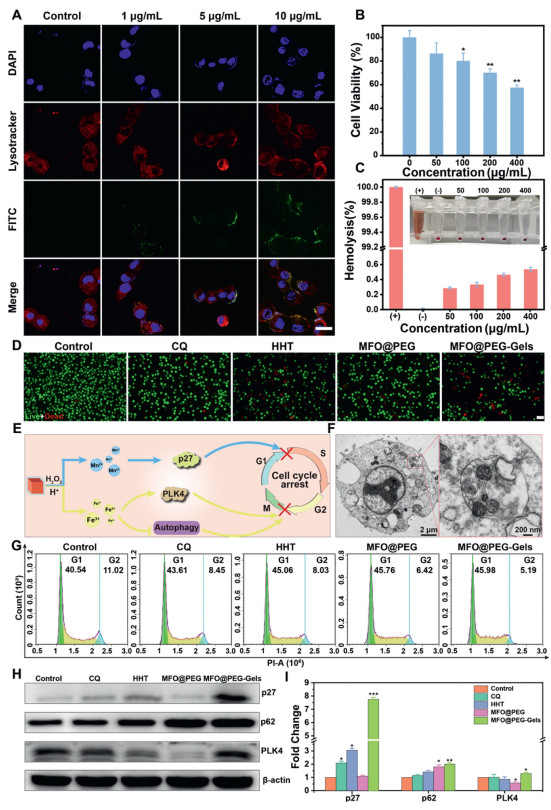
Subsequently, a further evaluation of the melanoma cell killing ability with different treatment was conducted by co-staining with calcein-AM/PI. In Fig. 2D, the dead cell markers were predominated in MFO@PEG-Gels group. On the contrary, in other groups dead cells were rarely seen, which further confirmed the high efficiency of therapeutic strategy to induce cell death.
Before in vivo applications, hemolysis assay was further conducted to evaluate the biocompatibility of MFO@PEG-Gels. Apparent hemolysis was barely observed in the hemolysis test of MFO@PEG-Gels with a concentration range (from 50 µg/mL to 400 µg/mL). Even the concentration of MFO@PEG-Gels is 400 µg/mL, the hemolysis percentage was lower than 0.6%, which was in line with the in vivo studies safety standard (Fig. 2C).
The mechanism for boosted cell cycle arrest of MFO@PEG-Gels was shown in Fig. 2E. On one hand, Mn2+ could promote the expression of p27, resulting in the G1 phase arrest. On the other hand, Fe3+ could impact the G2 phase via PLK4 regulation and autophagy inhibition, which was ascribed to the autophagy process inhibition. Hence, we observed the autophagic process by Bio-TEM. Interestingly, more irregular shape of autophagosomes were observed in MFO@PEG-Gels treatment group, which as the consequence of blockage of autophagy (Fig. 2F). We also examined the cell cycle after different treatments by flow cytometry. Compared with the control group (G1: 40.54%), an enhanced fraction of cells in the G1 phase (G1: 45.98%) could be observed in the group that treated with MFO@PEG-Gel, and similar results could also be observed in other positive groups. Moreover, the flow cytometry result shown that 11.02% of cells were in the G2 phase in the control group, while the treated cells in the G2 phase were only 5.19% in the MFO@PEG-Gels group. Therefore, owing to the combo-treatment, the cell cycle arrest efficiency of MFO@PEG-Gels could be achieved (Fig. 2G).
To confirm the occurrence of cell cycle arrest, we used western blot to evaluate the protein expression. As a typical biomarker, the expressions of p27 and p62 in MFO@PEG-Gels were evidenced to up-regulate significantly compared with other groups. Additionally, the downregulated expression of PLK4 indicated the inhibition of the G2 phase. Hard evidence was presented from these results that MFO@PEG-Gels could arrest the cell cycle, thus inducing tumor cell apoptosis (Figs. 2H and I).
In subsequent experiment, we firstly assessed the computed tomography (CT) contrast ability, which showed that the CT value of MFO@PEG-Gels increased from 2 mg/mL to 10 mg/mL (R2 = 0.9898). In the animal experiment section, all procedures were conducted in accordance with the approved protocols of the Institutional Animal Care and Use Committee at Institute of Tianjin University. The handling of animals also adhered to the relevant regulations stipulated in the Care and Use of the Animal management regulations of 2017. We could clearly see that there was none of CT signals in the control group. However, a significant enhancement of tumor contrast signal could be observed during the first 24 h. Although the CT signal was decreased since then, it could be observed even after injection of MFO@PEG-Gels for 72 h, revealing the excellent degradation and sustained release abilities of MFO@PEG-Gels (Figs. 3A and C).
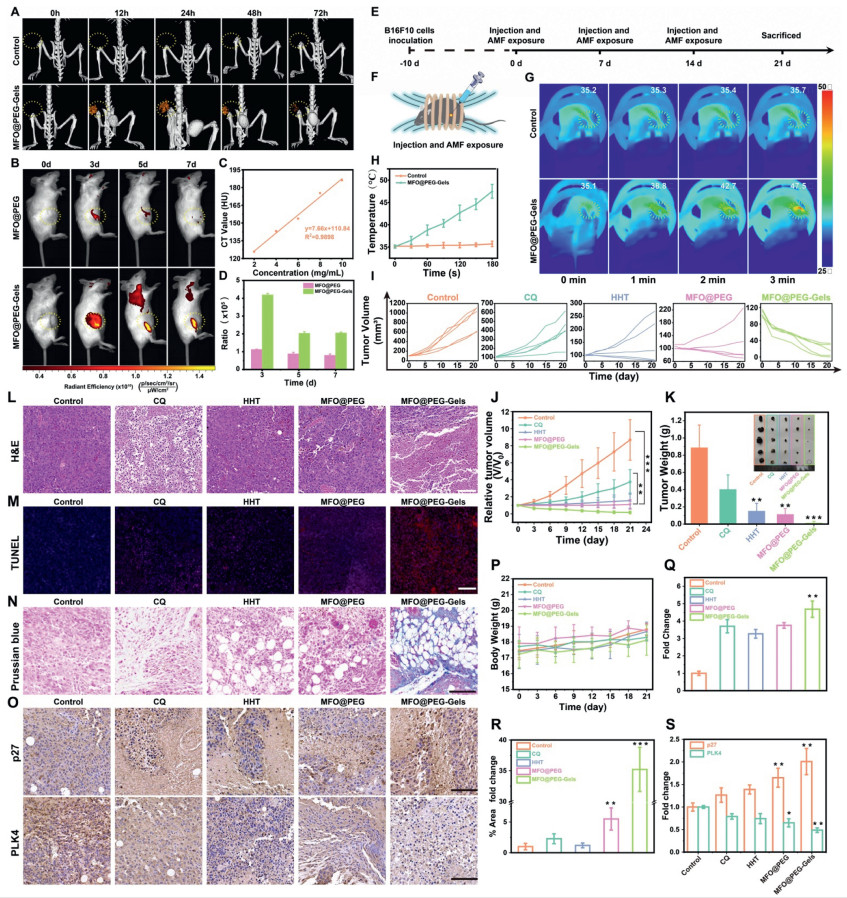
According to the previous work [41,42], we synthesized Rhodamine B (RB) modified MFO@PEG-Gels (MFO@PEG-Gels-RB). Next, it was intratumorally injected into BALB/c mice. At the injection compartment, the gel rapidly formed upon AMF within 30 s. Afterwards, we non-invasively monitored the in vivo degradation of MFO@PEG-Gels via fluorescence imaging. As shown in Figs. 3B and D, as time passed, the fluorescence intensity of MFO@PEG and MFO@PEG-Gels decreased, which indicates the in vivo gradual degradation. On day 7 post-injection, there were still visible fluorescence signal remained in tumor site in MFO@PEG-Gels treated group, suggesting the long-term retention and sustained release property.
Considering the sustained release profile of ions and enhanced cell cycle arrest of MFO@PEG-Gels in vitro, further evaluations of their anti-tumor efficacy in mice were conducted. We first fabricated B16F10 melanoma-bearing mice as the animal model (Fig. 3E). For comparison, the mice respectively received treatment with the saline, chloroquine (CQ) and homoharringtonine (HHT) and MFO@PEG and MFO@PEG-Gels by intratumor injection and then exposure to AMF (Fig. 3F). In the MFO@PEG-Gels group, the temperature could quickly increase from 35.1 ℃ to 47.5 ℃ at the tumor site within 3 min. While the ΔT in saline group was only about 0.5 ℃ (Figs. 3G and H), which demonstrated that MFO@PEG-Gels exhibited good magnetic hyperthermia ability for inducing sol to gel phase transition in vivo under AMF.
As shown, inappreciable effect on suppressing the growth of tumor had been observed in CQ and HHT treated group. However, the MFO@PEG and MFO@PEG-Gels administration significantly delayed the growth of tumors by approximately 1.10-fold and 0.16-fold compared with the initial tumor volume respectively, showing that MFO@PEG-Gels is the best therapeutic efficacy against tumor in these groups (Figs. 3I and J). At the end of treatment, we collected tumors for photographing and determining the correlated tumor weight in order. From Fig. 3K, MFO@PEG-Gels group exhibited the minimized tumor weights (about 0.016 ± 0.015 g). Moreover, the body weight of all mice had no apparent change been found, illustrating MFO@PEG-Gels' good biocompatibility (Fig. 3P).
In this study, after treating with MFO@PEG-Gels, the hematoxylin and eosin (H&E) staining images displayed that the tumor cells became sparser and the nucleuses shrank more, which indicated a higher level of tumor injury causing by MFO@PEG-Gels (Fig. 3L). In addition, there was no obvious damage observed on the H&E images of main organs (Fig. S6 in Supporting information). Moreover, the complete blood serum biochemistry assays illustrated that MFO@PEG-Gels induced slight change to the key serum biochemical indicators (Fig. S7 in Supporting information), which confirmed that MFO@PEG-Gels possessed good biocompatibility for in vivo applications. In addition, the terminal deoxynucleotidyl transferase mediated dUTP nick-end labeling (TUNEL) assay determined by red fluorescence staining revealed that more tumor cells were dead or apoptotic in MFO@PEG-Gels treatment than all the other groups (Figs. 3M and Q). Together, these results revealed that MFO@PEG-Gels had the best anti-tumor therapeutic effects.
The localization of Fe element in tumor tissues was confirmed by ex vivo Prussian blue (PB) staining images of tumor tissue extracted from the mice after treatment (Fig. 3N). We could clearly see that the control, CQ and HHT groups were barely observed blue signals. However, the tumor tissues of MFO@PEG and MFO@PEG-Gels was stained significant blue mark, which respectively exhibited 5.48-fold and 35.21-fold compared to the control group, indicative of the accumulation and sustained release of iron-based MFO@PEG-Gels within the tumor areas (Fig. 3R).
To further verify the mechanism of therapeutic effects, we conducted immunohistochemical assays of p27 and PLK4 of tumor sections. The immunohistochemical results of p27 showed that the positive rate of p27 in the MFO@PEG-Gels group was obviously enhanced compared with other groups (~2.01-fold compared with the control group), suggesting the interception of G1/S phase. We then performed immunohistochemical staining to determine the expression of PLK4 in the tumors of different treatments. Compared with the control group, the CQ group had slight effect on the blockade of PLK4, while the HHT, MFO@PEG and MFO@PEG-Gels groups significantly down-regulated the PLK4 expression, indicating the autophagy inhibition related G2/M phase blocking ability of MFO@PEG-Gels (Figs. 3O and S).
In this study, we have successfully fabricated a magnetocaloric bimetallic ion sustained release hydrogel for ion-interferential cell cycle arrest, which was used in the melanoma treatment. The synthesized MFO@PEG-Gels were able to sustainable release of Mn2+ and Fe3+ under tumor microenvironment for more than 7 days. Taken together, the ion-interferential cell cycle arrest not only blocked G1/S phase via the regulation of p27, but also arrested G2/M phase through upregulating the PLK4 expression and inhibiting autolysosome formation, thus promoting melanoma cells apoptosis. Hence, the magnetocaloric bimetallic ion sustained release hydrogel paved the way for melanoma treatment, demonstrating its potential use as a biomaterial for a variety of ions delivery.
The authors declare that they have no known competing financial interests or personal relationships that could have appeared to influence the work reported in this paper.
This work was supported by National Natural Science Foundation of China (No. 82273873), Young Elite Scientists Sponsorship Program by Tianjin (No. 0701320001), Major Special Projects (No. 0402080005), Natural Science Foundation of Tianjin (No. 21JCYBJC00660) and Young Program Natural Science Foundation of Tianjin (No. 20JCQNJC01610).
Supplementary material associated with this article can be found, in the online version, at doi:
R.D. Carvajal, J.J. Sacco, M.J. Jager, et al., Nat. Rev. Clin. Oncol. 20 (2023) 99–115. doi: 10.1038/s41571-022-00714-1
P.P. Naik, World J. Oncol. 12 (2021) 7–19. doi: 10.14740/wjon1349
M.W. Lucas, J.M. Versluis, E.A. Rozeman, C.U. Blank, Nat. Rev. Clin. Oncol. 20 (2023) 408–422. doi: 10.1038/s41571-023-00760-3
W. Guo, H. Wang, C. Li, Signal Transduct. Target. Ther. 6 (2021) 424. doi: 10.1038/s41392-021-00827-6
A.C. Huang, R. Zappasodi, Nat. Immunol. 23 (2022) 660–670. doi: 10.1038/s41590-022-01141-1
I. Kozar, C. Margue, S. Rothengatter, C. Haan, S. Kreis, Biochim. Biophys. Acta Rev. Cancer 1871 (2019) 313–322. doi: 10.1016/j.bbcan.2019.02.002
H.D. Heibel, L. Hooey, C.J. Cockerell, Am. J. Clin. Dermatol. 21 (2020) 513–524. doi: 10.1007/s40257-020-00517-z
Y. Qin, M. Huang, C. Huang, et al., Chin. Chem. Lett. 35 (2024) 109171. doi: 10.1016/j.cclet.2023.109171
M. Jing, Y. Cai, J. Shi, et al., Front. Oncol. 12 (2022) 926242. doi: 10.3389/fonc.2022.926242
G.C. Leonardi, L. Falzone, R. Salemi, et al., Int. J. Oncol. 52 (2018) 1071–1080.
Y. Chu, T. Sun, C. Jiang, Chin. Chem. Lett. 33 (2022) 4157–4168. doi: 10.1016/j.cclet.2022.02.051
T. Wang, Y. Fu, S. Sun, et al., Chin. Chem. Lett. 34 (2023) 107508. doi: 10.1016/j.cclet.2022.05.022
R. Liu, C. Luo, Z. Pang, et al., Chin. Chem. Lett. 34 (2023) 107518. doi: 10.1016/j.cclet.2022.05.032
J. Sun, J. Li, X. Li, et al., Chin. Chem. Lett. 34 (2023) 107891. doi: 10.1016/j.cclet.2022.107891
N. Kong, X. Ji, J. Wang, et al., Nano Lett. 20 (2020) 3943–3955. doi: 10.1021/acs.nanolett.0c01098
S. Hubackova, E. Davidova, S. Boukalova, et al., Cell Death Dis. 11 (2020) 110. doi: 10.1038/s41419-020-2224-7
S. Gao, W. Zhang, R. Wang, et al., ACS Nano 14 (2020) 1468–1481. doi: 10.1021/acsnano.9b05976
S.K. Anand, A. Sharma, N. Singh, P. Kakkar, DNA Repair 86 (2020) 102748. doi: 10.1016/j.dnarep.2019.102748
D.V. Ziegler, K. Huber, L. Fajas, Cancers 14 (2021) 153. doi: 10.3390/cancers14010153
M. Andrade-Tomaz, I. de Souza, C.R.R. Rocha, L.R. Gomes, Cells 9 (2020) 2140. doi: 10.3390/cells9092140
S.G. Mathiassen, D. De Zio, F. Cecconi, Front. Oncol. 7 (2017) 51.
A.R. Ferré-D'Amaré, W.C. Winkler, Met. Ions Life Sci. 9 (2011) 141–173. doi: 10.1039/9781849732512-00141
D. Haschka, A. Hoffmann, G. Weiss, Semin. Cell Dev. Biol. 115 (2021) 27–36. doi: 10.1016/j.semcdb.2020.12.005
C. Wang, R. Zhang, X. Wei, M. Lv, Z. Jiang, Adv. Immunol. 145 (2020) 187–241.
B. Feng, Y. Zhang, T. Liu, et al., Chin. Chem. Lett. 34 (2023) 108264. doi: 10.1016/j.cclet.2023.108264
F. Lüthen, U. Bulnheim, P.D. Müller, et al., Biomol. Eng. 24 (2007) 531–536. doi: 10.1016/j.bioeng.2007.08.003
Y. Song, Y. Liu, H.Y. Teo, et al., Cell. Mol. Immunol. 18 (2021) 1571–1574. doi: 10.1038/s41423-020-00524-4
L. Hou, C. Tian, Y. Yan, L. Zhang, H. Zhang, Z. Zhang, ACS Nano 14 (2020) 3927–3940. doi: 10.1021/acsnano.9b06111
J.M. Rozenberg, M. Kamynina, M. Sorokin, et al., Biomedicines 10 (2022) 1072. doi: 10.3390/biomedicines10051072
J.W.S. Jahng, R.M. Alsaadi, R. Palanivel, et al., EMBO Rep. 20 (2019) e47911. doi: 10.15252/embr.201947911
A. Hamaï, M. Mehrpour, Med. Sci. 33 (2017) 260–267. doi: 10.1051/medsci/20173303012
S. Sahni, DH. Bae, P.J. Jansson, D.R. Richardson, Pharmacol. Res. 119 (2017) 118–127. doi: 10.1016/j.phrs.2017.01.009
E. Park, S.W. Chung, Cell Death Dis. 10 (2019) 822. doi: 10.1038/s41419-019-2064-5
Z. Zhou, J. Xiao, S. Guan, et al., Carbohydr. Polym. 285 (2022) 119235. doi: 10.1016/j.carbpol.2022.119235
L. Zhou, Z. Zeng, S. Liu, et al., Adv. Funct. Mater. 32 (2022) 2207466. doi: 10.1002/adfm.202207466
Z. Zhao, Q. Li, X. Qin, et al., Adv. Funct. Mater. 32 (2022) 2200801. doi: 10.1002/adfm.202200801
Y. Zhang, S. Tian, L. Huang, et al., Nat. Commun. 13 (2022) 4553. doi: 10.1038/s41467-022-32160-z
D. Yang, Chem. Mater. 34 (2022) 1987. doi: 10.1021/acs.chemmater.2c00188
X. Yan, T. Sun, Y. Song, et al., Nano Lett. 22 (2022) 2251–2260. doi: 10.1021/acs.nanolett.1c04413
S.H. Park, R.S. Kim, W.R. Stiles, et al., Adv. Sci. 9 (2022) 2200872. doi: 10.1002/advs.202200872
B. Li, Y. Sun, J. Lu, X. Peng, J. Environ. Sci. Health B 56 (2021) 259–271. doi: 10.1080/03601234.2021.1873030
H. Rao, W. Qi, R. Su, Z. He, X. Peng, J. Mol. Liq. 316 (2020) 113889. doi: 10.1016/j.molliq.2020.113889

Scheme 1 Schematic illustrations of (A) synthesis procedure of magnetic bimetallic hydrogel and (B) ion-interferential cell cycle arrest for melanoma treatment.

Figure 1 Physicochemical characterization of MFO@PEG-Gel. (A) TEM image of MFO. (B) Lattice spacing of MFO, Inset: Fourier transform. (C) SAED pattern of MFO. (D) Element mapping of high-angle annular dark-field (HAADF), Mn, Fe and O, respectively. (E) Schematic illustration of AMF triggered sol to gel, degradation and ions sustained release. (F) SEM image of magnetic thermal response hydrogel. (G) Fourier Transform infrared spectroscopy (FT-IR) spectra of magnetic thermal response hydrogel. (H) XRD spectra of MFO@PEG-Gel. (I) Field-dependent magnetization hysteresis loop at 300 K. (J) G′/G″ measurements of the MFO@PEG-Gels aqueous dispersion. (K) Temperature increasing profiles of different concentrations of MFO@PEG-Gels under AMF. (L) DSC curve of MFO, MFO@PEG and MFO@PEG-Gels, respectively. (M) TG spectrum of MFO, MFO@PEG and MFO@PEG-Gels, respectively. (N) Infrared thermographic images of MFO@PEG-Gels with different concentrations.

Figure 2 In vitro study on the cytotoxicity and cell cycle arrest ability of MFO@PEG-Gel. (A) Internalization and subcellular uptake of the FITC-labeled MFO@PEG-Gels with different concentration after 4 h treatment. Scale bar: 25 µm. (B) Cell viability of the MFO@PEG-Gels after 24 h incubation. (C) Hemolysis of MFO@PEG-Gels after a 2 h incubation with red blood cells (RBCs) at various concentrations. Inset: Hemolysis images after centrifugation (n = 3). (D) Fluorescence microscopy images of calcein-AM/PI co-staining cells incubated with various formulations. Scale bar: 10 µm. (E) Schematic illustration of the mechanism of cell cycle arrest. (F) Bio-TEM images of tumor cells with 50 µg/mL MFO@PEG-Gels treatment for 24 h. (G) Flow cytometry of cell cycle arrest after different treatments. (H) Western blot of p27, p62 and PLK4. (I) Densitometric of different proteins ratios (n = 3). The results were presented as mean ± standard deviation (SD). P < 0.05, **P < 0.01 vs. control.

Figure 3 In vivo tumor growth inhibition ability of MFO@PEG-Gel. (A) Schematic illustration of therapeutic effect studies in vivo. (B) Schematic illustration of Injection and AMF. (C) Infrared thermographic images of melanoma bearing mice exposed to AMF after intratumor injection with saline and MFO@PEG-Gels. (D) Temperature changes of tumor site within 3 min. (E) Individual tumor growth kinetics in different groups. (F) Relative tumor volume. (G) Infrared thermographic images of melanoma bearing mice exposed to AMF after intratumor injection with saline and MFO@PEG-Gels. (H) Temperature changes of tumor site within 3 min. (I) Individual tumor growth kinetics in different groups. (J) Relative tumor volume. (K) Average tumor weights. Inset: Photographs depict various groups of tumor tissues treated with different formulations. (L) H&E stained of tumor sections treated by different formulations after 21 days. (M) TUNEL staining of paraffin embedded tumor sections on day 21. (N) Prussian Blue stained of tumor sections after different treatments on day 21. (O) p27 and PLK4 stained of tumor sections after different treatments on day 21. (P) Average body weights (n = 5). (Q) Quantification of TUNEL in tumors. (R) Quantification of prussian blue in tumors. (S) Quantification of p27 and PLK4 compared with control group (n = 3). Scale bar: 100 µm. The results were presented as mean ± SD. P < 0.05, **P < 0.01 vs. control.

 扫一扫看文章

扫一扫关注我们
 DownLoad:
 下载:
下载: