Table 1.
Crystallographic data for complexes 1~2

Syntheses, Spectroscopic Properties and THz Time Domain Spectroscopy of Two Copper(Ⅰ) Complexes Based on N-Donor and P-Donor Ligands
Xun PAN , Xiao-Nan KUANG , Ning ZHU , Zhi-Gang REN , Yu-Ping YANG , Xiu-Lan XIN , Zhong-Feng LI , Hong-Liang HAN , Qiong-Hua JIN


In recent years, luminescent metal complexes have attracted considerable attention, because of their promising potential in materials science, optical recording devices, biological systems and organic light-emitting diodes (OLEDs)[1-3]. In particular, much more attention has been paid to Cu(Ⅰ) complexes, since copper is the relatively abundant and inexpensive non-noble metal[4-6]. In this respect, Cu(Ⅰ) complexes have been investigated. The structural diversity of copper(Ⅰ) complexes ranges from mononuclear to polynuclear molecules, which makes Cu(Ⅰ) complexes show desired properties, such as efficient luminescence[7-9].
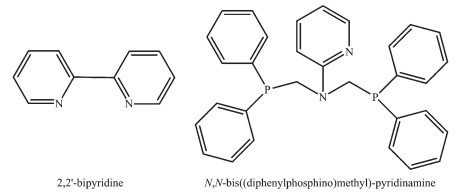
Until now, a number of mixed-ligand Cu(Ⅰ) diimine diphosphine complexes such as [Cu(N^N)(P^P)]+ system (P^P=various diphosphine) ligands) have been reported and their fluorescence properties have been extensively investigated in various solvents and different temperatures[10-11]. For a tetrahedral [Cu(N^N)(P^P)]+ system, the emission often features metal-to-ligand transfer(MLCT) character, which is associated with the peripheral ligand. So it is believed that structural modification of generally used ligands and the exploitation of the novel ligands are two efficient ways to gain fresh emissive heteroleptic Cu(Ⅰ) complexes. On this basis, N, N-bis((diphenylphos-phino)methyl)-pyridinamine (bdppmapy) was selected since its comp-lexes not only have rich structural chemistry but also have potential applications in fluorescent materials. It is well-known that copper(Ⅰ) salts are classified as a kind of soft acid. According to the hard-soft-acid-base (HSAB) theory, as P-donor ligand, the N, N-bis((diphenylphosphino)methyl)-pyri-dinamine (bdppmapy) we used in this contribution can easily coordinate with copper(Ⅰ) salts to help improve crystal quality. The diimine ligand plays a significant role in determining the luminescence properties of Cu(Ⅰ) complexes[12-13], so 2, 2′- bipyridine (2, 2′-bipy) was chosen to synthesize complexes.
In our previous studies, we have reported some complexes with the novel structures and good fluorescence properties by the reaction of similar ligands and closed-shell d10 metal[14-18]. In this paper, two novel copper(Ⅰ) complexes, namely [Cu(bdppmapy)(2, 2′-bipy)]BF4 (1) and [Cu(bdppmapy)(2, 2′-bipy)]I (2), have been synthesized and characterized by X-ray diffraction, elemental analysis, 1H NMR, 31P NMR spectroscopy, fluorescence spectra and THz time domain spectroscopy (THz-TDS). The luminescent properties of these complexes are discussed.
The ligand bdppmapy was prepared according to the literature[19-20]. Other chemical reagents are comm-ercially available and used without furthermore treatment. FT-IR spectra (KBr pellets) were measured on a Perkin-Elmer Infrared spectrometer. C, H and N elemental analysis were carried out on an Elementar Vario MICRO CUBE (Germany) elemental analyzer. Room-temperature fluorescence spectra were measured on F-4500 FL Spectrophotometer. 1H NMR was recorded at room temperature with a Bruker DPX 600 spectro-meter. The THz absorption spectra were recorded on a THz time domain device of the Capital Normal University of China, carried out in a N2 atmosphere to avoid the influence of water vapor, based on photo-conductive switches for the generation and electro-optical crystal detection of the far-infrared light, effective frequency in a range of 0.2~2.8 THz[21-22].
A mixture of [Cu(CH3CN)4]BF4 (0.062 9 g, 0.2 mmol), 2, 2′-bipy (0.031 2 g, 0.2 mmol) and bdppmapy (0.098 7 g, 0.2 mmol) were dissolved in the mixed solvents of 5 mL CH2Cl2 and 5 mL CH3OH. The mixture was stirred for 6 hours and filtered. Yellow crystals of 1 were obtained from the filtrate after standing at room temperature for several days. Yield: 71%. Element analysis Calcd. for C41H36BCuF4N4P2(%): C, 61.73; H, 4.52; N, 7.03; Found(%): C, 61.81; H, 4.54; N, 7.03. IR data (KBr pellets, cm-1): 3 429w, 3 053w, 1 595s, 1 479s, 1 436s, 1 284m, 1 230m, 1 056s, 857m, 765m, 736s, 693m, 495w, 480w. 1H NMR (600 MHz, DMSO-d6, 298 K): δ 2.47~3.31 (s, CH2 from bdppmapy), 7.06~7.80 (m, CHbenzene from bdppmapy, including solvent signals), 8.15~8.70 (m, heterocyclic hydrogen from bdppmapy and 2, 2′-bipy); 31P NMR (600 MHz, DMSO-d6, 298 K): δ -14.55 (s, phosphorus from bdppmapy).
Complex 2 was prepared in a manner similar to the described for 1, using CuI (0.037 8 g, 0.2 mmol), 2, 2′-bipy (0.031 2 g, 0.2 mmol) and bdppmapy (0.098 7 g, 0.2 mmol) as starting materials in a mixture of CH2Cl2 (5 mL) and CH3OH (5 mL). Yield: 84%. Element analysis Calcd. for C41H36CuIN4P2(%): C, 58.77; H, 4.30; N, 6.68; Found(%): C, 59.14; H, 4.35; N, 6.68. IR data (cm-1, KBr pellets): 3 421w, 3 049w, 3 014w, 1 970w, 1 593s, 1 561m, 1 473s, 1 432s, 1 310m, 1 278m, 1 231m, 1 095m, 1 068m, 998m, 864s, 770s, 748s, 695s, 495m, 418m. 1H NMR (600 MHz, DMSO-d6, 298 K): δ 2.47~3.31 (s, CH2 from bdppmapy), 7.05~7.52 (m, CHbenzene from bdppmapy, including solvent signals), 7.73~8.68 (m, heterocyclic hydrogen from bdppmapy and 2, 2′-bipy); 31P NMR (600 MHz, DMSO-d6, 298 K): δ -14.58 (s, phosphorus from bdppmapy).
Single crystals of the title complexes were mounted on a Bruker Smart 1000 CCD diffractometer equipped with a graphite-monochromated Mo Kα (λ=0.071 073 nm) radiation. Semi-empirical absorption corrections were applied using SADABS program[23]. All the stru-ctures were solved by direct methods using SHELXS program of the SHELXTL-97 package and refined with SHELXL-97[24]. Metal atom centers were located from the E-maps and other non-hydrogen atoms were located in successive difference Fourier syntheses. The final refinements were performed by full matrix least-squares methods with anisotropic thermal para-meters for non-hydrogen atoms on F2. The hydrogen atoms were generated geometrically and refined with displacement parameters riding on the concerned atoms.
Crystallographic data and experimental details for structural analysis are summarized in Table 1, and selected bond lengths and angles of complexes 1~2 are summarized in Table 2.
 下载:
导出CSV
下载:
导出CSV
| Complex | 1 | 2 |
| Formula | C41H36CuN4P2BF4 | C41H36CuIN4P2 |
| Formula weight | 797.03 | 837.12 |
| T / K | 173(1) | 98(1) |
| Crystal system | Triclinic | Monoclinic |
| Space group | P1 | P21 |
| Crystal size / mm | 0.2×0.2×0.2 | 0.2×0.2×0.2 |
| a / nm | 1.169 1(2) | 0.942 5(9) |
| b / nm | 1.233 8(2) | 1.965 8(2) |
| c / nm | 1.370 7(2) | 1.007 1(9) |
| α / (°) | 89.812(1) | |
| β / (°) | 72.689(1) | 95.695 6(9) |
| γ / (°) | 85.437(1) | |
| V / nm3 | 1.881 1(5) | 1.856 7(3) |
| Z | 2 | 2 |
| F(000) | 820 | 844 |
| Goodness-of-fit on F2 | 1.098 | 1.063 |
| Rint | 0.040 8 | 0.036 7 |
| R1 [I>2σ(I)]a | 0.052 1 | 0.026 5 |
| wR2 [I>2σ(I)]b | 0.139 0 | 0.069 5 |
| R1 (all data)a | 0.056 6 | 0.027 7 |
| wR2 (all data)b | 0.142 2 | 0.069 6 |
| a R=∑(||Fo|-|Fc||)/∑|Fo|; b wR=[∑w(|Fo|2-|Fc|2)2/∑w(Fo2)]1/2. | ||
下载:
导出CSV
| 1 | |||||
| Cu(1)-P(1) | 0.225(7) | Cu(1)-N(1) | 0.206(2) | Cu(1)-N(2) | 0.205(2) |
| Cu(1)-P(2) | 0.224(7) | ||||
| P(1)-Cu(1)-P(2) | 104.57(3) | N(2)-Cu(1)-P(1) | 110.38(7) | P(2)-Cu(1)-N(2) | 116.72(7) |
| N(1)-Cu(1)-P(1) | 115.36(7) | N(1)-Cu(1)-P(2) | 127.62(7) | N(2)-Cu(1)-N(1) | 80.14(1) |
| 2 | |||||
| Cu(1)-P(1) | 0.222(1) | Cu(1)-N(1) | 0.205(4) | Cu(1)-N(2) | 0.205(4) |
| Cu(1)-P(2) | 0.224(1) | ||||
| P(1)-Cu(1)-P(1) | 104.95(4) | N(1)-Cu(1)-P(1) | 124.93(1) | N(2)-Cu(1)-N(1) | 81.02(2) |
| N(2)-Cu(1)-P(2) | 110.58(1) | N(2)-Cu(1)-P(1) | 112.26(1) | N(1)-Cu(1)-P(2) | 120.20(1) |
CCDC: 1874582, 1; 1874583, 2.
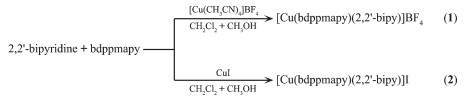
The ligand bdppmapy was prepared according to the method in literatures[19-20]. It′s known to all that the structures of complexes are affected by many factors such as ligands and solvents. In the preparation of title complexes, the ligands 2, 2′-bipy and bdppmapy influence the coordination modes of the copper ion. Functional Cu(Ⅰ) complex 1 has been synthesized by one-pot reaction using copper(Ⅰ) salts, 2, 2′-bipy and bdppmapy ligands in CH3OH and CH2Cl2 (1:1, V/V). Complex 2 was prepared in a similar manner as described for 1, except for using CuI (Scheme 2). Both complexes 1 and 2 are mononuclear structures and are stable in air that can be stored for long term. In the respect of our report, the effect of anions on the structures of the complexes 1 and 2 is minimal.
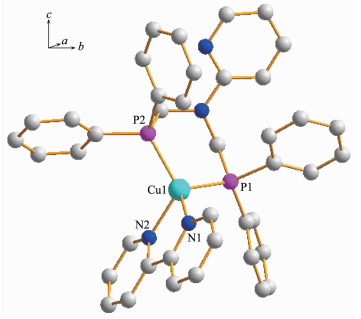
Single-crystal X-ray diffraction analysis reveals that complex 1 crystallizes in the triclinic crystal system with space group P1. The asymmetric unit (Fig. 1) is comprised of one Cu(Ⅰ) ion, one 2, 2′-bipy ligand and one bdppmapy ligand, forming a simple mononuclear heteroleptic complex. The metal ion, which adopts four-coordinated mode, is bonded to two N atoms from 2, 2′-bipy ligand and two P atoms from bdppmapy ligand to establish a distorted tetrahedral geometry around the metal. The geometry around copper(Ⅰ) center is distorted tetrahedral configuration, which is confirmed by the angles in a range of 80.14(1)°~127.62(7)°. The Cu-N bond lengths (0.206(2) nm) and Cu-P bond lengths (0.225(7) nm) are normal for the four-coordinated Cu(Ⅰ) complexes. Compared to the similar Cu-2, 2′-bipy complex, the Cu-N (0.206(2) nm) distance in complex 1 is similar to that in [Cu2(en)(2, 2′-bipy)]2+ [25].
All hydrogen atoms are omitted for clarity; Thermal ellipsoids drawn at the 30% probability level
Complex 2 crystallizes in the monoclinic crystal system with space group P21. Just like complex 1, Cu(Ⅰ) is four-coordinated surrounded by two P atoms from bdppmapy ligand and two N atoms from 2, 2′-bipy ligand. The 2, 2′-bipy acts as a typical chelate ligand to join Cu(Ⅰ), just as in the [Cu2(μ-Ph2Pbipy)2(2, 2′-bipy)](PF6)2[26]. Compared with complex 1, there are almost no obvious differences for complex 2 in bond distances (Cu-P: 0.222(1), Cu-N: 0.205(4) nm) and bond angle (range from 81.02(2)° to 124.93(1)°). The only divergence between the above two complexes is the anions which have almost no influence on the structure.
The 1H NMR spectra of complexes 1 and 2 were measured at room temperature in DMSO-d6. The 1H NMR spectrum of complex 1 exhibits signals (multiple peaks) between 7.06 and 7.80(δ), which can be assigned to protons from the aromatic rings of bdppmapy ligand (δ: 7.28, 8H, t, J=7.5 Hz; 7.37, 12H, dt, J1=13.8 Hz, J2=7.2 Hz). In complex 1, the signals in two ranges of 6.10~7.80 and 7.50~8.70 are attributed to protons from heteroaromatic rings of bdppmapy ligand (δ: 6.13, 1H, d, J=8.4 Hz; 6.52, 1H, dd, J1=6.9 Hz, J2=4.8 Hz; 7.07, 1H, m, J1=1.73 Hz, J2=1.73 Hz, J3=3.57 Hz; 7.79, 1H, dd, J1=4.8 Hz, J2=1.2 Hz) and 2, 2′-bipy ligand (δ: 7.51, 2H, dd, J1=7.2 Hz, J2=5.7 Hz; 8.16, 4H, dd, J1=13.8 Hz, J2=6.3 Hz; 8.69, 2H, d, J=8.4 Hz), respectively. As for complex 2, the signals in two ranges of 6.10~7.80 and 7.51~8.68 belong to heterocyclic hydrogen from bdppmapy (δ: 6.11, 1H, d, J=8.4 Hz; 6.50, 1H, dd, J1=6.9 Hz, J2=4.8 Hz; 7.05, 1H, m, J1=1.73 Hz, J2=1.73 Hz, J3=3.57 Hz; 7.76, 1H, dd, J1=19.8 Hz, J2=11.4 Hz) and 2, 2′-bipy (δ: 7.51, 2H, dd, J1=7.2 Hz, J2=5.7 Hz; 8.16, 4H, dd, J1=13.8 Hz, J2=6.3 Hz; 8.68, 2H, d, J=8.4 Hz), respectively. The 31P NMR spectra of complexes 1 and 2 exhibit single signals at δ -14.5 can be ascribed to phosphorus of the dipho-sphine ligands.
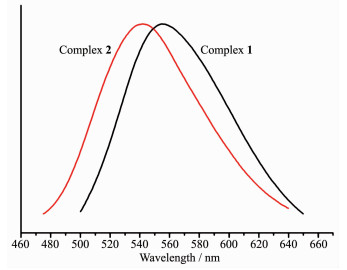
The solid-state excitation and emission spectra of complexes 1 and 2, bdppmapy and 2, 2′-bipy ligands were measured at room temperature. When being excited at 380 nm, the bdppmapy ligand displayed a fluorescence emission peak at 433 nm, and the emission peak of the 2, 2′-bipy ligand was found at 545 nm with excitation at 272 nm. Compared with bdppmapy ligand, the emission maxima of complexes 1 and 2 were largely shifted to longer wavelength, which is correlated with a visible color change in complexes 1 and 2. It was found that the emission peak was centered at 556 nm with λEx=371 nm for complex 1, and it was centered at 540 nm with λEx=370 nm for complex 2 (Fig. 2). The emission maxima of complex 1 was 16 nm longer than that of complex 2 indicating that different anions have effect on the fluorescence spectra. The luminescent spectra show that the emission mechanism is metal-to-ligand charge transfer (MLCT).
下载:
导出CSV
| λEx / nm | λEm / nm | |
| Complex 1 | 371 | 556 |
| Complex 2 | 370 | 540 |
| bdppmapy | 380 | 433 |
| 2, 2′-bipy | 272 | 545 |
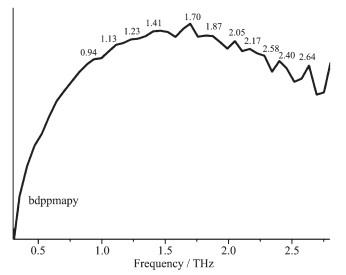
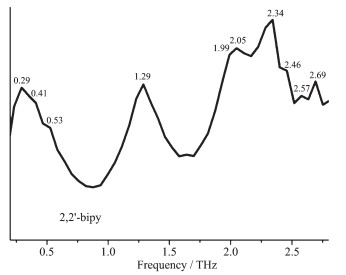
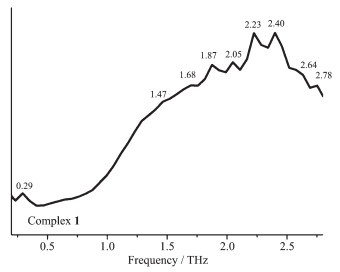
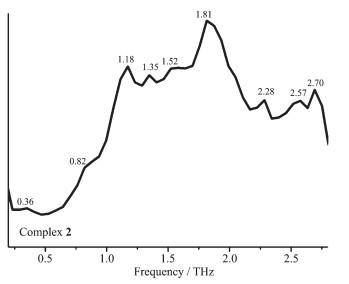
The room temperature terahertz time domain spectroscopy (THz-TDS) of [Cu(CH3CN)4]BF4, CuI, bdppmapy, 2, 2′-bipy and complexes 1 and 2 were measured in a range of 0.2~2.8 THz. All the above compounds had characteristic resonance peaks, which may be explained by the fact that in polar molecules the dipoles rotate and vibrate, resulting in strong absorption and chromatic dispersion. The peaks found for them were as follows: [Cu(CH3CN)4]BF4 0.29, 1.47, 1.70, 1.82, 2.00, 2.10, 2.23, 2.35, 2.41, 2.52, 2.75 THz; CuI 0.27, 0.38, 0.86, 1.44, 1.66, 2.01, 2.3, 2.4, 2.51, 2.64 THz; bdppmapy 0.94, 1.13, 1.23, 1.41, 1.70, 1.87, 2.05, 2.17, 2.58, 2.40, 2.64 THz (Fig. 3); 2, 2′-bipy 0.29, 0.41, 0.53, 1.29, 1.99, 2.05, 2.34, 2.46, 2.57, 2.69 THz (Fig. 4); complex 1 0.29, 1.47, 1.68, 1.87, 2.05, 2.23, 2.40, 2.64, 2.78 THz (Fig. 5); complex 2 0.36, 0.82, 1.18, 1.35, 1.52, 1.81, 2.28, 2.57, 2.70 THz (Fig. 6). By comparing the THz absorption spectra of the products with those of the reactants, we can see that most peaks of the ligands and copper(Ⅰ) ions disappeared or moved in the complexes. New peaks appear in the new complexes indicating that the THz absorption spectra are associated with the coordination of copper(Ⅰ) ions and the ligands. There are big differences in THz absorption spectra of complexes 1 and 2 because of the effect of anions. Although the correspondence between the crystal structures and observed spectra does not allow a definitive characterization, it is possible to make tentative assignments of many of the observed features in the terahertz region for the samples. The results are a supplement to the THz spectroscopic properties of Cu(Ⅰ) complexes containing nitrogen and phosphorous ligand.
Two novel Cu(Ⅰ) complexes, namely [Cu(bdppmapy)(2, 2′-bipy)]BF4 (1) and [Cu(bdppmapy)(2, 2′-bipy)]I (2), have been synthesized and characterized by single-crystal X-ray diffraction, elemental analysis, 1H NMR and 31P NMR spectroscopy, fluorescence spectra and THz time domain spectroscopy (THz-TDS). Complexes 1 and 2 are mononuclear complexes, whose emission peaks are derived from metal-to-ligand charge transfer (MLCT). All the complexes show great stability, which can be used in optical materials and luminescence research. The application of THz time domain spectroscopy (THz-TDS) provides useful information for researching the structure and luminescence of compounds.
McMillin D R, McNett K M. Chem. Rev., 1998, 98:1201-1219 doi: 10.1021/cr9601167
Xin X L, Chen M, Ai Y B, et al. Inorg. Chem., 2014, 53:2922-2931 doi: 10.1021/ic402685u
He L H, Luo Y S, Di B S, et al. Inorg. Chem., 2017, 56:10311-10324 doi: 10.1021/acs.inorgchem.7b01159
Daichi K, Michihiro N, Yasuo F, et al. Dalton Trans., 2017, 46:14804-14811 doi: 10.1039/C7DT02938A
Eunjin K, Jineun K, Kang Y L, et al. Inorg. Chem., 2017, 56:943-949 doi: 10.1021/acs.inorgchem.6b02571
Chen J L, Zeng X H, Luo Y S, et al. Dalton Trans., 2017, 46:13077-13087 doi: 10.1039/C7DT02848B
Pablo A, Cristian V, Dayra E, et al. Dalton Trans., 2017, 46:13432-13445 doi: 10.1039/C7DT02244A
Jintoku H, Ihara H, Matsuzawa Y, et al. Chem. Eur. J., 2017, 23:16961-16965 doi: 10.1002/chem.201704154
Evans O R, Lin W. Acc. Chem. Res., 2002, 35:511-522 doi: 10.1021/ar0001012
Raman N, Selvan A. J. Mol. Struct., 2011, 985:173-183 doi: 10.1016/j.molstruc.2010.10.038
Krylova V A, Djurovich P I, Whited M T, et al. Chem. Commun., 2010, 46:6696-6698 doi: 10.1039/c0cc01864c
Mara M W, Fransted K A, Chen L X, et al. Coord. Chem. Rev., 2015:2-18, 282-283
Mjos K D, Orvig C. Chem. Rev., 2014, 114:4540-4563 doi: 10.1021/cr400460s
Cui Y Z, Yuan Y, Han H L, et al. Z. Anorg. Allg. Chem., 2016, 642(18):953-959 doi: 10.1002/zaac.201600193
Huang X, Li Z F, Jin Q H, et al. Polyhedron, 2013, 65:129-135 doi: 10.1016/j.poly.2013.08.018
Zhang Y R, Cui Y Z, Jin Q H, et al. Polyhedron, 2017, 122:86-98 doi: 10.1016/j.poly.2016.10.033
张彦茹, 王梦秦, 崔洋哲, 等.无机化学学报, 2015, 31(10):2089-2094 http://www.wjhxxb.cn/wjhxxbcn/ch/reader/view_abstract.aspx?flag=1&file_no=20151024&journal_id=wjhxxbcnZHANG Yan-Ru, WANG Meng-Qin, CUI Yang-Zhe, et al. Chinese J. Inorg. Chem., 2015, 31(10):2089-2094 http://www.wjhxxb.cn/wjhxxbcn/ch/reader/view_abstract.aspx?flag=1&file_no=20151024&journal_id=wjhxxbcn
王宇, 崔洋哲, 刘敏, 等.无机化学学报, 2018, 34(2):381-386 http://www.wjhxxb.cn/wjhxxbcn/ch/reader/view_abstract.aspx?flag=1&file_no=20180223&journal_id=wjhxxbcnWANG Yu, CUI Yang-Zhe, LIU Min, et al. Chinese J. Inorg. Chem., 2018, 34(2):381-386 http://www.wjhxxb.cn/wjhxxbcn/ch/reader/view_abstract.aspx?flag=1&file_no=20180223&journal_id=wjhxxbcn
Yang J H, Wu X Y, Ren Z G, et al. Cryst. Growth Des., 2013, 13:2124-2134 doi: 10.1021/cg4002048
Zhang J F, Gan X, Fu W F, et al. Inorg. Chim. Acta, 2010, 363:338-345 doi: 10.1016/j.ica.2009.10.021
Xu S, Liu M, Yang Y P, et al. Polyhedron, 2015, 87:293-301 doi: 10.1016/j.poly.2014.11.022
Zhang L L, Zhong H, Deng C, et al. Appl. Phys. Lett., 2009, 94:211106 doi: 10.1063/1.3143613
Sheldrick G M. SHELXTL NT Ver.5.1, University of Göttingen, Germany, 1997.
Sheldrick G M. SHELXS-97 and SHELXL-97, Madison, WI, USA, 1997.
Niu J Y, Zhang S W, Chen H N, et al. Cryst. Growth Des., 2011, 11:3769-3777 doi: 10.1021/cg2001249
John S F, Raymond J H, Campbell J P, et al. Polyhedron, 1993, 12:2425-2428 doi: 10.1016/S0277-5387(00)83064-8
林森, 李跃, 崔洋哲, 等.无机化学学报, 2016, 32(12):2165-2171 http://www.wjhxxb.cn/wjhxxbcn/ch/reader/view_abstract.aspx?flag=1&file_no=20161214&journal_id=wjhxxbcnLIN Sen, LI Yue, CUI Yang-Zhe, et al. Chinese J. Inorg. Chem., 2016, 32(12):2165-2171 http://www.wjhxxb.cn/wjhxxbcn/ch/reader/view_abstract.aspx?flag=1&file_no=20161214&journal_id=wjhxxbcn

Figure 1 Molecular structure of complex 1
All hydrogen atoms are omitted for clarity; Thermal ellipsoids drawn at the 30% probability level
Table 1. Crystallographic data for complexes 1~2
| Complex | 1 | 2 |
| Formula | C41H36CuN4P2BF4 | C41H36CuIN4P2 |
| Formula weight | 797.03 | 837.12 |
| T / K | 173(1) | 98(1) |
| Crystal system | Triclinic | Monoclinic |
| Space group | P1 | P21 |
| Crystal size / mm | 0.2×0.2×0.2 | 0.2×0.2×0.2 |
| a / nm | 1.169 1(2) | 0.942 5(9) |
| b / nm | 1.233 8(2) | 1.965 8(2) |
| c / nm | 1.370 7(2) | 1.007 1(9) |
| α / (°) | 89.812(1) | |
| β / (°) | 72.689(1) | 95.695 6(9) |
| γ / (°) | 85.437(1) | |
| V / nm3 | 1.881 1(5) | 1.856 7(3) |
| Z | 2 | 2 |
| F(000) | 820 | 844 |
| Goodness-of-fit on F2 | 1.098 | 1.063 |
| Rint | 0.040 8 | 0.036 7 |
| R1 [I>2σ(I)]a | 0.052 1 | 0.026 5 |
| wR2 [I>2σ(I)]b | 0.139 0 | 0.069 5 |
| R1 (all data)a | 0.056 6 | 0.027 7 |
| wR2 (all data)b | 0.142 2 | 0.069 6 |
| a R=∑(||Fo|-|Fc||)/∑|Fo|; b wR=[∑w(|Fo|2-|Fc|2)2/∑w(Fo2)]1/2. | ||
 下载: 导出CSV
Table 2. Selected bond distances (nm) and bond angles (°) for complexes 1~2
| 1 | |||||
| Cu(1)-P(1) | 0.225(7) | Cu(1)-N(1) | 0.206(2) | Cu(1)-N(2) | 0.205(2) |
| Cu(1)-P(2) | 0.224(7) | ||||
| P(1)-Cu(1)-P(2) | 104.57(3) | N(2)-Cu(1)-P(1) | 110.38(7) | P(2)-Cu(1)-N(2) | 116.72(7) |
| N(1)-Cu(1)-P(1) | 115.36(7) | N(1)-Cu(1)-P(2) | 127.62(7) | N(2)-Cu(1)-N(1) | 80.14(1) |
| 2 | |||||
| Cu(1)-P(1) | 0.222(1) | Cu(1)-N(1) | 0.205(4) | Cu(1)-N(2) | 0.205(4) |
| Cu(1)-P(2) | 0.224(1) | ||||
| P(1)-Cu(1)-P(1) | 104.95(4) | N(1)-Cu(1)-P(1) | 124.93(1) | N(2)-Cu(1)-N(1) | 81.02(2) |
| N(2)-Cu(1)-P(2) | 110.58(1) | N(2)-Cu(1)-P(1) | 112.26(1) | N(1)-Cu(1)-P(2) | 120.20(1) |
下载: 导出CSV
Table 3. Fluorescent data of complexes 1 and 2 and the ligands
| λEx / nm | λEm / nm | |
| Complex 1 | 371 | 556 |
| Complex 2 | 370 | 540 |
| bdppmapy | 380 | 433 |
| 2, 2′-bipy | 272 | 545 |
下载: 导出CSV

 扫一扫看文章


扫一扫关注我们