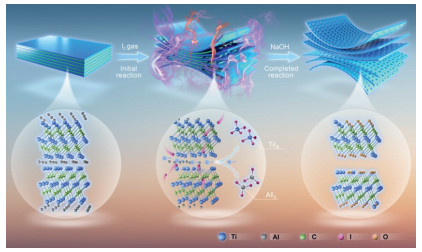
Scheme 1.
Synthesis mechanism diagram of CNS.
Defect-rich and highly porous carbon nanosheets derived from Ti3AlC2 MAX with good lithium storage properties
Zhihao Zhu , Peng Liu , Yucheng Liu , Xingxing Gu , Zhi Su , Zhong Su , Chao Lai

Since graphene was born in 2004, two-dimensional (2D) materials have received widespread and enthusiastic attention in frontiers including quantum electrodynamics, condensed matter physics, energy storage and conversion, as well as materials science, chemical science, environmental science, etc. [1-3]. In addition to graphene, other 2D materials, i.e., black phosphorus, transition metal dichalcogenides, hexagonal boron nitride, metal carbides (MXenes), porous carbon nanosheets (CNS), due to structural anisotropy and surface characteristics, demonstrates promising mechanical, chemical, and electric merits [1, 4].
Among these 2D materials, porous CNS, owing to large specific surface area, abundant porous structure, excellent electrical conductivity, chemical inertness and low-cost, have been widely used in the areas of catalysis [5-8], water/gas purification [9-11], energy conversion/storage [12-15], detection and sensor [16, 17], etc. There are two common approaches for the synthesis of CNS: hard-template and self-template methods [4, 18]. Generally, the hard-template method can precisely control the shape and size of CNS, but high yield and high pore volume are not so easy to achieve [2, 19].
Recently the carbide-derived carbon (CDC) materials have received much attention as they are promising candidates for producing porous carbon with controllable shape and tunable pore size [20]. For example, Alar et al. reported micro- and mesoporous CDC synthesis from molybdenum carbide powder by gas phase chlorination in the temperature range from 400 ℃ to 1200 ℃ [21], which the pore size could be adjusted by the temperature and the highest surface area and pore volume could reach 1855 m2/g and 1.399 cm3/g. Yury's group utilized electrochemically selectively extracting the metal atoms from the layered carbides at ambient temperature, and a predominantly amorphous CDCs with a narrow distribution of micro-pores has been obtained [22]. Recently, Pang et al. used SiC/PDA as anode, carbon rod as cathode in molten CaCl2-NaCl system at the condition of 800 ℃ and 3 V electrolytic voltage [23], successfully prepared the nitrogen doped CDC with the surface area of 1191 m2/g. According to the previous reports, there are not few references that reported porous CDC synthesis [20-27]. However, utilized the carbide to synthesize porous 2D CNS with high defects is rarely reported [28, 29].
Thus, in this work, we propose a facile, novel, and high yield strategy to prepare porous CNS with high defects and high specific surface area, which the Ti3AlC2, a kind of carbides, was employed as the template and halogen as well as base were employed as the etch agents. As shown in Scheme 1, the I2 is used as the initial etch agent to react with Al and Ti atoms in the Ti3AlC2 and open the lamellar spacing of Ti3AlC2. Then the OH− ions could easily enter the layer spacing to further etch Ti and Al atoms completely, thus, the defective and porous CNS can be obtained, and this defective and porous CNS demonstrates excellent desperation in aqueous solution (Fig. S1 in Supporting information). After immersing in aqueous solution for 7 days, the CNS prepared by I2/NaOH etchant still dispersed in the solution homogenously (Fig. S1a). And the crystal structure of CNS materials in aqueous solution was demonstrated in Fig. S1b, the characteristic diffraction peaks of CNS materials prepared by I2/NaOH etchant did not change after resting in aqueous solution for 7 days, which also indicated that the CNS demonstrates excellent desperation in the aqueous solution. More importantly, such porous and defective CNS materials as the lithium-ion batteries' anodes illustrate excellent electrochemical performances.
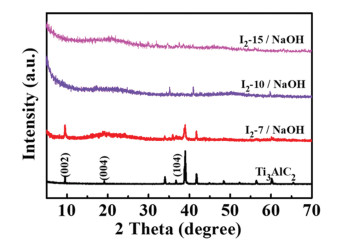
In order to further explore the new material's crystallinity, composition, surface/internal morphology, a series of characterization results were demonstrated and analyzed. First, XRD was used to characterize the crystal structure of the samples etched with different etching agents. As shown in Fig. S2a (Supporting information), if the Ti3AlC2 is only etched by NaOH, the resultant CNS-NaOH sample shows exactly the same characteristic diffraction peaks as Ti3AlC2, and even the intensity of the peak changed weakly, which indicates that the CNS sample derived from Ti3AlC2 cannot be obtained by only using NaOH as etching agent due to the "jamming effect" [30]. Fig. S2b (Supporting information) illustrates the XRD spectra of the samples using the I2 as the etching agent. As can be seen, the obtained CNS-I2 samples still exhibit the characteristic diffraction peaks of Ti3AlC2, but the intensity of peaks gradually decreased with the increase of I2 dosage, indicating that Ti3AlC2 can be etched to a certain extent only using I2 as the etching agent, but the efficiency is average, and the CNS sample still cannot be obtained. While as shown in Fig. 1, it can be observed that Ti3AlC2 can be effectively etched with I2 and NaOH, especially when the dosage of I2 reaches 10 g or more, the Ti and Al in Ti3AlC2 are almost completely etched, thus forming amorphous CNS samples.
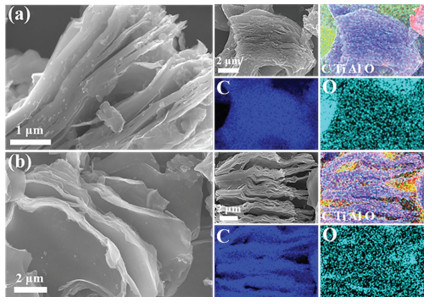
Then the morphology and surface composition of the etched samples were characterized by SEM and EDS. Initially, the Ti3AlC2 is a block structure with very high Ti (48.67%) and Al (14.42%) contents (Fig. S3 in Supporting information). After etching by NaOH, the morphology as well as Ti and Al contents (47.24% and 15.50%), are all almost unchanged (Fig. S4 in Supporting information), again proving that Ti3AlC2 cannot be etched by NaOH alone. As shown in Fig. S5 (Supporting information), it can be observed that the Ti3AlC2 was etched by I2, which illustrates lamellar structure. The lamellar structure became more obvious with the increase of I2 dosage. EDS spectra in Fig. S5 show that I2, as an individual etching agent, mainly etches Al atoms in Ti3AlC2, and also etches part of Ti atoms with the increase of the dosage of I2. This enlarged open edge window effectively prevents the "jamming effect" and allows the OH− etching reaction to continue. As shown in Fig. 2, the CNS-I2–10/NaOH and CNS-I2–15/NaOH samples demonstrate more obvious sheets structure compared with the samples of CNS-I2–10 and CNS-I2–15. And it can be observed from element content in Table S1 (Supporting information) that Ti and Al elements are almost completely removed, especially in CNS-I2–15/NaOH sample, the content of Ti and Al are only 0.66% and 0.22%, respectively, which may even come from the interference of instrument measurement noise. Accordingly, the SEM and EDS characterizations also suggest that only I2 and NaOH as the co-etching agents, the high-quality CNS samples can be obtained.
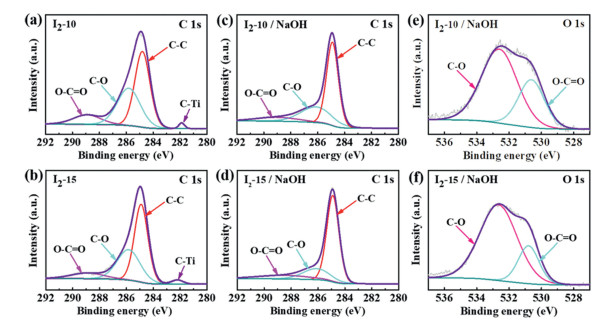
Next, the XPS characterization has been conducted in order to investigate the compositions for CNS-I2 and CNS-I2/NaOH samples. It can be clearly observed the Ti and Al elements existence as well in the full spectra of CNS-I2 samples (Fig. S6 in Supporting information), agreeing with the results of the EDS spectra in Fig. S5, while Ti and Al elements could not be observed in the XPS spectra of CNS-I2/NaOH samples, which mainly because the extreme low contents of Ti and Al elements as shown in Table S1 that could not be detected by the XPS characterization in the CNS-I2/NaOH samples. In addition, as shown in Fig. 3, in the high resolution XPS spectra of C 1s, it can be observed that the peak at 281.8 eV corresponds to Ti-C bond [31], for the samples of CNS-I2–10 and CNS-I2–15, but it cannot be observed this bond in CNS-I2–10/NaOH and CNS-I2–15/NaOH samples, which also confirms that only the synergy of I2 and NaOH, can completely etch the Ti3AlC2 to produce CNS. And from the C 1s high resolution spectra, it can be observed the peaks at around 285.7 eV and 288.9 eV, belonging to C–O and O-C=O bond [23, 32], which may form during the washing process [33], and this result is consistent with the O 1s spectra in Figs. 3e and f.
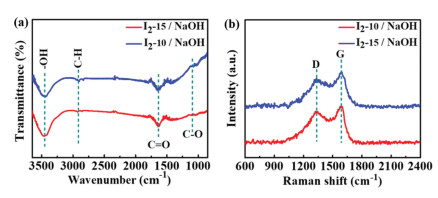
The above characterization has fully demonstrated that the CNS was produced by the combined action of I2 and NaOH. Therefore, further structural characterizations of CNS-I2–10/NaOH and CNS-I2–15/NaOH samples were carried out subsequently, including FT-IR, Raman, TEM, AFM and N2 adsorption. First, the FT-IR spectra (Fig. 4a) of CNS-I2–10/NaOH and CNS-I2–15/NaOH sample show the stretching vibration of -OH (~3452 cm−1) [34], the stretching vibration of carbonyl (C=O) (~1625 cm−1) and the stretching vibration of C-O group (~1095 cm−1) [32, 35], indicating the surface of CNS with -OH, -C=O, and -C-O terminal oxygen-containing functional groups, which is consistent with the previous XPS characterization in Figs. 3c and d. The Raman spectra of the CNS-I2/NaOH samples in Fig. 4b show two fingerprint peaks at 1340 cm−1 and 1592 cm−1 that correspond to a disorder-induced D band and an in-plane vibrational G band [36, 37], respectively. The intensity ratio of D band to G band values (ID/IG) of CNS-I2–10/NaOH and CNS-I2–15/NaOH are 0.96 and 0.92, respectively, indicating highly disordered state of these two CNS samples [36, 37], which also agrees well with the XRD spectra in Fig. 1 that diffraction peaks of (002) and (100) facets belonging to graphitized carbon are almost completely unobservable. And the following TEM characterization further indicates this conclusion.
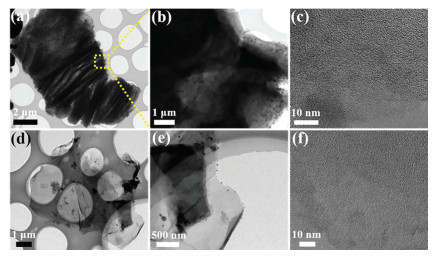
As shown in Fig. 5, both the CNS-I2–10/NaOH and CNS-I2–15/NaOH demonstrate a typical 2D nanostructure with no obvious lattice spacing. But it should be noted that the CNS-I2–15/NaOH exhibit more obviously nanosheets structure (Figs. 5d and e) compared to CNS-I2–10/NaOH (Figs. 5a and b), indicating that the increase of etched degree helps to peel aggregated layered nanosheets into single lamellar nanosheets during ultrasonication process. The AFM characterization in Fig. S6 also suggests the sheets structures of CNS-I2–10/NaOH and CNS-I2–15/NaOH. The average thickness of CNS-I2–15/NaOH is only 0.64 nm, thinner than that of CNS-I2–10/NaOH (1.31 nm), confirmed the conclusion that etching completely contributes to thinner CNS. And the absence of carbon lattice fringes in Figs. 5c and f again indicate the amorphous structure of these two CNS samples, consistent with the XRD and Raman results. Therefore, the CNS samples originated from Ti3AlC2 with the help of I2 and NaOH are highly defective.
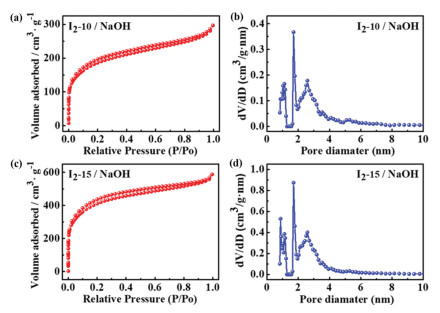
Finally, the N2 adsorption/desorption was conducted to prove the highly porous structure of CNS-I2–10/NaOH and CNS-I2–15/NaOH. As shown in Figs. 6a and c, both the adsorption curves present an obvious vertical linear area at low pressure, and an obvious hysteresis curve at middle and high pressure, which belongs to the mixed adsorption curves of type I and type IV, indicating the existence of micropores and mesopores. And the corresponding pore size distributions in Figs. 6b and d also confirm the CNS-I2–10/NaOH and CNS-I2–15/NaOH samples with abundant micropores and mesopores. However, the specific surface area and pore volume of CNS-I2–10/NaOH are only 682.2 m2/g and 0.41 cm3/g, respectively, lower than that of CNS-I2–15/NaOH (1134.4 m2/g and 0.80 cm3/g). While the BET of the samples etched with NaOH is only 6.53 m2/g, accompanied by lower pore volume of 0.008 cm3/g (Fig. S7 in Supporting information). Thus, the increase of the amount of I2 etch agent is beneficial to produce more pores and larger specific surface area. The larger specific surface area is also due to the thinner, more dispersed nanosheet structure of CNS-I2–15/NaOH, which has been demonstrated by TEM and AFM characterization in Fig. 5 and Fig. S8 (Supporting information).
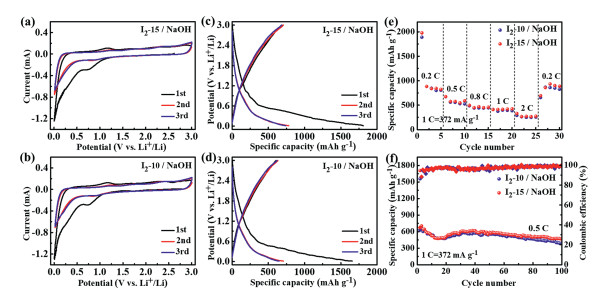
As is well known that the highly porous and defective carbon nanomaterials are good energy storage materials [38-40]. Accordingly, the lithium storage performances of the synthesized 2D CNS are investigated. As shown in Figs. 7a and b, the CV curve of the first cycle for CNS-I2–15/NaOH and CNS-I2–10/NaOH is obviously different from those of the subsequent cycles, in which a broad peak is observed at ~0.75 V during the cathodic process but disappears during the following cycles. This is mainly because of the irreversible SEI layer formation [38]. And such irreversible SEI layer formation will lead to much higher initial discharge capacity than that of the second and subsequent cycles as shown in the charge/discharge profiles (Figs. 7c and d). However, the CV curves overlap nearly from the 2nd and 3rd cycles, suggesting that as-obtained materials possess high electrochemical reversibility and stable structure [39]. Furthermore, the rate capabilities and cycling stable abilities of CNS-I2–15/NaOH and CNS-I2–10/NaOH are demonstrated in Figs. 7e and f. Both CNS-I2–15/NaOH and CNS-I2–10/NaOH anodes show good rate capabilities, i.e., high capacities of 330.2 and 290.3 mAh/g could obtain, respectively, at 2 C charge/discharge current density. And CNS-I2–15/NaOH anode shows a little better rate capabilities than that of CNS-I2–10/NaOH anode. Similarly, as shown in Fig. 7f, the CNS-I2–15/NaOH anode illustrates better cycling stabilities (472 mAh/g after 100 cycles) than that (384.8 mAh/g after 100 cycles) of CNS-I2–10/NaOH anode. The better electrochemical performances for CNS-I2–15/NaOH could be attributed to its higher specific surface areas and more defects.
In summary, we successfully synthesized a new type of ultrathin CNS with an abundant porous structure and high defects by etching Ti3AlC2 with employing the I2 and NaOH as the co-etching agent. Interestingly, high-quality CNS could not be obtained from etching Ti3AlC2 via using I2 or NaOH alone. Additionally, when I2 and NaOH are used as co-etching agents, the thickness of CNS will be reduced and specific area and pore volume will be increased with the increasing dosage of I2. The highest specific surface area and pore volume of the synthesized 2D CNS can be achieved 1134.4 m2/g and 0.80 cm3/g. What is more, the resulted CNS-I2–15/NaOH and CNS-I2–10/NaOH anodes show excellent lithium storage performances, i.e., CNS-I2–15/NaOH illustrates a high initial specific capacity of 1808.5 mAh/g and a high reversible capacity of 472 mAh/g. In a word, such 2D CNS with high specific surface area, high pore volume and rich defects will have a promising application in the field of energy storage and conversion.
The authors declare no competing financial interests.
This work is financially supported by the National Natural Science Foundation of China (No. 51902036), Natural Science Foundation of Chongqing Science & Technology Commission (No. cstc2019jcyj-msxm1407), Natural Science Foundation of Jiangsu Province (No. BK20200047), Natural Science Foundation of Chongqing Technology and Business University (No. 1952009), the Science and Technology Research Program of Chongqing Education Commission (Nos. KJQN201900826 and KJQN201800808), the Venture & Innovation Support Program for Chongqing Overseas Returnees (Nos. CX2021046 and CX2018129) and the Innovation Group of New Technologies for Industrial Pollution Control of Chongqing Education Commission (No. CXQT19023).
Supplementary material associated with this article can be found, in the online version, at
W. Lei, Y.P. Deng, G. Li, et al., ACS Catal. 8 (2018) 2464–2472. doi: 10.1021/acscatal.7b02739
Y. He, X. Zhuang, C. Lei, et al., Nano Today 24 (2019) 103–119. doi: 10.3390/microorganisms7040103
H. He, Q. Xia, B. Wang, et al., Chin. Chem. Lett. 31 (2020) 984–987. doi: 10.1016/j.cclet.2019.08.025
K. Zhao, S. Liu, G. Ye, et al., J. Mater. Chem. A 6 (2018) 2166–2175. doi: 10.1039/C7TA06916B
H. Jiang, J. Gu, X. Zheng, et al., Energy Environ. Sci. 12 (2019) 322–333. doi: 10.1039/c8ee03276a
X. Huang, Y. Zhang, H. Shen, et al., ACS Energy Lett. 3 (2018) 2914–2920. doi: 10.1021/acsenergylett.8b01717
J. Sun, W. Kong, Z. Jin, et al., Chin. Chem. Lett. 31 (2020) 953–960. doi: 10.1016/j.cclet.2020.01.035
Z. Su, H. Ling, M. Li, et al., Carbon Energy 2 (2020) 265–275. doi: 10.1002/cey2.40
J. Wang, C. Ke, X. Jia, et al., Appl. Catal. B 283 (2021) 119650. doi: 10.1016/j.apcatb.2020.119650
S. Kim, H. Wang, Y.M. Lee, Angew. Chem. Int. Ed. 58 (2019) 17512–17527. doi: 10.1002/anie.201814349
Z. Yu, X. Wang, Y.N. Hou, et al., Carbon 117 (2017) 376–382. doi: 10.1016/j.carbon.2017.02.100
Q. Jin, W. Li, K. Wang, et al., Adv. Funct. Mater. 30 (2020) 1909907. doi: 10.1002/adfm.201909907
S. Rehman, X. Gu, K. Khan, et al., Adv. Energy Mater. 6 (2016) 1502518. doi: 10.1002/aenm.201502518
J. Chen, B. Yang, H. Hou, et al., Adv. Energy Mater. 9 (2019) 1803894. doi: 10.1002/aenm.201803894
X. Chang, X. Zhou, X. Ou, et al., Adv. Energy Mater. 9 (2019) 1902672. doi: 10.1002/aenm.201902672
S. Bao, J. Gao, T. Xu, et al., Chem. Eng. J. 411 (2021) 128470. doi: 10.1016/j.cej.2021.128470
Y. Wang, C. Yin, Q. Zhuang, J. Alloys Compd. 827 (2020) 154335. doi: 10.1016/j.jallcom.2020.154335
N. Zhao, Y. Hu, J. Du, et al., Appl. Surf. Sci. 530 (2020) 147247. doi: 10.1016/j.apsusc.2020.147247
H. Fan, W. Shen, ChemSusChem. 8 (2015) 2004–2027. doi: 10.1002/cssc.201500141
M. Kormann, H. Ghanem, H. Gerhard, N. Popovska, J. Eur. Ceram. Soc. 28 (2008) 1297–1303. doi: 10.1016/j.jeurceramsoc.2007.07.018
A. Jänes, T. Thomberg, H. Kurig, E. Lust, Carbon 47 (2009) 23–29. doi: 10.1016/j.carbon.2008.07.010
M.R. Lukatskaya, J. Halim, B. Dyatkin, et al., Angew. Chem. Int. Ed. 53 (2014) 4877–4880. doi: 10.1002/anie.201402513
Z. Pang, G. Li, X. Zou, et al., J. Energy Chem. 56 (2021) 512–521. doi: 10.1016/j.jechem.2020.08.042
Z. Pang, X. Zou, X. Xiong, et al., ACS Sustainable Chem. Eng. 7 (2019) 12938–12947. doi: 10.1021/acssuschemeng.9b01944
Y. Zhu, A. Zhou, J. Jia, et al., Nano 11 (2016) 35–42.
V. Presser, M. Heon, Y. Gogotsi, Adv. Funct. Mater. 21 (2011) 810–833. doi: 10.1002/adfm.201002094
Y. Gogotsi, A. Nikitin, H. Ye, et al., Nat. Mater. 2 (2003) 591–594. doi: 10.1038/nmat957
A. Heidarpour, H. Aghamohammadi, S. Ghasemi, Synth. Met. 267 (2020) 116478. doi: 10.1016/j.synthmet.2020.116478
Z. Su, J. Liu, M. Li, et al., Electrochem. Energ. Rev. 3 (2020) 286–343. doi: 10.1007/s41918-020-00064-5
T. Li, L. Yao, Q. Liu, et al., Angew. Chem. Int. Ed. 57 (2018) 6115–6119. doi: 10.1002/anie.201800887
A. Jawaid, A. Hassan, G. Neher, et al., ACS Nano 15 (2021) 2771–2777. doi: 10.1021/acsnano.0c08630
Q. Wang, H. Pang, Y. Dong, Y. Chi, F. Fu, Microchim. Acta 185 (2018) 291. doi: 10.1109/tcsii.2017.2689246
Y. Li, H. Shao, Z. Lin, et al., Nat. Mater. 19 (2020) 894–899. doi: 10.1038/s41563-020-0657-0
Y. Song, K. Cao, W. Li, et al., Microchem. J. 155 (2020) 104694. doi: 10.1016/j.microc.2020.104694
S. Ren, J.L. Xu, L. Cheng, X. Gao, S.D. Wang, ACS Appl. Mater. Interfaces 13 (2021) 35878–35888. doi: 10.1021/acsami.1c06161
X. Gu, C.J. Tong, C. Lai, et al., J. Mater. Chem. A 3 (2015) 16670–16678. doi: 10.1039/C5TA04255K
Y. Jiang, Y. Yang, R. Xu, et al., ACS Nano 15 (2021) 10217–10227. doi: 10.1021/acsnano.1c02275
C. Ma, C. Deng, X.Z. Liao, et al., ACS Appl. Mater. Inter. 10 (2018) 36969–36975. doi: 10.1021/acsami.8b12302
H. Wang, C. Wang, B. Dang, et al., ChemElectroChem 5 (2018) 2367–2375. doi: 10.1002/celc.201800444
D. Zhang, G. Wang, L. Xu, et al., Appl. Surf. Sci. 451 (2018) 298–305. doi: 10.1016/j.apsusc.2018.04.251

Figure 2 SEM image and the corresponding element mapping images of (a) CNS-I2–10/NaOH and (b) CNS-I2–15/NaOH.

Figure 3 High resolution XPS spectra of C 1s and O 1s for the samples of (a) CNS-I2–10, (b) CNS-I2–15, (c) CNS-I2–10/NaOH, (d) CNS-I2–15/NaOH, (e) CNS-I2–10/NaOH and (f) CNS-I2–15/NaOH.

Figure 4 (a) FT-IR and (b) Raman spectra of the CNS-I2–10/NaOH and CNS-I2–15/NaOH samples.

Figure 6 N2 isotherm plots and pore size distributions of (a, b) CNS-I2–10/NaOH and (c, d) CNS-I2–15/NaOH.

Figure 7 The CV curves of the first 3 cycles for (a) CNS-I2–15/NaOH and (b) CNS-I2–10/NaOH anodes at 0.1 mV/s, the charge/discharge curves of (c) CNS-I2–15/NaOH and (d) CNS-I2–10/NaOH anodes, the (e) rate performances and (f) cycling performances for CNS-I2–15/NaOH and CNS-I2–10/NaOH anodes.

 扫一扫看文章

扫一扫关注我们
 DownLoad:

 下载:
下载:

