School of Material Science and Engineering, Shaanxi Key Laboratory of Green Preparation and Functionalization for Inorganic Materials, Shaanxi University of Science and Technology, Xi’an 710021, China
b.
Xi’an Key Laboratory of Advanced Photo-electronics Materials and Energy Conversion Device, Xijing University, Xi’an 710123, China
Received Date:
24 June 2025 Accepted Date:
30 July 2025 Revised Date:
19 July 2025 Available Online:
15 December 2025
Abstract:
Layered sodium cobaltate (NaxCoO2), characterized by CoO2 slabs and intralayer edge-shared CoO6 octahedra, holds promising potential as an electrocatalyst for chlorine evolution reaction (CER). However, the suboptimal adsorption of the intermediate on NaxCoO2 resulted in unsatisfactory activity. Herein, NaxCoO2 flakes with varying sodium densities (x = 0.6, 0.7, 0.9) were engineered for efficient CER. Excitingly, the optimal Na0.7CoO2 achieves an ultralow overpotential (55.47 mV) outperforming commercial RuO2 at 10 mA/cm2, while remaining inactive toward the competing OER. Experimental and theoretical calculations demonstrate that appropriate interlayer sodium density has optimized the d-band center level of Co atoms in NaxCoO2, thereby weakening the strength of Co-Cl bonds. This modulation facilitates the adsorption-desorption equilibrium of Cl species (∆GCl* = -0.109 eV) on the surface and kinetically accelerating Cl2 release. This work is anticipated to elucidate the mechanism by which interlayer sodium density modifies the catalytic performance of NaxCoO2, and present new insights for the rational design of advanced CER electrocatalysts.
Hydrogen is not only a carbon-free renewable fuel, but also a crucial raw material for the chemical industry [1–3]. However, current hydrogen production is primarily driven by non-renewable energy sources [4,5]. The electrocatalytic splitting of water holds a fossil-free pathway for hydrogen production, which couples the cathodic hydrogen evolution reaction (HER) and anodic oxygen evolution reaction (OER) [6–8]. Compared to HER, the kinetically sluggish OER serves as the rate-determining step in the overall water electrolysis [9–11]. Although substantial progress has been made in developing high-efficient electrocatalysts for OER overpotential reduction [12–15], the fundamental kinetic barriers persist. This makes the exploration of alternative kinetically advantaged electrocatalytic oxidation reactions a particularly compelling strategy.
The chlorine evolution reaction (CER) holds promise as an alternative to the OER, owing to its fast two-electron transfer kinetics and high-value chlorine gas (Cl2) production [16]. The CER is well-known to proceed through the Volmer-Heyrovský, Volmer-Krishtalik or Volmer-Tafel routes, involving chlorine (Cl) or chlorine-based intermediates (OCl) adsorbed on surface oxygen species [17]. Although RuO2 and IrO2 serve as the primary components of commercial CER electrodes, their scarcity and pronounced activity toward the competing OER fundamentally constrain the sustainable deployment for high-selectivity chlorine production [18–20]. Hence, the innovative development of non-precious metal catalysts featuring both suppressed OER activity and optimal Cl intermediate adsorption/desorption properties has emerged as the paramount objective in contemporary CER research.
In recent years, extensive theoretical calculations and experimental efforts have yielded unprecedented opportunities for developing efficient non-precious CER catalysts [21–24]. In particular, cobalt-based spinel oxides has been verified to be highly attractive electrocatalysts for the CER owing to their tunable physicochemical properties and catalytic performance [25]. It is well known that two types of geometric cobalt sites with different oxidation states exist in cobalt-based spinel oxides: Co2+ in tetrahedral sites (CoTd) and Co3+ in octahedral sites (Cooh). Among them, the CoTd site is identified as the locus for active cobalt oxyhydroxide (CoOOH) species formation during water oxidation, whereas the Cooh site demonstrates greater affinity and stronger interaction with chlorine species. As a result, the Cooh site is generally considered to be the optimal geometric site for CER in cobalt-based spinel oxides [26]. Sodium cobaltate (NaxCoO2) consists of alternating stacked layers of CoO2 and Na+ ions, where the CoO2 layers are composed of edge-sharing CoO6 octahedra [27,28]. This distinctive structural features endow the NaxCoO2 with abundant Cooh sites on the surface. The Na+ intercalation between layers substantially enhances the electrochemical stability [29]. But the intrinsic activity of NaCoO2 still struggles to keep pace with that of noble metal CER catalysts. Notably, the tunable sodium density (x) in the intercalation layers can directly modulate the electronic structure of surface Cooh sites, thereby contributing to enhanced electrochemical activity of NaxCoO2. However, this critical aspect remains largely unexplored to date.
Herein, NaxCoO2 flakes with varying sodium densities (x = 0.6, 0.7, 0.9) were engineered as a platform for mechanistic studies and performance assessment of CER. It is revealed that the alteration of interlayer sodium density can adjust the d-band center level of surface Co atoms, thereby weakening the strength of Co-Cl bonds. This alteration optimizes interactions with catalytic intermediates, thereby enhancing CER activity. As a result, the NaxCoO2, particularly Na0.7CoO2, requires only 55.47 mV to achieve 10 mA/cm2, significantly outperforming the benchmark RuO2. Beyond its superior activity, Na0.7CoO2 confronts a substantial energy barrier (∆Gmax) of 1.95 eV during the OER process, guaranteeing exceptional CER selectivity.
Fig. 1a illustrates the X-ray diffraction (XRD) patterns of the as-synthesized Na0.6CoO2, Na0.7CoO2 and Na0.9CoO2. The diffraction peaks appear at 16.26°, 32.78°, 36.7°, 40.36°, 44.56°, 49.98°, 63.76° and 66.02°, which match the (002), (004), (100), (102), (103), (104), (106) and (110) facets of the typical P2-phase hexagonal NaxCoO2 (PDF #87–0274). In the Raman spectra of all NaxCoO2 samples (Fig. 1b), the observed phonon vibration modes can be classified into three categories: The E1g mode (O—Co-O twisting vibration) corresponding to the in-plane (ab-plane) vibration of oxygen atoms within the CoO2 layer, the A1g mode (Co-O symmetric vibration) associated with the out-of-plane (c-axis) vibration of oxygen atoms in the CoO2 layer, and the E2g mode arising from the cooperative vibrations of Na and O atoms. It can be seen that the increase in sodium density enhances Na-O interactions, leading to a redshift of the E2g mode peaks. Simultaneously, the strengthened Na-O bonding induces varying degrees of O—Co-O distortion, as evidenced by the redshift of the E1g mode peaks (185, 188, 192 cm-1). The A1g mode peaks of Na0.6CoO2 and Na0.7CoO2 show significant differences, with shifts observed around 670 cm-1. In Na0.9CoO2, the presence of a high concentration of Na+ disrupts the symmetry of the Co-O bonds, resulting in enhanced intensity of the A1g mode peaks and a frequency shift to higher wavenumbers, reaching 684 cm-1.
Figure 1
Figure 1.
Phase and chemical states of NaXCoO2. (a) XRD spectra and (b) Raman spectra of Na0.6CoO2, Na0.7CoO2 and Na0.9CoO2. XPS spectra of (c) O 1s, (d) Na 1s and (e) Co 2p (f) Co valence ratio of Na0.6CoO2, Na0.7CoO2 and Na0.9CoO2.
The surface composition and chemical state of NaxCoO2 were analyzed using X-ray photoelectron spectroscopy (XPS). The full survey spectra of Na0.6CoO2, Na0.7CoO2 and Na0.9CoO2 all clearly exhibit the expected elements of Na, Co, and O (Figs. S1a-c in Supporting information). The high-resolution O 1s spectra of all NaxCoO2 samples are shown in Fig. 1c, which can be deconvoluted into four components: oxidative oxygen (O22−/O-), Co-O bonds, Na-O bonds and the Na KLL auger peaks [30–32]. The results demonstrate that as the sodium content (x) increases, the peak intensity of Na-O bonds enhances, whereas the Co-O bond peak intensity diminishes. The Na 1s spectra show a strong peak centered at the binding energy of 1071.6 eV (Fig. 1d), which can be fitted into four characteristic peaks: Na-OH, Nae, Naf, and Na-O-Co [33,34]. Among them, Nae and Naf correspond to sodium ions sharing edges or faces with CoO6 octahedra.
For the high-resolution Co 2p spectra of all NaxCoO2 samples (Fig. 1e), typical spin-orbit doublet comprising Co 2p3/2 and Co 2p1/2 were observed [35]. By employing the Shirley background, the Co 2p3/2 and Co 2p1/2 can be deconvoluted into contributions from Co2+ (797.05 and 782.05 eV), Co3+ (779.31 and 794.49 eV) and Co4+ (780.43 and 795.88 eV), indicating the coexistence of multiple cobalt oxidation states [36]. Table S1 (Supporting information) summarizes the peak intensities of Co2+, Co3+ and Co4+. As depicted in Fig. 1f, the Na0.7CoO2 sample exhibits the highest relative peak intensity of Co3+ (62%), followed sequentially by Na0.6CoO2 (57%) and Na0.9CoO2 (40%). Referring to the previous report, Co3+ species with partially filled d-orbitals demonstrate enhanced activity and stability during CER [37]. From this analytical perspective, Na0.7CoO2 shows advantages over both Na0.6CoO2 and Na0.9CoO2 as CER catalyst.
The morphology of NaxCoO2 with varying sodium content were characterized by scanning electron microscope (SEM) and transmission electron microscopy (TEM). The SEM images depicted in Figs. 2a-c reveal that all the as-synthesized NaxCoO2 exhibit a lamellar stacking structure. But their lateral dimensions and stacking thickness vary. Specifically, the stacking thicknesses of Na0.6CoO2, Na0.7CoO2 and Na0.9CoO2 are approximately 1 µm (Fig. S2b in Supporting information), 0.7 µm (Fig. S2d in Supporting information), and 1.2 µm (Fig. 2c), respectively. For the Na0.6CoO2, an lamellar with lateral dimension of approximately 1–5 µm was obseverd (Fig. 2a and Fig. S2a in Supporting information). Compared with Na0.6CoO2, both Na0.7CoO2 and Na0.9CoO2 demonstrate more regular hexagonal layered stacking, with lateral dimensions of about 1–3 µm (Fig. 2b and Fig. S2c in Supporting information) and 1–2.7 µm (Fig. 2c and Fig. S2e in Supporting information), respectively. Apparently, the lateral dimensions of NaxCoO2 decrease with increasing sodium content. Notably, visible pore structures have formed on the surface of the Na0.9CoO2 sample, which may result from surface structure degradation induced by the higher sodium content. The elemental mapping images of Na0.6CoO2, Na0.7CoO2 and Na0.9CoO2 demonstrate the uniformly distribution of Na, Co, and O (Fig. 2d, Figs. S3a and b in Supporting information). The TEM images reveal that NaxCoO2 presents a well-defined flake structure, consistent with the SEM characterization results (Figs. 2e-g). The high-resolution TEM image in Fig. 2h reveals lattice fringes with an interplanar spacing of 0.246 nm, matching well with the (100) plane of P2-phase hexagonal NaxCoO2.
Figure 2
Figure 2.
Morphology of NaXCoO2. SEM images of (a) Na0.6CoO2, (b) Na0.7CoO2 and (c) Na0.9CoO2. (d) SEM image and corresponding elemental mapping of Na0.7CoO2. (e-g) TEM images of Na0.7CoO2. (h) The corresponding HR-TEM image of selected yellow line region labelled in (g).
The CER performance of the synthesized NaxCoO2 catalysts was evaluated using a standard three-electrode system at room temperature. The selectivity is the foremost parameter for evaluating the catalytic efficiency of CER catalysts [38]. Fig. 3a displays the stable linear sweep voltammetry (LSV) curves of NaxCoO2 in both HCl or HNO3 electrolyte systems (pH 2) with varying Cl- concentrations. In the electrolytes of HCl and HNO3 without NaCl, negligible current density was observed in the potential region below 2.0 V. Upon NaCl addition to the electrolyte, the current density at identical potentials exhibits a gradual increase with increasing Cl- concentration. Especially in 4 mol/L NaCl + HCl electrolyte, only 1.538 V is required to achieve the current density at 100 mA/cm2, with the maximum current density reaching nearly 800 mA/cm2. The results demonstrate that the CER predominates in 4 mol/L NaCl + HCl electrolyte at potentials below 2.0 V. For this reason, 4 mol/L NaCl + HCl was selected as the optimal electrolyte system for this investigation. Fig. 3b presents the iR-corrected polarization curves of Na0.6CoO2, Na0.7CoO2 and Na0.9CoO2 obtained at a scan rate of 5 mV/s. The corresponding overpotentials at 10 mA/cm2 (η10) are indicated in Fig. 3c. Compared to Na0.6CoO2 (79.83 mVη10) and Na0.9CoO2 (84.71 mVη10), Na0.7CoO2 exhibits the lowest overpotential of 55.47 mVη10, indicating its superior CER activity. The Tafel plots summarized in Fig. 3d further confirm this conclusion (Table S2 in Supporting information).
Figure 3
Figure 3.
Electrocatalytic CER performance of NaxCoO2. (a) Linear sweep voltammetry (LSV) curves in HCl or HNO3 electrolytes (pH 2) with varying Cl- concentrations. (b) Polarization curves. (c) Overpotential at 10 mA/cm2 (η10). (d) Tafel slopes. (e) TOF values. (f) Double-layer capacitance (Cdl) values. (g) Nyquist plots (EIS). (h) Chronopotentiometry measurements of Na0.7CoO2 at 10 mA/cm2. (i) LSV curves of Na0.7CoO2 before and after 1000 cycles. (j) Comparison of the CER performance of Na0.7CoO2 with recently-reported electrocatalysts at 10 mA/cm2.
To gain further insight into the intrinsic catalytic activity of each active site, the turnover frequency (TOF) of the corresponding catalysts was calculated (Fig. 3e). The TOF of Na0.7CoO2 (2.38 s-1) is higher than that of Na0.6CoO2 (1.05 s-1) and Na0.9CoO2 (1.19 s-1). The double-layer capacitance (Cdl) measured in the non-faradaic region reflects the electrochemical active surface area (ECSA) of catalysts, representing a critical parameter for assessing their intrinsic catalytic activity. As shown in Fig. 3f and Figs. S4a-c (Supporting information), the Cdl values for Na0.6CoO2, Na0.7CoO2 and Na0.9CoO2 are 34.84, 58.14 and 32.47 mF/cm2, respectively. This consistent with their TOF results, underscoring the excellent electrochemical accessibility of Na0.7CoO2. Fig. 3g illustrates the electrochemical impedance spectroscopy (EIS) and the corresponding equivalent circuit model for all NaxCoO2 catalysts tested at fixed potential. Among these parameters, Rs represents the interfacial charge transfer resistance, serving as a crucial indicator for evaluating electron transfer kinetics during the CER process. The fitted Rs values are tabulated in Table S3 (Supporting information). Apparently, Na0.7CoO2 exhibits a lower Rs value, indicating faster charge transfer kinetics. Contact angle measurements provided further evidence supporting this result (Figs. S5a-c in Supporting information). In relative to Na0.6CoO2 (13°) and Na0.9CoO2 (22°), Na0.7CoO2 exhibits the smaller contact angle (6°).
The above findings demonstrate that modulating sodium density (x) in the intercalation layers can significantly influence the CER activity of NaxCoO2. The optimal catalytic performance was achieved at x = 0.7. Fig. S6 (Supporting information) presents the LSV curves of Na0.7CoO2 and commercial RuO2 in both 4 mol/L NaCl + HCl and HNO3 electrolytes. Within chloride-containing electrolyte (4 mol/L NaCl + HCl), Na0.7CoO2 requires 1.412 V to attain η10, superior to the 1.463 V of commercial RuO2 (Fig. S6a in Supporting information). Conversely, in HNO3 electrolyte (Fig. S6b in Supporting information), Na0.7CoO2 (2.035 V) requires substantially higher overpotentials than commercial RuO2 (1.697 V) to achieve η10. The results further indicate that Na0.7CoO2 exhibits excellent CER activity and low OER activity. In addition to high activity and selectivity, the stability also serves as a crucial parameter toward the practical evaluate of CER. To this end, the stability of the optimal Na0.7CoO2 catalyst was assessed by chronopotentiometry at constant current density and continuous cyclic voltammograms (CV) testing. As depicted in Fig. 3h, Na0.7CoO2 demonstrates excellent stability after 20 h of chronopotentiometry testing at a current density of 10 mA/cm2. Fig. S7 (Supporting information) illustrate SEM, TEM, HADDF-TEM and element mapping images of Na0.7CoO2 after 20 h of chronopotentiometry testing. From SEM and TEM images (Figs. S7a and b), Na0.7CoO2 maintains a well-defined flake structure after the durability test. The HADDF-TEM and elemental mapping images demonstrate the uniformly distribution of Na, Co, and O (Figs. S7c-g). Evidently, the structure of Na0.7CoO2 remains unchanged during CER testing. Fig. 3i presents the LSV curves were measured at a scan rate of 50 mV/s before and after 1000 CV cycles. The overpotential shows merely a 28 mV increase after 1000 continuous CV cycles, further highlighting the exceptional stability of the Na0.7CoO2 catalyst. Additional, the electrocatalytic activity of Na0.7CoO2 outperforms most previously reported CER catalysts under comparable operating conditions (Fig. 3j and Table S4 in Supporting information).
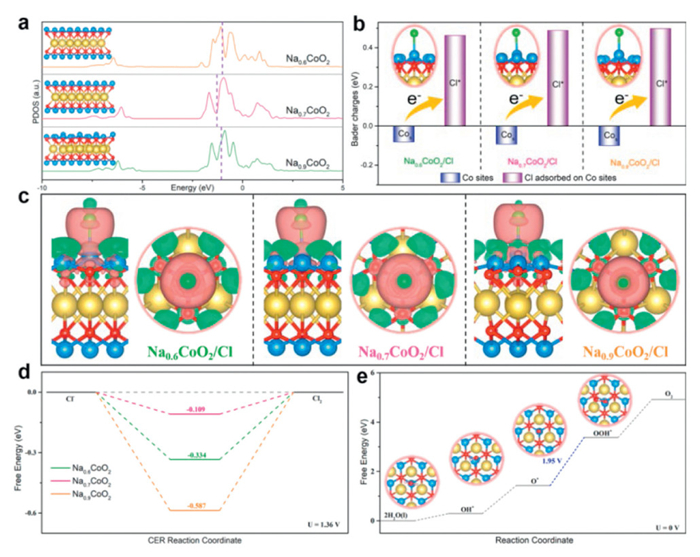
To further ascertain the impact of interlayer sodium density (x) on the CER performance of NaxCoO2 catalysts, density functional theory (DFT) calculations were conducted. Fig. S8 (Supporting information) displays the optimized NaxCoO2 model. The projection density of state (PDOS) of the d-bands at the Co sites (Cos) in the NaxCoO2 structure is illustrated in Fig. 4a. The corresponding d-band center is represented by the purple dashed line. It can be seen that the d-band center of Cos is correlated with the interlayer sodium density. According to the d-band theory, the adsorption of intermediates on the metal active sites weakens as the d-band center shifts away from the Fermi level. Compared with Na0.6CoO2 and Na0.9CoO2, the d-band center of Cos in Na0.7CoO2 is lower, indicating weaker binding of adsorbed Cl (Cl*) and Cl2 on its surface. The weaker adsorption would facilitate the release of Cl2. The optimized model of Cl* adsorbed on Cos in NaxCoO2 (NaxCoO2/Cl) are shown in Fig. S9 (Supporting information). The bond lengths of Cos-Cl* for Na0.6CoO2/Cl, Na0.7CoO2/Cl and Na0.9CoO2/Cl are calculated to be 2.131, 2.149, and 2.131 Å, respectively. This further demonstrates the rapid release of Cl* from the Na0.7CoO2 surface. Bader charge analysis and differential charge density were conducted to investigate the electronic interactions between Cl* and NaxCoO2. Bader charge analysis reveals that upon Cl* adsorption on the Cos of NaxCoO2, the charge value of Cos decreases while that of Cl* increases (Fig. 4b and Table S5 in Supporting information). Differential charge analysis demonstrates that electron accumulation localized around Cl* across all NaxCoO2/Cl systems (Fig. 4c). The results indicate that charges in NaxCoO2/Cl readily transfer from Cos to Cl*, which facilitates the evolution of chlorine gas.
Figure 4
Figure 4.
Theoretical analysis of the electrocatalytic mechanism. (a) PDOS of Na0.6CoO2, Na0.7CoO2 and Na0.9CoO2. (b) Bader charge and (c) differential charge density of Na0.6CoO2/Cl, Na0.7CoO2/Cl and Na0.9CoO2/Cl. (d) Gibbs free energy for CER over Na0.6CoO2, Na0.7CoO2 and Na0.9CoO2. (e) Gibbs free energy for OER over Na0.7CoO2.
Ulteriorly, given that the NaxCoO2 surface exposes Co atomic layers, the Gibbs free energy (∆G) for the Cl*-mediated pathway on the NaxCoO2 was calculated (Fig. 4d). The closer ∆GCl* approaches zero, the more favorable the chlorine adsorption-desorption equilibrium becomes. Relative to Na0.6CoO2 (−0.334 eV) and Na0.9CoO2 (−0.587 eV), Na0.7CoO2 shows a significantly higher ∆GCl* value (−0.109 eV), which is closest to the thermodynamic equilibrium state. Furthermore, the OER activity of Na0.7CoO2 was calculated to assess its CER selectivity. The comparative adsorption energy reveals that Cl* (−1.410 eV) exhibits stronger binding to the Na0.7CoO2 surface than H2O (−0.509 eV), as evidenced in Fig. S10 (Supporting information), which thermodynamically favors the chlorine activation pathway. Fig. 4e exhibits the Gibbs free energy of OER on Na0.7CoO2. The largest free energy change (∆Gmax) in thermodynamics corresponds to the formation of OOH*. The formation of the OOH* intermediate encounters an energy barrier of 1.95 eV, indicating the inactivity of Na0.7CoO2 towards OER. Taken together, these theoretical calculations reveal that altering the interlayer sodium concentration endows NaxCoO2 with a unique electronic structure, enabling moderate adsorption and desorption of Cl species. As a result, CER performance has significantly improved.
In summary, NaxCoO2 flakes with varying sodium densities (x = 0.6, 0.7, 0.9) has been constructed for efficient CER. The catalytic behavior was systematically investigated through an integrated experimental and theoretical calculations. It is demonstrated that modulating the interlayer sodium density endows Co atoms in NaxCoO2 with an optimally level of d-band center, enabling finely-tuned adsorption-desorption of Cl species (∆GCl* = −0.109 eV) and consequently boosting CER performance. As a result, the optimized Na0.7CoO2 demonstrates superior CER activity outperforming the benchmark RuO2, with the overpotential of 55.47 mV at 10 mA/cm2. More fascinatingly, Na0.7CoO2 confronts a substantial energy barrier (∆Gmax) of 1.95 eV during the OER process, which conclusively confirms its essential inactivity toward the competing OER. These findings not only provide groundbreaking insights into the catalytic mechanism of NaxCoO2 modulated by interlayer sodium concentration, but also paves the way for designing high-activity and high-selectivity CER catalysts.
CRediT authorship contribution statement
Guanjun Chen: Writing – original draft, Methodology, Investigation, Funding acquisition, Data curation, Conceptualization. Jiayi Yang: Writing – original draft, Investigation, Data curation. Zheming Huang: Investigation, Formal analysis. Long Chen: Investigation, Formal analysis. Wenyuan Duan: Validation, Supervision, Investigation, Data curation. Tong Wang: Methodology, Formal analysis. Xingang Kong: Supervision, Investigation, Funding acquisition. Haibo Yang: Writing – review & editing, Formal analysis, Conceptualization.
Acknowledgments
This work was jointly supported by the Scientific Research Program Funded by Shaanxi Provincial Education Department (No. 24JR031), the Research Fund of Shaanxi Key Laboratory of Green Preparation and Functionalization for Inorganic Materials (No. SKL001), the National Natural Science Foundation of China (No. 52372288) and the Natural Science Basic Research Program of Shaanxi (No. 2022JQ-373). The authors would like to thank the Shiyanjia Lab (www.shiyanjia.com) for the support of the XPS test.
Supplementary materials
Supplementary material associated with this article can be found, in the online version, at doi:10.1016/j.cclet.2025.111662.
[1]
W. Liu, A.Y. Wang, J.H. Zhang, et al., ACS Nano 10 (2025) 10038–10047. doi: 10.1021/acsnano.4c16678
[2]
Z. Li, Y.S. Wang, H. Liu, et al., Nat. Mater. 3 (2025) 1–9.
Figure 1
Phase and chemical states of NaXCoO2. (a) XRD spectra and (b) Raman spectra of Na0.6CoO2, Na0.7CoO2 and Na0.9CoO2. XPS spectra of (c) O 1s, (d) Na 1s and (e) Co 2p (f) Co valence ratio of Na0.6CoO2, Na0.7CoO2 and Na0.9CoO2.
Figure 2
Morphology of NaXCoO2. SEM images of (a) Na0.6CoO2, (b) Na0.7CoO2 and (c) Na0.9CoO2. (d) SEM image and corresponding elemental mapping of Na0.7CoO2. (e-g) TEM images of Na0.7CoO2. (h) The corresponding HR-TEM image of selected yellow line region labelled in (g).
Figure 3
Electrocatalytic CER performance of NaxCoO2. (a) Linear sweep voltammetry (LSV) curves in HCl or HNO3 electrolytes (pH 2) with varying Cl- concentrations. (b) Polarization curves. (c) Overpotential at 10 mA/cm2 (η10). (d) Tafel slopes. (e) TOF values. (f) Double-layer capacitance (Cdl) values. (g) Nyquist plots (EIS). (h) Chronopotentiometry measurements of Na0.7CoO2 at 10 mA/cm2. (i) LSV curves of Na0.7CoO2 before and after 1000 cycles. (j) Comparison of the CER performance of Na0.7CoO2 with recently-reported electrocatalysts at 10 mA/cm2.
Figure 4
Theoretical analysis of the electrocatalytic mechanism. (a) PDOS of Na0.6CoO2, Na0.7CoO2 and Na0.9CoO2. (b) Bader charge and (c) differential charge density of Na0.6CoO2/Cl, Na0.7CoO2/Cl and Na0.9CoO2/Cl. (d) Gibbs free energy for CER over Na0.6CoO2, Na0.7CoO2 and Na0.9CoO2. (e) Gibbs free energy for OER over Na0.7CoO2.


 DownLoad:


 下载:
下载:


