Citation:
Qiao-Ling Mo, Xiao-Cheng Dai, Yang Xiao, Fang-Xing Xiao. Atomically precise Au25(GSH)18 nanoclusters versus plasmonic Au nanocrystals: Evaluating charge impetus in solar water oxidation[J]. Chinese Chemical Letters,
2023, 34(6): 107901.
doi:
10.1016/j.cclet.2022.107901
Atomically precise Au25(GSH)18 nanoclusters versus plasmonic Au nanocrystals: Evaluating charge impetus in solar water oxidation
English
Atomically precise Au25(GSH)18 nanoclusters versus plasmonic Au nanocrystals: Evaluating charge impetus in solar water oxidation
Received Date:
24 May 2022 Accepted Date:
11 October 2022 Revised Date:
09 September 2022 Available Online:
15 June 2023
Abstract:
Atomically precise metal nanoclusters (NCs) have been deemed as an emerging class of metal nanomaterials owing to fascinating size-dependent physicochemical properties, discrete energy band structure, and quantum confinement effect, which are distinct from conventional metal nanoparticles (NPs). Nevertheless, metal NCs suffer from photoinduced self-oxidative aggregation accompanied by in-situ transformation to metal NPs, markedly reducing the photosensitization of metal NCs. Herein, maneuvering the generic instability of metal NCs, we perform the charge transport impetus comparison between atomically precise metal NCs and plasmonic metal NPs counterpart obtained from in-situ self-transformation of metal NCs in photoelectrochemical (PEC) water splitting reaction. For conceptual demonstration, we proposed two quintessential heterostructures, which include TNTAs-Au25 heterostructure fabricated by electrostatically depositing glutathione (GSH)-protected Au25(GSH)18 NCs on the TiO2 nanotube arrays (TNTAs) substrate, and TNTAs-Au heterostructure constructed by triggering self-transformation of Au25(GSH)18 NCs to plasmonic Au NPs in TNTAs-Au25via calcination. The results indicate that photoelectrons produced over Au25 NCs are superior to hot electrons of plasmonic Au NPs in stimulating the interracial charge transport toward solar water oxidation. This is mainly ascribed to the significantly accelerated carrier transport kinetics, prolonged carrier lifespan, and substantial photosensitization effect of Au25 NCs compared with plasmonic Au NPs, resulting in the considerably enhanced PEC water splitting performance of TNTAs-Au25 relative to plasmonic TNTAs-Au counterpart under visible light irradiation. Our work would provide important implications for rationally designing atomically precise metal NCs-based photosystems toward solar energy conversion.
Photoelectrochemical (PEC) water splitting provides an environmentally friendly and sustainable method for the environmental purification and solar energy conversion since the rapid increase of global pollution and energy crisis [1-5]. Metal nanoparticles (NPs) occupy an important sector in metal nanomaterials in the past few decades and have been extensively utilized for multifarious catalysis [6-8]. When the size of metal NPs drops to ultra-small range, typically composed of a few to several hundred atoms with diameter below 2 nm, they are referred to as atomically precise metal nanoclusters (NCs), wholly distinct from conventional metal NPs counterparts [9,10]. Atomically metal NCs are characteristic of discrete energy band structure, which endows them with molecular-like highest occupied molecular orbital-lowest unoccupied molecular orbital (HOMO-LUMO) transition level [11-13]. Thus, these intriguing quasi-semiconductor metal NCs are able to act as both photosensitizers and catalytically active centers for multifunctional photoredox catalysis [14-16]. Nevertheless, photo-induced self-oxidative aggregation of metal NCs resulting from generic instability retards their wide-spread applications [17,18].
Compared with atomically precise metal NCs, plasmonic metal NPs enable the occurrence of analogous photosensitization process but dominated by distinct mechanism [19-21]. Caused by the localized surface plasmon resonance (LSPR) effect, plasmonic metal NPs could efficiently drive the photoredox catalysis using photoexcited hot charge carriers (i.e., hot electrons and hot holes) to overcome activation barriers [22-25]. Despite the merits of atomically precise metal NCs and plasmonic metal NPs, reasonable, strict and comprehensive comparison between these two crucial metal nanomaterials in terms of charge transfer characteristics has so far not yet been carried out. Especially, essential roles of metal NCs and plasmonic metal NPs in tuning of interfacial charge migration in photoelectrochemical (PEC) water splitting reaction have yet to be unleashed.
Herein, we designed the TNTAs-Au25 heterostructure via a facile electrostatic self-assembly strategy by depositing atomically precise glutathione (GSH)-protected gold nanoclusters [Au25(GSH)18] NCs on the TiO2 nanotube arrays (TNTAs) framework. Subsequently, Au25(GSH)18 NCs were in-situ transformed to plasmonic Au NPs via calcination, resulting in the plasmonic TNTAs-Au heterostructure. In the TNTAs-Au25 photoanode, Au25(GSH)18 NCs function as photosensitizers, and the thus-excited photoelectrons contribute to the considerably enhanced PEC performances relative to blank TNTAs substrate.
However, hot electrons photoexcited over plasmonic Au NPs are responsible for the PEC performances of TNTAs-Au heterostructure. It was unveiled that electrons photoexcited over Au25(GSH)18 NCs are superior to hot electrons of plasmonic Au NPs in promoting the interfacial charge transfer efficiency toward PEC water splitting. This is due to the markedly prolonged carry lifetime of Au25(GSH)18 NCs relative to plasmonic Au NPs. Our work could reinforce the fundamental understanding on charge transfer mechanism of metal NCs-based photosystems for solar energy conversion.
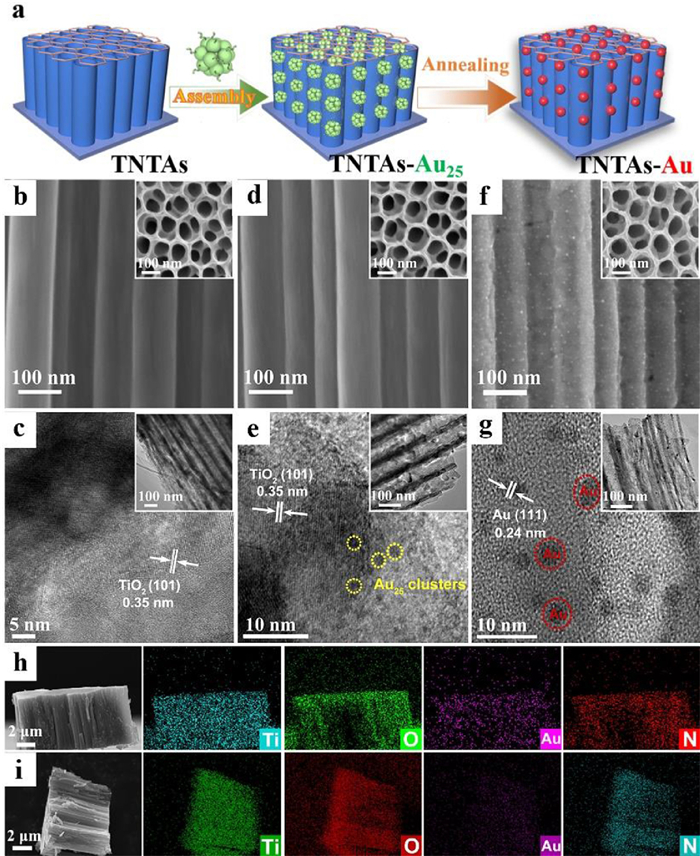
The flowchart for fabrication of TNTAs-Au25 and TNTAs-Au heterostructured photoanodes is depicted in Fig. 1a. Firstly, TNTAs substrate grown on Ti foil was fabricated by a two-step electrochemical anodization method, as illustrated in Fig. S1 (Supporting information), giving rise to one-dimensional hierarchically ordered TiO2 nanotubes arrays. Polyhedral model of anatase TiO2 is shown in Fig. S2 (Supporting information). Then, atomically precise Au25(GSH)18 NCs were deposited on the TNTAs surface through an electrostatic self-assembly approach. Subsequently, TNTAs-Au heterostructures were obtained via annealing the TNTAs-Au25 heterostructures, wherein Au25(GSH)18 NCs were self-transformed to plasmonic Au NPs. Scanning (SEM) and transmission electron microscopic (TEM) measurements were carried out to probe the morphologies of TNTAs, TNTAs-Au25 and TNTAs-Au heterostructures. Fig. 1b and Fig. S3 (Supporting information) show that TNTAs substrate is featured by hierarchically ordered tubular nanotube arrays. As seen in the HRTEM image (Fig. 1c), inter-planar spacing is measured to be 0.35 nm corresponding to the (101) crystal face of anatase TiO2 [25]. After electrostatic deposition of Au25(GSH)18 NCs, morphology of TNTAs-Au25 heterostructure is similar to blank TNTAs, as reflected by the SEM image (Fig. 1d). Nevertheless, from the TEM image (Fig. 1e), it is apparent that TNTAs surface is uniformly decorated with Au25(GSH)18 NCs with ca. 2 nm in size, which is in faithful agreement with the size of pristine Au25(GSH)18 NCs aqueous solution (Fig. S4 in Supporting information). Note that no lattice fringe of Au25(GSH)18 NCs is observed in the HRTEM image of TNTAs-Au25 heterostructure (Fig. 1e), and this is mainly due to its intrinsic amorphous property. As displayed in Fig. 1f, SEM image of TNTAs-Au heterostructure demonstrates a rough surface, which is caused by Au NPs adornment stemming from calcination induced self-transformation of atomically precise ultra-small Au25(GSH)18 NCs to metallic Au NPs. Consistent with the SEM image (Fig. 1f), TEM image of TNTAs-Au heterostructure (Fig. 1g) confirms that Au NPs are uniformly deposited on the TNTA framework. HRTEM image of TNTAs-Au (Fig. 1g) exhibits the lattice fringe spacing of 0.24 nm corresponding to the (111) crystal plane of Au [26]. Besides, attachment of Au25(GSH)18 NCs and Au NPs to the TNTAs can be confirmed by the SEM elemental mapping images. As shown in Figs. 1h and Fi, elemental mapping results of both TNTAs-Au25 and TNTAs-Au heterostructures show the homogeneous distribution of Ti, O, Au, and N signals throughout the entire heterostructures, among which Ti and O are from TNTAs substrate, Au and N from Au25(GSH)18 NCs and Au NPs.
Figure 1
Figure 1.
(a) Schematic illustration of construction of TNTAs-Au and TNTAs-Au25 heterostructured photoanodes. SEM images of (b) TNTAs, (d) TNTAs-Au25 and (f) TNTAs-Au heterostructures with top-view images in the inset along with elemental mapping results for (h) TNTAs-Au25 and (i) TNTAs-Au. HRTEM images of (c) TNTAs, (e) TNTAs-Au25 and (g) TNTAs-Au heterostructures with low-magnified images in the inset.
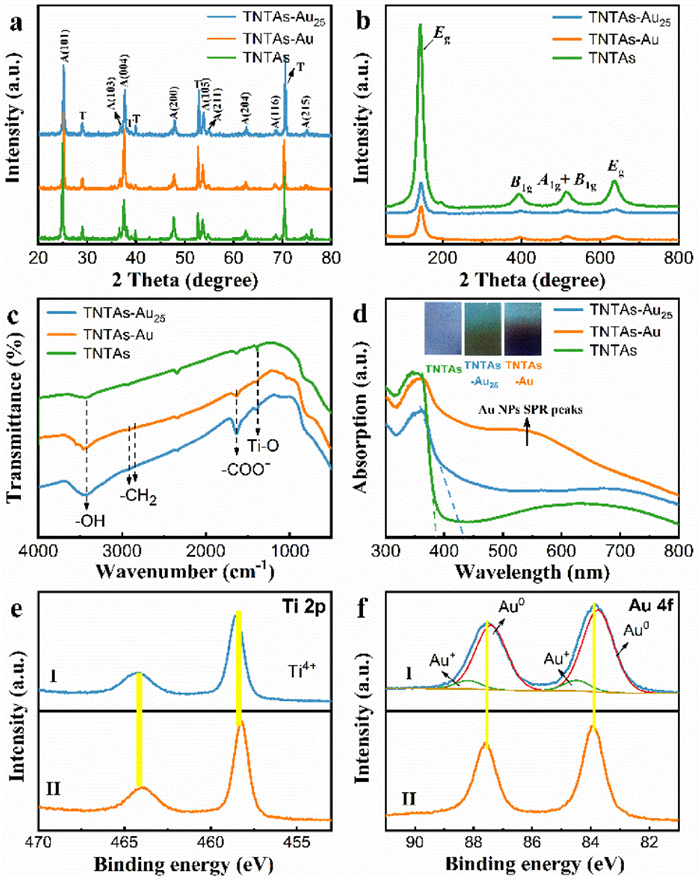
X-ray diffraction (XRD) patterns of blank TNTAs, TNTAs-Au25 and TNTAs-Au heterostructures are shown in Fig. 2a. It is obvious that XRD patterns of all the samples are similar, indicating that the as-prepared samples possess the same anatase TiO2 (JCPDS No. 21–1272) and metal Ti phase (JCPDS No. 44–1294) [27,28]. This is also corrborated by the Raman results. As displayed in Fig. 2b, anatase TiO2 phase is verified by the Raman peaks at around 143 (Eg), 392 (B1g), 514 (A1g + B1g) and 635 (Eg) cm−1 for blank TNTAs, TNTAs-Au25 and TNTAs-Au heterostructures [29]. Notably, Raman signal intensity of TNTAs-Au25 and TNTAs-Au is much lower than TNTAs substrate, indicative of partial shielding effects of Au25(GSH)18 NCs and Au NPs. Functional groups of TNTAs, TNTAs-Au25 and TNTAs-Au heterostructures are detected by fourier transform infrared spectroscopy (FTIR). As illustrated in Fig. 2c, all the samples exhibit two identical regions ranging from 3000 cm−1 to 3500 cm−1 that correspond to the surface −OH group, and 1385 cm−1 corresponds to the Ti–O bond from TiO2 substrate [30]. For the FTIR spectrum of TNTAs-Au25, the band at 1628 cm−1 is attributed to the stretching vibration mode of –COOH group from GSH ligand, implying grafting of Au25(GSH)18 NCs on the TiO2 framework [31,32]. Note that peak intensity of the –COOH functional group in the FTIR result of TNTAs-Au is greatly reduced compared with that of TNTAs-Au25, which is caused by the self-transformation of Au25(GSH)18 NCs to Au NPs after calcination.
Figure 2
Figure 2.
(a) XRD patterns, (b) Raman spectra, (c) FTIR spectra and (d) DRS results of TNTAs, TNTAs-Au25 and TNTAs-Au heterostructures. High-resolution (e) Ti 2p and (f) Au 4f spectra of (Ⅰ) TNTAs-Au25 and (Ⅱ) TNTAs-Au heterostructures.
As displayed in the UV–vis diffuse reflectance spectra (DRS), TNTAs-Au25 and TNTAs-Au heterostructures exhibit the substantial absorbance in the visible region (Fig. 2d). The red-shift of absorption band edge is observed in the DRS result of TNTAs-Au25 compared with TNTAs, implying the photosensitization effect of Au25(GSH)18 NCs. After calcination, light absorption range of TNTAs-Au is further extended as compared with TNTAs-Au25 accompanied by the appearance of a typical SPR peak (ca. 520 nm) of Au NPs, indicative of successful self-transformation of Au25(GSH)18 NCs to Au NPs [33]. Transformed plots based on the Kubelka-Munk function vs. energy of light for TNTAs, TNTAs-Au25, and TNTAs-Au (Fig. S5 in Supporting information) are utilized to estimate the bandgap, which are roughly calculated to be ca. 3.16, 2.93 and 2.62 eV for TNTAs, TNTAs-Au25 and TNTAs-Au, respectively [34]. The result suggests that deposition of Au25(GSH)18 NCs and Au NPs on the TNTAs can reduce the bandgap of TiO2 substrate, thereby improving the light harvesting capability of composite photoanode in the visible domain. Alternatively, as shown in the insets of Fig. 2d, color change of the samples also proves the deposition of Au25(GSH)18 NCs (brown) and self-transformation of Au25(GSH)18 NCs to Au NPs (black) on the TNTAs substrate.
XPS spectrum was utilized to analyze the surface chemical composition and chemical states of the samples. XPS results of pristine TNTAs are provided in Fig. S6 (Supporting information) for specific comparison. Survey spectra (Fig. S7a in Supporting information) of TNTAs-Au25 and TNTAs-Au reveal the presence of O, Ti, N, C, S and Au elements. According to the high-resolution Ti 2p spectra of TNTAs-Au and TNTAs-Au25 (Fig. 2e), Ti chemical state is assigned to the Ti4+ state [35,36], consistent with TiO2 nanotube arrays. For the high-resolution Au 4f spectrum of TNTAs-Au25 (Fig. 2f, Ⅰ), the two peaks at 83.78 (Au 4f7/2) and 87.43 eV (Au 4f5/2) are assigned to the Au0, and the other two peaks at 84.53 and 88.18 eV correspond to the Au+ species [37]. However, as displayed in the high-resolution Au 4f spectrum of TNTAs-Au (Fig. 2f, Ⅱ), only metallic Au0 species is detected, once again implying the self-transformation of Au25(GSH)18 NCs to Au NPs. As shown in Fig. S7bI (Supporting information), high-resolution C 1s spectrum of TNTA-Au25 can be de-convoluted to three peaks at around 284.8, 286.1, and 288.0 eV, which are ascribed to the C–C/C–H, C–OH/C–O–C, and –COOH species resulting from GSH ligand encapsulation on the Au25 surface, respectively [35]. Obviously, peak intensities of C–OH/C–O–C and COOH species in TNTAs-Au are weaker than those of TNTA-Au25 (Fig. S7bII in Supporting information), suggesting the successful self-transformation of Au25(GSH)18 NCs to Au NPs via calcination for removing GSH ligand. Consistently, for the high-resolution O 1s spectra (Fig. S7c in Supporting information), the peaks of TNTAs-Au (Fig. S7cII in Supporting information) at 530.13 and 531.38 eV are assigned to the Ti–O and Ti–OH species [27]. However, high-resolution O 1s spectrum of TNTA-Au25 (Fig. S7cI in Supporting information) displays three peaks at 529.78, 531.31 and 532.98 eV, which correspond to the Ti–O, Ti–OH and O=C–OH species [38]. The absence of O=C–OH species in the high-resolution O 1s spectrum of TNTA-Au implies removal of GSH ligand on the Au25 NCs surface after calcination. Clear N signal is observed in the high-resolution N 1s spectrum of TNTAs-Au25 (Fig. S7dI in Supporting information), and it can be de-convoluted to three peaks at 399.78, 401.18 and 401.92 eV, attributable to the –NH2/–NH–, R3N and –NH3+ species from GSH ligand [39], respectively. Conversely, disappearance of N 1s signal in TNTAs-Au (Fig. S7dII in Supporting information) is ascribed to the carbonization of GSH ligand during the self-transformation of Au25(GSH)18 NCs to metallic Au NPs via calcination.
As unveiled in Fig. S8a (Supporting information), dipping time considerably influences the PEC performance of TNTAs-Au25. Specifically, photocurrent of TNTAs-Au25 gradually increases with increasing the dipping time from 0.5 h to 3 h, and subsequently, it no longer increases upon further prolonging the dipping time to 12 h, which is caused by the fact that amount of Au25(GSH)18 NCs deposited on the TNTAs is saturated. Fig. S8b (Supporting information) shows that photocurrent of TNTAs-Au is not changed with annealing temperature increasing from 100 ℃ to 200 ℃, and then decreases sharply upon further boosting the temperature, which is attributed to the gradual self-transformation of Au25(GSH)18 NCs to Au NPs for retarding the photosensitization effect of NCs. This speculation can be corroborated by the color change of the samples (Fig. S8c in Supporting information). Therefore, the samples dipped for 3 h and then annealed at 200 ℃ for 1 h was chosen as the optimal sample for following studies.
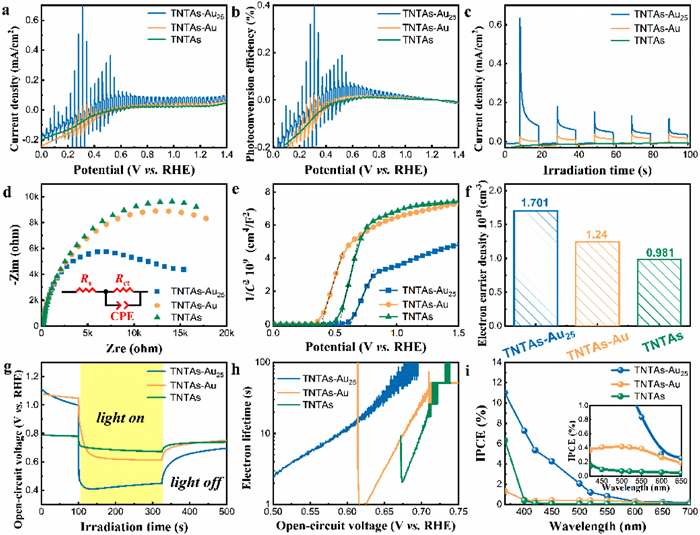
In the linear sweep voltammetry (LSV) curves (Fig. 3a), optimal sample of TNTAs-Au25 heterostructured photoanode displays the superior photocurrent density under visible light irradiation especially in the low-potential region, proving the photosensitization effect of Au25(GSH)18 NCs for producing the photoelectrons. When TNTAs-Au25 photoanode is annealed to trigger the self-transformation of Au25(GSH)18 NCs to Au NPs, photocurrent of TNTAs-Au photoanode is markedly decreased with the onset potential positively shifted. Besides, blank TNTAs substrate demonstrates negligible photocurrent under visible light irradiation owing to the large bandgap. Consistently, ABPE (Fig. 3b) results calculated by Eq. S2 (Supporting information) agrees with the LSV result. It is worthwhile that TNTAs-Au exhibits enhanced photocurrent relatve to blank TNTAs (Figs. 3a and c), which is ascribed to the plasmonic photoexciation of Au NPs for producing hot charge carriers including hot electrons and hot holes, resulting in plasmon-induced PEC performances. Apparently, TNTAs-Au25 shows the considerably enhanced photocurrent in comparison with TNTAs-Au and TNTAs, and they follow the order of TNTAs-Au25 > TNTAs-Au > TNTAs, verifying the crucial roles of Au25(GSH)18 NCs and Au NPs as photosensitizers.
Figure 3
Figure 3.
PEC water splitting performances of TNTAs, TNTAs-Au, and TNTAs-Au25 heterostructures in Na2SO4 aqueous solution (pH 6.69) under visible light irradiation (λ > 420 nm) including (a) LSV results (5 mV/s), (b) ABPE results, (c) on-off transient photocurrent responses (0.61 V vs. RHE), (d) EIS results, (e) Mott-Schottky plots and (f) charge density (ND), (g) open-circuit voltage decay (OCVD) and (h) electron lifetime (τn), and (i) IPCE results.
Electrochemical impedance spectroscopy (EIS) is also applied to gain insights into the interfacial charge transfer process. As displayed in Fig. 3d, TNTAs-Au25 photoanode exhibits the more decreased semicircle arc radius at high frequency than TNTAs-Au and bare TNTAs, thus manifesting the fastest charge transfer rate over TNTAs-Au25 and TNTAs substrate. As shown in Table S2 (Supporting information), Rct values are extracted from the semicircle at high frequency by fitting it according to a simple equivalent circuit composed of a series resistance (Fig. 3d, inset). Apparently, TNTAs-Au25 demonstrates the smallest Rct value (1.290 × 10⁴ ohm) compared with TNTAs-Au (1.731 × 10⁴ ohm) and TNTAs (1.757 × 10⁴ ohm), indicative of its lowest charge transfer resistance in the interfacial region. Mott−Schottky plots of the samples (Fig. 3e) exhibit the positive slope, suggesting that all the photoanodes are n-type semiconductor. The linear slope of Mott–Schottky curves for different samples follows the orders of TNTAs > TNTAs-Au > TNTAs-Au25, indicating the increase in capacitance upon Au NPs and Au25(GSH)18 NCs deposition [40]. Charge density (ND) value is calculated based on Eq. S3 (Supporting information) (Fig. 3f), and the results show that TNTAs-Au25 possesses the ND of 1.701 × 1018 cm−3 followed in turn by TNTAs-Au (1.24 × 1018 cm−3) and TNTAs (0.981 × 1018 cm−3).
Electron lifetime is explored by monitoring the open-circuit voltage decay (OCVD) results upon turning off light to probe the interfacial charge transfer kinetics. As mirrored in Fig. 3g, TNTAs-Au25 exhibits the larger open-circuit voltage (Voc) together with longer electron lifetime (τn, Fig. 3h) relative to TNTAs-Au, and both of them demonstrate remarkably enhanced Voc and τn with respect to blank TNTAs substrate, substantiating the higher charge transfer efficiency between Au25(GSH)18 NCs and TNTAs. To evaluate the contribution of light wavelength to photocurrent generation, IPCE results at 0.61 VRHE, which probes the photocurrent of photoanode as a function of incident wavelength, were probed. As displayed in Fig. 3i, IPCE curves of pristine TNTAs is consistent with the DRS results, which only exhibits photocurrent in the UV region owing to the large bandgap of TiO2 substrate. According to Eq. S5 (Supporting information), TNTAs-Au25 photoanode exhibits IPCE of ca. 11% at 365 nm, which is almost 2 times larger than TNTAs (ca. 6%), confirming the important role of Au25(GSH)18 NCs in enhancing the photocurrent of TNTAs-Au25. For the TNTAs-Au photoanode, photo-response range of IPCE result is slightly extended to visible light region accompanied by the appearance of a SPR peak between 400 nm and 600 nm. Thus, IPCE results of TNTAs-Au25 and TNTAs-Au substantiate the photosensitization and plasmonic effect of Au25 and Au in boosting the PEC performances. Additionally, PEC water oxidation activities of TNTAs-Au and TNTAs-Au25 under continuous visible-light irradiation are probed to evaluate the photostability. As shown in Fig. S9 (Supporting information), TNTAs-Au25 demonstrates unfavorable photostability with photocurrent rapidly decaying under long-term light irradiation owing to the loss of photosensitization capability of Au25 NCs, while TNTAs-Au demonstrates relatively stable photocurrent, which is attributed to the fact that Au NPs are more stable than Au25(GSH)18 NCs.
Besides, photoluminescence (PL) spectrum is employed to evaluate the interfacial charge separation [41]. As shown in Fig. S10 (Supporting information), PL intensity of TNTAs substrate was markedly decreased after Au25(GSH)18 NCs and plasmonic Au NPs deposition. Moreover, TNTAs-Au25 demonstrates much lower PL intensity with respect to TNTAs-Au. Hence, PL results concurrently indicate the most efficient charge separation over Au25(GSH)18 NCs than that over plasmonic Au NPs, which is in line with PEC water splitting performances aforementioned.
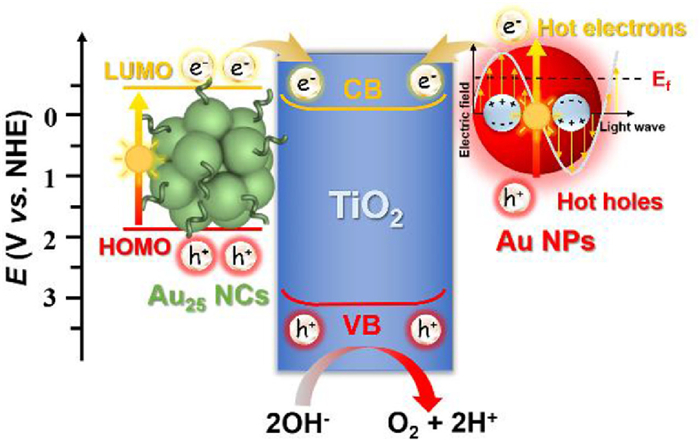
On the basis of the above discussion, a tentative reaction mechanism for PEC water splitting over TNTAs-Au25 and TNTAs-Au was proposed, as illustrated in Scheme 1 and Fig. S11 (Supporting information). Considering Au25(GSH)18 NCs are featured by HOMO-LUMO gap, and thus it can act like a semiconductor with small bandgap [39]. CV result of Au25@(GSH)18 NCs is exhibited in Fig. S12 (Supporting information), based on which LUMO energy level is determined as −0.44 V vs. NHE according to the bandgap (2.32 eV) and HOMO energy levels (1.88 vs. NHE) [39]. Specifically, when TNTAs-Au25 heterostructure is irradiated by visible light, electrons are photoexcited from the HOMO level to the LUMO level of Au25(GSH)18 NCs to produce the electron-hole pairs, leaving holes in the HOMO level. Combined with the M-S results and Tauc data, it is apparent that Au25@(GSH)18 NCs and TNTAs substrate (TiO2) demonstrate the favorable energy level alignment, that is, LUMO potentials of Au25@(GSH)18 NCs is more negative than the CB of TNTAs (−0.1 V vs. NHE) [39]. In this way, electrons photoexcited over Au25(GSH)18 NCs can be injected into the CB of TNTAs. Subsequently, the electrons flow to the photocathode to produce H2, resulting in the efficient charge separation. Simultaneously, the holes accumulating in the HOMO level of Au25(GSH)18 NCs oxidize the water to produce O2, thereby leading to enhanced PEC water splitting performances. Unlike Au25(GSH)18 NCs, plasmonic Au NPs are photoexcited under visible light irradiation to produce hot charge carriers owing to SPR effect. The hot electrons then are injected into the CB of TiO2 surpassing the Schottky junction, leaving energetic hot holes for water oxidation, thereby fulfilling the plasmon-induced PEC water splitting process.
Scheme 1
Scheme 1.
Schematic illustration depicting the charge transfer mechanism over TNTAs-Au25 and TNTAs-Au heterostructured photoanodes.
In summary, we have successfully unleashed the superiority of photoelectrons over Au25(GSH)18 NCs to the plasmon-induced hot electrons over Au NPs in boosting interfacial charge transfer in PEC system. The self-transformation of Au25(GSH)18 NCs to plasmonic Au NPs under heat treatment lays a solid foundation for comprehensive and systematic comparison between these two distinct metal nanomaterials by judiciously maneuvering the generic instability of metal NCs. Our work would further bridge the gap between atomically precise metal NCs and plasmonic metal nanocrystals in terms of charge transfer characteristic toward solar energy conversion.
Declaration of competing interest
The authors declared that they have no competing interests.
Acknowledgments
The support by the Award Program for Minjiang Scholar Professorship is greatly acknowledged. This work was financially supported by the National Natural Science Foundation of China (Nos. 21703038, 22072025) and Fujian Science & Technology Innovation Laboratory for Optoelectronic Information of China (No. 2021ZR147).
Supplementary materials
Supplementary material associated with this article can be found, in the online version, at doi:10.1016/j.cclet.2022.107901.
X.C. Dai, M.H. Huang, Y.B. Li, et al., J. Phys. Chem. C 124 (2020) 4989–4998. doi: 10.1021/acs.jpcc.9b10132
Figure 1
(a) Schematic illustration of construction of TNTAs-Au and TNTAs-Au25 heterostructured photoanodes. SEM images of (b) TNTAs, (d) TNTAs-Au25 and (f) TNTAs-Au heterostructures with top-view images in the inset along with elemental mapping results for (h) TNTAs-Au25 and (i) TNTAs-Au. HRTEM images of (c) TNTAs, (e) TNTAs-Au25 and (g) TNTAs-Au heterostructures with low-magnified images in the inset.
Figure 2
(a) XRD patterns, (b) Raman spectra, (c) FTIR spectra and (d) DRS results of TNTAs, TNTAs-Au25 and TNTAs-Au heterostructures. High-resolution (e) Ti 2p and (f) Au 4f spectra of (Ⅰ) TNTAs-Au25 and (Ⅱ) TNTAs-Au heterostructures.
Figure 3
PEC water splitting performances of TNTAs, TNTAs-Au, and TNTAs-Au25 heterostructures in Na2SO4 aqueous solution (pH 6.69) under visible light irradiation (λ > 420 nm) including (a) LSV results (5 mV/s), (b) ABPE results, (c) on-off transient photocurrent responses (0.61 V vs. RHE), (d) EIS results, (e) Mott-Schottky plots and (f) charge density (ND), (g) open-circuit voltage decay (OCVD) and (h) electron lifetime (τn), and (i) IPCE results.

 DownLoad:

 下载:
下载:


