Citation:
Yuanyi Zhou, Ke Ma, Jinfeng Liu, Zirun Zheng, Bo Hu, Yu Meng, Zhizhong Li, Mingshan Zhu. Is reactive oxygen species the only way for cancer inhibition over single atom nanomedicine? Autophagy regulation also works[J]. Chinese Chemical Letters,
2024, 35(6): 109056.
doi:
10.1016/j.cclet.2023.109056
Is reactive oxygen species the only way for cancer inhibition over single atom nanomedicine? Autophagy regulation also works
English
Is reactive oxygen species the only way for cancer inhibition over single atom nanomedicine? Autophagy regulation also works
Postdoctoral Innovation Practice Base, The First and Fifth Affiliated Hospital of Jinan University, Guangzhou 510632, China
b.
Guangdong Provincial Key Laboratory of Spine and Spinal Cord Reconstruction, The Fifth Affiliated Hospital of Jinan University (Heyuan Shenhe People’s Hospital), Heyuan 517465, China
c.
School of Environment, Jinan University, Guangzhou 511443, China
d.
Department of Nephrology, The First Affiliated Hospital of Jinan University, Guangzhou 510632, China
Received Date:
29 June 2023 Accepted Date:
04 September 2023 Revised Date:
31 August 2023 Available Online:
15 June 2024
Abstract:
Exploring the therapeutic effect of single atom catalysts beyond reactive oxygen species (ROS) modulation would boost the prosperity of nanomedicine in cancer treatment. Autophagy as a vital therapy target offers new options for the control of renal cell carcinoma (RCC) progression. Herein, Fe single atom-decorated graphene oxide (Fe1-GO) nanosheet is developed to be a feasible autophagy inducer in RCC treatment. With the well-dispersed O−Fe1−O active sites, Fe1-GO kills ACHN cells effectively but maintains acceptable cytotoxicity to the normal podocyte and HK2 ones. In-depth analyses ascribe the inhibition of ACHN cells to the upregulated autophagy instead of the commonly known catalytic ROS generation. The in vivo therapeutic effect of Fe1-GO nanomedicine is also validated by the RCC-bearing BALB/c mice model, realizing an 89% reduction of tumor weight and good biosafety. This work provides new insights into the design of autophagy regulators as well as potential therapeutic strategies for RCC treatment.
Here a Fe single atom nanomedicine is developed as an efficient autophagy inducer for RCC treatment, displaying enhanced cytotoxicity upon ACHN cells and acceptable biosafety to the normal ones. By upregulating autophagy instead of catalyzing the generation of reactive oxygen species, an 89% reduction of tumor weight is achieved in RCC-bearing mice.
As the most lethal common urological cancer, renal cell carcinoma (RCC) represents 2%-3% of all cancers. There are roughly 270,000 new RCC cases and 116,000 RCC-related deaths reported annually around the world, and unfortunately, the growth trend of these numbers holds up [1–3]. Although surgery and adjuvant chemo- or radiotherapy could cure RCC in some cases, 20%-30% of RCC patients are found with distant metastasis already at diagnosis, and 30%-40% for recurrence and metastasis [4]. The successful application of molecularly targeted drugs (sunitinib as the representative) has improved the prognosis of metastatic RCC. However, the inevitable drug resistance developed at the later stage hampers the further improvement of the survival rate and quality of life. Therefore, working out new strategies that could securely and effectively block or reverse RCC evolution is urgent.
The blooming of single atom catalysis provides opportunities for nanomedicines toward the atomic level. Isolated individual atoms display excellent atomic economy, good stability, considerable activity, and more importantly, tunable local structure mimicking natural enzymes [5–8]. These virtues benefit the application of single atom catalysts in cancer therapies such as chemodynamic therapy, photodynamic therapy, sonodynamic therapy, and parallel catalytic therapy. In most of the reported cases, single atom catalysts interact with the tumor microenvironment, turning the unbalanced oxygen species into reactive ones as “Trojan horses” to attack the lesions. For example, Shi et al. reported the PEGylated single-atom Fe-containing nanocatalysts that could trigger in situ Fenton reactions under the acidic tumor microenvironment [9]. Such chemodynamic therapy facilitated the suppression of 4T1 mammary carcinoma cells. Zhou et al. proposed a metal-organic framework rich in porphyrin-like single atom Fe(Ⅲ) centers, which displayed good performance in photodynamic and photothermal therapy for the treatment of HeLa cell tumors [10]. Despite the pathway of reactive oxygen species (ROS), there are still many remaining biochemical progress during the correlation between single atom catalysts and tumor microenvironment to be explored.
The intimate relationships between autophagy and tumor therapy reported by many studies recently may offer new options for cancer treatment. On one hand, autophagy could mediate oxidative stress, maintain genomic stability, reduce dysfunctional proteins, and thus inhibit tumor development. Several compounds were found to upregulate autophagy and exert therapeutic effects against RCC: ubenimex [11], silibinin [12], resveratrol [13], (S)-goniothalamin [14], sinomenine [15], etc. On the other hand, the autophagic flux of RCC cells would be stimulated during chemotherapy. The assistance of autophagy inhibitors (e.g. chloroquine [16], 3-methyladenine [17]) at this stage leads to better efficacy in controlling RCC progression. No matter which role autophagy displays, its clinical significance for RCC diagnostics and treatment has attracted great interest.
Graphene oxide (GO) is a competent candidate in cancer therapy prized for its large surface area, multiple payload capability, and excellent biocompatibility. Although the anticancer effect of GO was primarily ascribed to the catalytic production of ROS [18,19], autophagy regulated by GO as a vital therapy target has also been noticed. Chen et al. demonstrated that GO could initiate autophagy in CT26 colon cancer cells and suppress tumor progression [20]. Further investigation revealed the role of GO as a chemosensitizer that diverted the autophagic flux and enhanced cisplatin import for CT26 cell killing [21]. Yang’s group evaluated the toxicity and underlying mechanisms of GO on osteosarcoma cancer cell lines [22]. ROS generation and the subsequent apoptosis pathway were easily triggered by GO in the K7M2 osteosarcoma cells, whereas the production of ROS was restrained in the MG-63 osteoblastic cells, and the autophagy mechanism dominated instead. These reports highlighted the multifunctionality of GO in anticancer therapies. Exploring the contribution of GO in RCC treatment, which has not been well-discussed, would complement the traditional RCC therapeutic regimens and raise the survival rate.
In the present work, Fe single atoms were constructed on GO nanosheets (Fe1-GO) as an RCC nanomedicine. The microstructure of Fe1-GO, as well as its therapeutic effect on RCC treatment, were systematically studied. The formation of isolated O−Fe1−O coordination was confirmed through aberration-corrected high-angle annular dark-field scanning transmission electron microscopy (HAADF-STEM) and synchrotron radiation X-ray absorption structure (XAS) characterization. In vitro experiments verified the enhanced suppression of ACHN human renal cancer cells by Fe1-GO and the tolerable cytotoxicity of the normal podocyte and HK2 human renal proximal tubule cells. Mechanistic analyses pointed out an autophagy pathway rather than the generally acknowledged catalytic ROS generation route. RCC-bearing BALB/c mice model further suggested the good therapeutic effect of Fe1-GO nanomedicine, accomplishing an 89% reduction of tumor weight while exhibiting favorable biosafety. This work highlighted the role of Fe1-GO nanomedicine as an autophagy regulator and opened up new strategies for cancer treatment.
Fe single atoms were decorated over the commercial GO nanosheets through a facile impregnation method. Elemental analysis of the as-prepared Fe1-GO nanosheets revealed a Fe loading amount of 3.7 wt%. The dispersion of Fe species was determined by X-ray diffraction (XRD) and electron microscopy techniques. No additional peak emerged in the XRD patterns (Fig. S1 in Supporting information), which indicated the absence of Fe metal or its compounds. Coinciding with the XRD results, no Fe-containing nanoparticles were found in the transmission electron microscopy (TEM) images (Fig. S2 in Supporting information), implying that the Fe species were highly dispersed. Aberration-corrected HAADF-STEM characterization was then carried out to obtain information under atomic scale (Fig. 1a). A considerable amount of Fe single atoms were observed anchoring on the GO substrate without any clusters presented in the vicinity. The results above demonstrated the successful deposition of Fe single atoms.
Figure 1
Figure 1.
(a) Aberration-corrected HAADF-STEM image of Fe1-GO; (b) Fe 2p XPS spectrum of Fe1-GO; (c) Fe K-edge XANES spectra, (d) k3-weighted EXAFS spectra in k space, and (e) k3-weighted FT-EXAFS spectra in R space of Fe1-GO and the reference samples (Fe foil, FeO, and Fe2O3); (f) EXAFS fitting curves of Fe1-GO in R space.
Having the Fe1-GO nanosheets in hand, the structure associated with Fe atoms was investigated thereafter. In the Fourier-transform infrared spectroscopy (FTIR) spectra (Fig. S3 in Supporting information), the vibrations assigned to O−H, C−O, C=C, C−OH, C−O epoxy, and C−O alkoxy groups were well-defined over the GO nanosheets [23,24]. After the decoration of Fe single atoms, the bands located at 1729 cm−1 (C=O) and 1220 cm−1 (C−O epoxy) went down, while that at 1400 cm−1 (C−OH) raised, suggesting the interaction between Fe atoms and oxygen-containing functional groups. In the Raman spectra (Fig. S4 in Supporting information), typical D and G bands corresponding to lattice disorder and in-plane stretching were observed. The intensity ratio (ID/IG) increased a little after the decoration of Fe single atoms, which was ascribed to the distortion of the GO network during the loading. X-ray photoelectron spectroscopy (XPS) analysis was also conducted to study the chemical compositions. The Fe 2p XPS spectrum of Fe1-GO was depicted in Fig. 1b, which could be resolved into doublet peaks of FeⅡ, FeⅢ species, and the satellite signal, indicating the mixed-valence state of Fe single atoms as well as the electron transfer during Fe−O coordination. Moreover, Fe−O bonding was further validated in the O 1s XPS spectra (Fig. S5a in Supporting information), and the decreased binding energy of the peak representing C−O linkage also supported the conjecture. The C 1s XPS spectrum of GO (Fig. S5b in Supporting information) could be deconvoluted into C−C, C−O, and C=O signals. After Fe loading, the binding energy of C=O strengthened from 288.6 eV to 288.8 eV, whereas that of C−O weakened from 287.0 eV to 286.8 eV, confirming the Fe−O interaction.
Synchrotron radiation XAS characterization was subsequently performed to unravel the electronic structure and local coordination environment. For the Fe K-edge X-ray absorption near-edge structure (XANES) spectra (Fig. 1c), the absorption threshold position of Fe1-GO was located between FeO and Fe2O3, implying the average oxidation state of Fe single atoms was between +2 and +3, which was consistent with the XPS result. Figs. 1d and e display the k3-weighted extended X-ray absorption fine structure (EXAFS) spectra and its Fourier transform (FT). The peak centered at 1.55 Å was close to the scattering of Fe−O coordination in Fe2O3 (1.48 Å), demonstrating the presence of Fe−O interaction in Fe1-GO. No Fe−Fe signal (2.21 Å) was detected, also verifying that the Fe species predominantly existed as isolated atoms. The EXAFS fitting curves and quantitative structural parameters of Fe1-GO were shown in Fig. 1f and Table S1 (Supporting information). The average coordination number of Fe single atoms was deduced to be 2.0, suggesting an O−Fe1−O configuration.
Since the isolated and mixed-valence Fe atoms were successfully decorated onto GO nanosheets as O−Fe1−O active sites, its capability in RCC treatment was explored. All the in vitro and in vivo experiments were carried out in accordance with the Regulations of Experimental Animal Administration issued by the State Committee of Science and Technology of the People’s Republic of China, with the approval of the Ethics Committee in Jinan university (Ethical Inspection Approval Office with No. 2018-048). PEGylation was conducted to ensure bioconjugation. After modification, new bands were found in the FTIR characterization (Fig. S6 in Supporting information): stretching vibration of C−O−C at 1110 cm−1, stretching vibration of C−H at 1430 cm−1, and bending vibration of N−H at 1655 cm−1, validating the coupling between the nanosheets and the PEG moiety [25,26]. In addition, the Zeta potential of the PEGylated Fe1-GO nanosheets and the unmodified ones (Fig. S7 in Supporting information) were measured to be −18.8 mV and −31.8 mV, respectively, which further confirmed the chemical bonding during PEGylation.
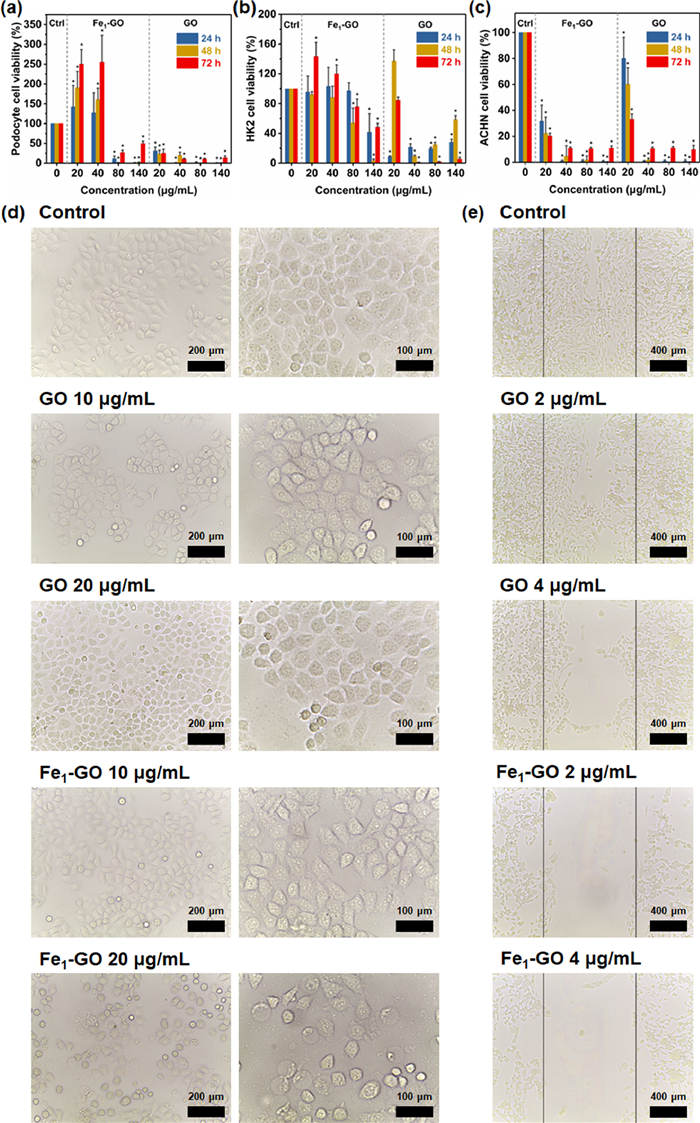
The biocompatibility of the PEGylated samples on podocytes, HK2, and ACHN cells was then assessed. When co-cultured with normal cells (i.e., podocytes and HK2 cells), Fe1-GO revealed limited cytotoxicity at the concentration below 80 µg/mL and even stimulated cell proliferation under low dosage (Figs. 2a and b). Notably, the incubation of 20 µg/mL GO with podocytes as well as HK2 cells was poisonous, validating that Fe decoration could ameliorate the biocompatibility of GO. For ACHN cells, both GO and Fe1-GO displayed remarkable and gradually strengthened toxicity, in which the effect of Fe1-GO outperformed (Fig. 2c).
Figure 2
Figure 2.
Cytotoxicity of Fe1-GO and GO nanosheets on podocyte (a), HK2 (b), and ACHN (c) cells; Effects of GO and Fe1-GO nanosheets on morphology (d), proliferation and migration (e) of ACHN cells (*P < 0.05).
The evolution of ACHN cells was subsequently recorded under the optical microscope (Fig. 2d). In comparison with the untreated ACHN cells that were characterized by the polygonal shape, irregular nucleus, and prominent nucleolus, it became progressively swollen and deformed along with the introduction of GO and Fe1-GO. Nucleus rupture and cytoplasmic dissolution would even occur as the concentration of Fe1-GO reached 20 µg/mL. Cell scratch assay was also conducted to estimate the migration and invasion of ACHN cells in the presence of GO nanomedicines (Fig. 2e). The cells in the control group migrated and almost filled the wound by 48 h. The addition of GO slowed the healing process down. In contrast, the ACHN cells exposed to Fe1-GO displayed remarkably suppressed invasive ability, and the wound tended to expand, suggesting a stronger capability of Fe1-GO than that of GO in inhibiting and killing RCC.
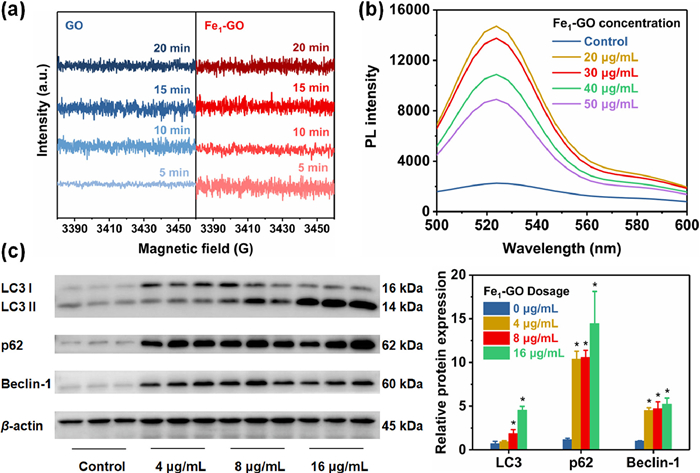
Focusing on the inhibition of ACHN cells over Fe1-GO nanosheets, several analyses were carried out to explore the mechanism of this nanomedicine. The pathway of catalytic ROS generation was checked at first. Electron spin resonance (ESR) results (Fig. 3a) displayed the response of GO or Fe1-GO nanomedicine toward the simulated tumor microenvironment. To our surprise, under the H2O2 level of 100 µmol/L, the sustained production of ROS over GO or Fe1-GO nanosheets was unfavored. Dichlorodihydrofluorescein diacetate (DCFH-DA) was further selected as an intracellular probe to detect in vitro ROS generation in ACHN cells. As shown in Fig. 3b and Fig. S8 (Supporting information), although the ROS level in ACHN cells was elevated, it was irrelevant to the concentration of Fe1-GO or GO nanomedicines, indicating that the function of Fe1-GO for ACHN inhibition was not catalytic ROS generation. Besides, malondialdehyde, the product of lipid peroxidation via the ROS pathway, was also detected but negligible. This result ruled out the possibility of ferroptosis induced by the nanomedicine. Interestingly, when the attention was turned to the extracted proteins from the treated ACHN cells, it was found that the expression of LC3, p62, and Beclin-1 increased considerably, implying that autophagy in ACHN cells was upregulated by Fe1-GO nanosheets (Fig. 3c). Therefore, Fe1-GO nanomedicine served as an autophagy inducer in RCC treatment instead of the commonly known Fenton chemistry accelerator.
Figure 3
Figure 3.
(a) ESR spectra for ROS generation over GO and Fe1-GO nanosheets; (b) In vitro ROS generation over Fe1-GO nanosheets in ACHN cells by DCFH-DA probe; (c) Effects of Fe1-GO nanosheets on autophagy in ACHN cells (*P < 0.05).
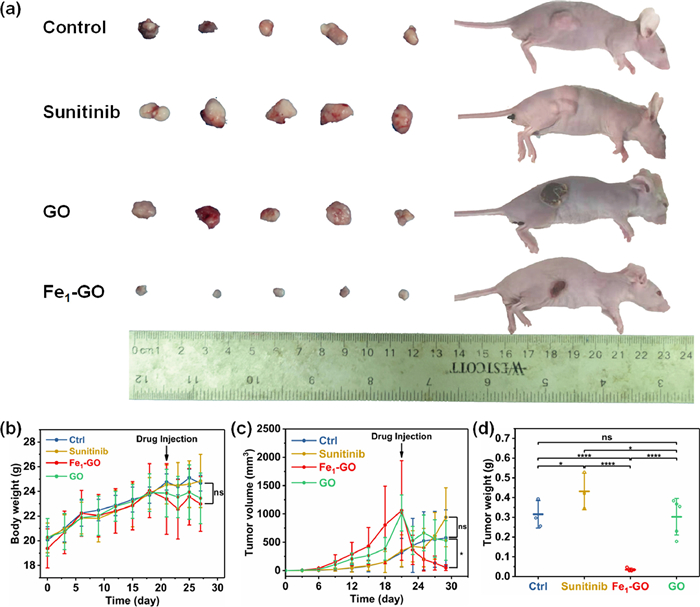
RCC-bearing BALB/c mice model was further established to verify the therapeutic effect of Fe1-GO in vivo. The changes in body weight, tumor volume, and tumor weight were collected (Fig. 4). It could be obtained that the body weight in all the groups increased after the therapy, reflecting that the treatment of sunitinib, GO as well as Fe1-GO resulted in a negligible effect on the health of the RCC-bearing mice. It was worth noting that, although the tumor growth rate in the sunitinib group was more pronounced than that in other groups, histopathological sections revealed lower cell proliferation activity and more obvious cell apoptosis compared with the control group (Fig. S9 in Supporting information). Thus, this phenomenon was attributed to pseudoprogression [27]. Besides, contrary to the traditional sunitinib therapy that was yet to show a notable curative effect in such a short stage, the growth of tumor size was expressly prohibited in the groups treated with the nanomedicines, the most distinguished of which was Fe1-GO that manifested an 89% reduction of the tumor weight. Meanwhile, the lowest Ki-67 expression attained from the Fe1-GO group in the immunohistochemical analysis again validated the result above (Fig. S9a). Terminal deoxynucleotidyl transferase dUTP nick end labeling (TUNEL) assays were also applied to detect apoptosis of the RCC cells in vivo (Fig. S9b). Widespread apoptotic tumor cells filling with brown staining were observed in the tumor tissue from the Fe1-GO group, providing another evidence for the positive therapeutic effect of Fe1-GO nanomedicine. The satisfactory outcome of Fe1-GO nanosheets encouraged the basic assessment of its biosafety. The physiological conditions and diet of mice remained stable during the experimental period. Blood samples were also collected when the mice were sacrificed to detect liver and kidney damage (Fig. S10 in Supporting information). The levels of biochemical indexes in the serum did not show a significant difference between groups, indicating the maintained liver and kidney function. Hence, the biosafety of Fe1-GO nanomedicine was acceptable in RCC treatment.
Figure 4
Figure 4.In vivo therapeutic effect of GO and Fe1-GO nanosheets. (a) Photographs of the RCC-bearing BALB/c mice and the dissected tumors by the end of the treatment; (b) The evolvement curves of body weight; (c) The evolvement curves of tumor volume; (d) Final tumor weight by the end of the treatment (*P < 0.05, ****P < 0.0001).
Taken together, Fe1-GO was developed as an efficient nanomedicine for RCC treatment. With the isolated O−Fe1−O active sites, the cytotoxicity of Fe1-GO nanosheets upon ACHN cells was enhanced, whereas that upon the normal podocytes and HK2 cells was weakened and tolerable. Further investigation revealed that autophagy instead of the commonly known catalytic ROS generation contributed to the inhibition of ACHN cells. Fe1-GO nanomedicine also displayed a good therapeutic effect on the treatment of RCC-bearing BALB/c mice, achieving an 89% reduction of tumor weight and good biosafety. The role of Fe1-GO nanosheets as an autophagy inducer rather than a ROS generation catalyst in RCC treatment opened up new directions for the application of nanomaterials and also laid a foundation for the development of potential autophagy-related cancer therapies.
Declaration of competing interest
The authors declare no conflict of interest.
Acknowledgments
This work was supported by the National Natural Science Foundation of China (Nos. 52202240, 82270756 and 82000686), the China Postdoctoral Science Foundation (No. 2021M701409), the Natural Science Foundation of Guangdong, China (No. 2018A030313527), the Basic and Applied Basic Research Foundation of Guangdong Province, China (No. 2019A1515010176), the Science and Technology Project of Guangzhou, China (No. 202102010133), and the Science and Technology Project of Shenzhen, China (No. JCYJ20190808095615389).
The graphical abstract was partly generated using Servier Medical Art, provided by Servier, licensed under a Creative Commons Attribution 3.0 unsupported license.
Supplementary materials
Supplementary material associated with this article can be found, in the online version, at doi:10.1016/j.cclet.2023.109056.
Z. Tang, L. Zhao, Z. Yang, et al., Int. J. Nanomed. 13 (2018) 2907–2919. doi: 10.2147/IJN.S159388
[23]
R. Al-Gaashani, A. Najjar, Y. Zakaria, S. Mansour, M. Atieh, Ceram. Int. 45 (2019) 14439–14448. doi: 10.1016/j.ceramint.2019.04.165
[24]
Y. Qu, L. Wang, Z. Li, et al., Adv. Mater. 31 (2019) 1904496. doi: 10.1002/adma.201904496
[25]
S. Ruan, J. Wan, Y. Fu, et al., Bioconjugate Chem. 25 (2014) 1061–1068. doi: 10.1021/bc5001627
[26]
M. Georgieva, Z. Gospodinova, M. Keremidarska-Markova, et al., Pharmaceutics 13 (2021) 424. doi: 10.3390/pharmaceutics13030424
[27]
P.J. Kelly, S.E. Weiss, D.J. Sher, et al., J. Clin. Oncol. 28 (2010) 433–435. doi: 10.1200/JCO.2009.26.8193
Figure 1
(a) Aberration-corrected HAADF-STEM image of Fe1-GO; (b) Fe 2p XPS spectrum of Fe1-GO; (c) Fe K-edge XANES spectra, (d) k3-weighted EXAFS spectra in k space, and (e) k3-weighted FT-EXAFS spectra in R space of Fe1-GO and the reference samples (Fe foil, FeO, and Fe2O3); (f) EXAFS fitting curves of Fe1-GO in R space.
Figure 2
Cytotoxicity of Fe1-GO and GO nanosheets on podocyte (a), HK2 (b), and ACHN (c) cells; Effects of GO and Fe1-GO nanosheets on morphology (d), proliferation and migration (e) of ACHN cells (*P < 0.05).
Figure 3
(a) ESR spectra for ROS generation over GO and Fe1-GO nanosheets; (b) In vitro ROS generation over Fe1-GO nanosheets in ACHN cells by DCFH-DA probe; (c) Effects of Fe1-GO nanosheets on autophagy in ACHN cells (*P < 0.05).
Figure 4In vivo therapeutic effect of GO and Fe1-GO nanosheets. (a) Photographs of the RCC-bearing BALB/c mice and the dissected tumors by the end of the treatment; (b) The evolvement curves of body weight; (c) The evolvement curves of tumor volume; (d) Final tumor weight by the end of the treatment (*P < 0.05, ****P < 0.0001).


 DownLoad:

 下载:
下载:


