
Figure 1.
(a) Digital photo of the precursor powder, ((b), (c)) TEM images of Ni-MoO3 and ((d), (e)) TEM images of Ni-MoO3-T (the inset (in Figure 1(d)) shows its particle size distribution)

Alkali-induced self-assembly Pd/Ni-Mo2C nanocatalyst for ethanol electro-oxidation
Feng-ming ZHAO , Shi-zhong WU , Zhao-yang CHEN , You-qun CHU , Mei-qin SHI


Direct ethanol fuel cell (DEFC) has been recognized as a promising and efficient power source due to advantages including environmental aspects, facile storage and high power density[1]. However, the lack of active and durable catalysts for ethanol electro-oxidation reaction (EOR, anodic reaction of DEFC) has greatly limited the large-scale commercialization of the DEFC. The most efficient catalyst for EOR is the noble metal catalyst, such as platinum (Pt) and palladium (Pd)[2-4]. Compared with Pt-based catalysts, Pd is more efficient for EOR in alkaline conditions due to its relatively high catalytic activity and lower cost[5]. A number of particle size control strategies have been undertaken by the researchers in order to increase the active sites of Pd[6, 7] to further enhance the catalyst activity, stability and utilization.
Transition metal carbides (WC, Mo2C, etc.) are of particular interest as electrocatalysts for “platinum-like” electronic and catalytic properties[8, 9]. They are potential candidates as functional support for Pd catalyst due to their high electrical conductivity and CO poisoning resistance[10]. Mo2C has been widely used in electro-catalysis reactions and shows possible application for EOR[11, 12]. Nano-sized Mo2C-supported Pd can be an expectant catalyst as EOR catalysts in alkaline condition for their bi-functional activity and synergetic effect. However, carbide materials displayed self-aggregation and low porosity for the high carburization temperature[13, 14], which presented difficulties for the synthesis of Pd/Mo2C nano composites. Thus, new functional Pd/Mo2C catalysts with properly synthesis method and composite strategy still need to be developed[15-17]. Metal assisted method is an effective way to produce multiple phases[18-20], which could be used and improved as the Mo2C aggregation resistant and Pd introducing strategy.
Herein, a self-assembly and medium inducing strategy for the synthesis of well dispersal Pd/Mo2C catalyst (2-6nm) was reported. Nickel was in-situ inserted into Mo2C nanoparticles to improve support properties and restrain aggregation. A Pd/Ni-Mo2C composite catalyst wherein Pd was dispersed and fixed on the surface of Mo2C was produced after facile carburization and moderate replacement processes. This superfine nano catalyst provided a stable and continuing EOR activity in alkaline condition. The EOR activity was substantially enhanced to 2832.2mA/mgPd, which was 2.6 times compared with that of commercial 10% Pd/C (1107.6mA/mgPd).
1.5 g nickel sulfate, 5 g ammonium molybdate and 20 mL deionized water were added into the beaker followed vigorous stirring for 30 min and then kept them still for crystal growth. After 24 h, the precipitations were collected, dried and ground into powders. Finally, the powders were put into the quartz boat and calcined in the muffle furnace at 600 ℃ for 2 h.
The calcined powders were put into 0.7 mol/L NaOH solutions with magnetic stirring for 20 min. After centrifugal separation, they were washed and dried at 50 ℃. The dried powders were put into the quartz boat and underwent the gas-solid reaction in an atmosphere of CO (100 mL/min). The temperature was increased to 900 ℃ maintained for 3 h and then naturally cooled to the room temperature. After carburization, 50 mg as-obtained sample was added into 8.4 mL palladium chloride solution (5 mmol/L, containing 5 mg Pd, the Pd loading rate of the sample was 10%) couple with ultrasonic treatment for 30 min. After that, they were put into the 50 ℃ thermotank for 12 h (ICP-MS test of the Pd2+ concentration in the replaced solution exhibited trace Pd2+ residual). Finally, the sample Pd/Ni-Mo2C-T was prepared after washed with deionized water and alcohol for three times, respectively.
The phase purity and crystallinity of the samples were measured using SCINTAGX'TRA X-ray diffraction analyser (PANalytical Netherlands) at room temperature and using Cu Kα radiation source (λ=0.1541 nm) with a voltage of 45 kV and current of 40 mA. X-ray diffraction (XRD) patterns were recorded with a step size of 0.04° from 10° to 80° at a speed of 2.4(°)/min. The morphology of the sample was characterized using a Hitachi S-4700 scanning electron microscope (SEM). TEM and high-resolution TEM were characterized using a Tecnai G2 F30 S-Twin microscope (FEI, Netherlands) at a voltage of 200 kV and a current of 103 mA coupled with energy dispersive X-ray spectrometer (EDX, Thermo NORAN VANSTAGE ESI). The thermogravimetric analysis (TGA) was performed on Pyris diamond thermoanalyser.
Electrochemical measurements were carried out using a CHI660C electrochemical station. And a standard three-electrode setup with Ag/AgCl electrode and Pt foil as the reference and counter electrode, respectively. For working electrode fabrication, the catalysts (2 mg) were dispersed in a mixture solution of ethanol (175 μL) and Nafion solution (25 μL) under ultrasonic treatment for 30 min. Afterwards, 5 μL of the catalyst ink was loaded onto a glassy carbon electrode (3 mm in diameter). Besides linear sweep voltammetry (LSV), all the electro-chemistry experiments were carried out at 30 ℃. Chronoamperometry (CA) test of the samples used Hg/HgO electrode as reference electrode.
The morphology of original precursor powder is shown in Figure 1(a). The particle size of powder is about 10-20 μm or even much larger. After oxidation process, NH3 and H2O are removed to form Ni-MoO3 and the particle size of precursor is decreased to several hundred nanometres with rough surface (Figure 1(b), TEM image).
It can be seen that the particles are irregularly assembled by the MoO3 and NiO nano powders (Figure 1(c), HRTEM image). After alkali treatment, the particles exhibit significant differences and many fine pores appear as shown in Figure 1(d). The BET surface area of Ni-MoO3-T is 22.10 m2/g, which is much higher than Ni-MoO3 sample (6.24 m2/g) and most pores are created in the size of 2-15 nm (details see Figure 2). The reason for minimizing particle size of Ni-MoO3-T is that MoO3 is partially dissolved in NaOH solution, which results in a series of corrosion sites. The size of Ni-MoO3-T decreases to 20 nm (centred, inset in Figure 1(d)). This is described as the first structural collapse by the controllable alkali treatment used. The result made the surface of MoO3 and NiO more exposed so that in the carburization process the carbon atoms could more easily enter into the MoO3 matrix to form Mo2C. Simultaneously, MoO3 and NiO are clear about boundaries in this process (Figure 1(e), HRTEM image), which is much helpful for the mutual integration in the next temperature programed process to resist the aggregation of Mo2C.

After the carburization process was finished, MoO3 was transformed into Mo2C. SEM images (Figure 3(a)-3(c)) illustrates the morphology evolution of Ni-Mo2C and Ni-Mo2C-T. The pure Mo2C was also synthesised in the same carburization condition. The pure Mo2C shows smooth surface and large particle size (see Figure 3(a)). The particle size of Ni-Mo2C, Ni-Mo2C-T is obviously much smaller. It demonstrated that the incorporation of metal nickel reduced the particle size of Mo2C and restrained aggregation[21]. Moreover, compared to Ni-Mo2C, the Ni-Mo2C-T exhibited more uniform particle size distribution. According to PDF card (JCPDS: 00—011—0680), the peaks at 34.5°, 38.0° and 39.6° correspond to the crystal planes of Mo2C (100), (002) and (101), respectively (see Figure 3(d)). It could be confirmed that nickel ion was reduced to Ni and doped into the Mo2C successfully by the diffractions of nickel (111), (200) and (220) plane at 44.4°, 51.6° and 76.1°, respectively. TG curves of different Mo2C catalysts are tested to reveal the temperature range of the phase transition (see Figure 3(e)). There is a significant weight gain corresponding to the formation of MoO3, which starts from 300.2 ℃ and ends at 441.1, 476.1, 585.6 ℃ for pure Mo2C, Ni-Mo2C catalyst and Ni-Mo2C-T catalyst, respectively. After that, there is a sharp decrease for pure Mo2C and Ni-Mo2C catalyst, which is attributed to the sublimation of MoO3[22]. However, the Ni-Mo2C-T catalyst shows a slight weight gain until 734.3 ℃, and then it decreases. This phenomenon suggested that the sublimation temperature of MoO3 could be increased by the addition of nickel, and alkali treatment exhibited more significant influence of that. In fact, during the carburization process, the high temperature would lead to the sublimation of MoO3, which could block the formed micro/mesoporous pores, resulting in less active sites and lower catalytic activity of the prepared catalyst. Therefore, the increase of MoO3 sublimation temperature was of great importance to retain porous structure and improve catalytic activity.

The N2 adsorption-desorption isotherms and corresponding pore-size distribution of the samples are further inspected (Figure 3(f), 3(g)). BET analysis showd that the specific surface area of the sample with and without alkali treatment is 24.37 and 27.39 m2/g, respectively, while it is 9.81 m2/g for the pure one. In the pore size distribution curves, it is found that the pore size of Ni-Mo2C-T catalyst is centered at 2 nm (average pore size is 4.64 nm compared with 7.07 nm of pure Mo2C and 6.46 nm of Ni-Mo2C). The interesting fact is the microporous volume of Ni doped samples (0.010734 cm3/g for Ni-Mo2C-T and 0.009303 cm3/g for Ni-Mo2C) is much higher than pure Mo2C (0.003769 cm3/g). Pores around 2 nm (mesopores and micropores) thus were created by alkali treatment. The SEM and BET test indirectly proved that Ni doped process, especially alkali treatment effectively changed the micro/mesoporous pores and particle size.
Pd/Ni-Mo2C-T was then prepared through a replacement process. Before and after the replacement reaction, the solution in orange (palladium chloride solution) was changed to blue-green (nickel chloride solution), indicating that Ni component in the sample Ni-Mo2C-T was partially replaced by Pd (Figure 4(a) inset). The particle size distribution shows that the particle size of final catalyst is 2-6 nm (Figure 4(b)), which exhibits a further reduction relative to Ni-MoO3-T. It can be described as the second structural collapse by a self-assembly way. In the carburization process, the porous nano particles broke up and recombined into smaller particles which was also assisted by the Ni component. From mapping images (showed in Figure 4(c)), it can be found that the Pd is uniformly distributed on the surface of the catalysts. In the HRTEM image (Figure 4(d)), the lattice spacing is matched with Pd (111), (200), (220) and Mo2C (110), (100) plane, respectively. The EDX analysis (Figure 4(e)) is used to testify the existence of C, Mo, Ni and Pd.

The catalytic activity for ethanol electro-oxidation is estimated by CV (shown in Figure 5(a)). There are two well-defined peaks for all of the tested catalysts. The broad peak appearing in the forward sweep at about -0.2 to -0.1 V is due to C2H5OH oxidation, while the sharp peak between -0.3 and -0.4 V in the reverse sweep comes from the oxidation of incompletely oxidized carbonaceous intermediates. The CO-like species as intermediate products can be easily oxidized by carbide-noble metal composite during the reverse sweep[23]. However, in the negative scan, the peak currents nearly stay at the same value, even if the scan rate increases several times, as shown in Figure 5(c). It also can be seen that in the forward sweep, the Ip rose with the increase of scan rate and the Ip and v1/2 exhibitsed a linear relationship (shown in Figure 5(d)). This indicates that the electrode processes of ethanol oxidation are controlled by liquid phase mass transfer process[24]. Hence, adjusting the morphology of catalyst to improve mass transfer on the catalyst particle is a good choice to improve its catalytic activity just as what we had done before. Finally, its catalytic activity is improved and the catalyst poisoning is also avoided as the intermediate products are rapidly removed.

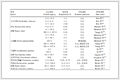
Onset potential and peak current density in the forward sweep were often used for estimating the reaction dynamic property and catalyst activity. Here, the current density was normalized with respect to the mass of Pd loading on the electrode. As shown in Table 1, the onset potential of Pd/C, Pd/Ni-Mo2C and Pd/Ni-Mo2C-T catalyst is -0.561, -0.606 and -0.628 V, respectively, and the peak current density is 1107.6, 2232.3 and 2832.2 mA/mgPd, respectively. The maximal peak current density and the minimal onset potential suggest that the Pd/Ni-Mo2C-T catalyst exhibits an excellent electrocatalytic activity and a significant enhancement of the kinetics for EOR compared to Pd/C and Pd/Ni-Mo2C catalyst. In addition to activity, stability of electro-catalyst is also an important feature for applications. As displayed (Figure 5(b)), the CA curve of Pd/Ni-Mo2C-T catalyst presents the slowest current decay over time among the tested catalysts. The residual current density of Pd/Ni-Mo2C-T catalyst after 1800 s is 447.8 mA/mgPd, which clearly overtakes those of Pd/C catalyst (96.1 mA/mgPd) and Pd/Ni-Mo2C catalyst (124.9 mA/mgPd) using Hg/HgO electrode as reference electrode. It is shown that the doping of nickel and twice structural collapse promote the tolerance and resistance of Pd and Mo2C toward the poisoning effect of intermediate species of the EOR. The excellent properties of the catalyst could attribute to the smaller particle size, uniform distribution of Pd and enhanced synergistic effect of Pd and Mo2C.
 下载:
导出CSV
| Catalyst | Onset potential /V | Peak current /(mA·mg-1 Pd) | Residual current /(mA·mg-1 Pd) |
| 10%Pd/C | -0.561 | 1107.6 | 96.1 |
| Pd/Ni-Mo2C | -0.606 | 2232.3 | 124.9 |
| Pd/Ni-Mo2C-T | -0.628 | 2832.2 | 447.8 |
The activation energy of the catalyst showed its ability to catalyse a reaction. According to Arrhenius′ theorem, the activation energy of the electro-catalyst related to the temperature and current density, which could be written as:
|
$ \lg i = {\rm{B}} - {E_{\rm{a}}}/2.303RT $ |
(1) |
where i is current density, Ea is the activation energy, R is the gas constant and T is the absolute temperature.
For the same electrode reaction, if the reactant concentration is identical, B is a constant number. lgi and 1/T exhibited a linear relationship, and its slope is -Ea/(2.303R)[25]. Thus, The activation energy Ea can be estimated based on the slope by the function Ea=-2.303 R(lgi/(1/T)). To get the information, the LSV curves of catalysts at different temperatures are tested (shown in Figure 6(a), 6(c)). It can be seen that the temperature has a remarkable influence on the electro-catalytic activity of the catalysts, and the ethanol oxidation rate of the catalysts increases significantly with the rise of temperature.

According to LSV curves, the activation energy of the samples at -0.15 V can be calculated as 35.92 kJ/mol for Pd/Ni-Mo2C catalyst and 24.94 kJ/mol for Pd/Ni-Mo2C-T catalyst. A much lower activation energy of Pd/Ni-Mo2C-T catalyst suggested that the alkali treatment changed the nature and morphology of molybdenum carbide and made it easier to catalyse the electro-oxidation of ethanol.
In summary, a facile strategy to synthesis efficient Pd/Ni-Mo2C catalyst through twice structural collapse was reported. Mo2C nano particles (2-6 nm) as the support were successfully prepared. Pd was fixed on the surface of Mo2C by a following replacement process. The catalyst exhibited excellent activity and durability properties for EOR. The current density of Pd/Ni-Mo2C-T catalyst was 2832.2 mA/mgPd, which was 2.6 times higher than Pd/C catalyst (1107.6 mA/mgPd). After 1800 s durability test, its residual current density was still 447.8 mA/mgPd (Pd/C, 96.1 mA/mgPd). The superior performance of Pd/Ni-Mo2C-T catalyst could attribute to the smaller particle size, uniform distribution of Pd and Ni mediated synergistic effect of Pd and Mo2C. This research offered a self-assembly viewpoint to improve the catalytic activity and durability by minimizing the particle size and increasing binding force between active sites and functional support in multicomponent nanocatalysts.
WU T, MA Y, QU Z B, FAN J C, LI Q X, SHI P H, XU Q J, MIN Y L. Black phosphorus-graphene heterostructure-supported Pd nanoparticles with superior activity and stability for ethanol electro-oxidation[J]. ACS Appl Mater Interf, 2019, 11: 5136-5145. doi: 10.1021/acsami.8b20240
ZHANG H C, SHANG Y Y, ZHAO J, WANG J J. Enhanced electrocatalytic activity of ethanol oxidation reaction on palladium-silver nanoparticles via removable surface ligands[J]. ACS Appl Mater Interf, 2017, 9(19): 16635-16643. doi: 10.1021/acsami.7b01874
YANG H L, ZHANG X Y, ZOU H, YU Z N, LI S W, SUN J H, CHEN S D, JIN J, MA J T. Palladium nanoparticles anchored on three-dimensional nitrogen-doped carbon nanotubes as a robust electrocatalyst for ethanol oxidation[J]. ACS Sustainable Chem Eng, 2018, 6(6): 7918-7923. doi: 10.1021/acssuschemeng.8b01157
MARTIN R, JAKUB D, BJOÖRN R, FINN R, DAVID A H, FRANCESCO C, ROBERTO F, JOCHIM S, OLAF M M. Structural reorganization of Pt(111) electrodes by electrochemical oxidation and reduction[J]. J Am Chem Soc, 2017, 139(12): 4532-4539. doi: 10.1021/jacs.7b01039
MOHAMMAD S A, SEUNGWON J. Electrochemical activity evaluation of chemically damaged carbon nanotube with palladium nanoparticles for ethanol oxidation[J]. J Power Sources, 2015, 282: 479-488. doi: 10.1016/j.jpowsour.2015.02.072
LEANDRO L C, FLAVIO C, AURO A T. Nickel palladium electrocatalysts for methanol, ethanol, and glycerol oxidation reactions[J]. Int J Hydrogen Energy, 2017, 42: 16118-16126. doi: 10.1016/j.ijhydene.2017.05.124
RAJESH K, RALUCA S, RAJESH K S, EDNAN J, DINESH P S, VIDHU S T, ALFREDO R V, EVERSON T S G da S, JAQUELINE R M, LAURO T K, STANISLAV A M. Controlled density of defects assisted perforated structure in reduced graphene oxide nanosheets-palladium hybrids for enhanced ethanol electro-oxidation[J]. Carbon, 2017, 117: 137-146. doi: 10.1016/j.carbon.2017.02.065
LEVY R B, BOUDART M. Platinum-like behavior of tungsten carbide in surface catalysis[J]. Science, 1973, 181(4099): 547-549. doi: 10.1126/science.181.4099.547
LIU Y, THOMAS G K, JINGGUANG G C, WILLIAM E M. Metal carbides as alternative electrocatalyst supports[J]. ACS Catal, 2013, 3: 1184-1194. doi: 10.1021/cs4001249
AKHAIRI M A F, KAMARUDIN S K. Catalysts in direct ethanol fuel cell (DEFC):An overview[J]. Int J Hydrogen Energy, 2016, 41: 4214-4228. doi: 10.1016/j.ijhydene.2015.12.145
WANG H, SUN C, CAO Y J, ZHU J T, CHEN Y, GUO J, ZHAO J, SUN Y H, ZOU G F. Molybdenum carbide nanoparticles embedded in nitrogen-doped porous carbon nanofibers as a dual catalyst for hydrogen evolution and oxygen reduction reactions[J]. Carbon, 2017, 114: 628-634. doi: 10.1016/j.carbon.2016.12.081
LIN L L, SHENG W C, YAO S Y, MA D, JINGGUANG G C. Pt/Mo2C/C-cp as a highly active and stable catalyst for ethanol electrooxidation[J]. J Power Sources, 2017, 345: 182-189. doi: 10.1016/j.jpowsour.2017.02.001
WAN C, YAGYA N R, BRIAN M L. Multiple phases of molybdenum carbide as electrocatalysts for the hydrogen evolution reaction[J]. Angew Chem Int Ed, 2014, 53(25): 6407-6410. doi: 10.1002/anie.201402998
JAEHO J, YEREUM P, SEUNGHYUK C, JINHEE L, SUNG S L, BYOUNG H L, YOUNG J S, JEONG H C, YUN H J, SUNGJOO L. Epitaxial synthesis of molybdenum carbide and formation of a Mo2C/MoS2 hybrid structure via chemical conversion of molybdenum disulfide[J]. ACS Nano, 2018, 12(1): 338-346. doi: 10.1021/acsnano.7b06417
ZHONG Z W, LIU N, CHEN H Y, FU X H, YANG L C, GAO Q S. Molybdenum carbide supported by N-doped carbon:Controlled synthesis and application in electrocatalytic hydrogen evolution reaction[J]. Mater Lett, 2016, 176: 101-105. doi: 10.1016/j.matlet.2016.04.089
MU Y P, ZHANG Y, FANG L, LIU L, ZHANG H J, WANG Y. Controllable synthesis of molybdenum carbide nanoparticles embedded in porous graphitized carbon matrixes as efficient electrocatalyst for hydrogen evolution reaction[J]. Electrochim Acta, 2016, 215: 357-365. doi: 10.1016/j.electacta.2016.08.104
AYAZ H, VALDECIR A P, ALEJO C, EDSON A T. Molybdenum carbide-based electrocatalysts for CO tolerance in proton exchange membrane fuel cell anodes[J]. Electrochim Acta, 2014, 142: 307-316. doi: 10.1016/j.electacta.2014.07.142
LIN H L, LIU N, SHI Z P, GUO Y L, TANG Y, GAO Q S. Cobalt-doping in molybdenum-carbide nanowires toward efficient electrocatalytic hydrogen evolution[J]. Adv Funct Mater, 2016, 26(31): 5590-5598. doi: 10.1002/adfm.v26.31
XIONG K, LI L, ZHANG L, DING W, PENG L S, WANG Y, CHEN S G, TAN S Y, WEI Z D. Ni-doped Mo2C nanowires supported on Ni foam as a binder-free electrode for enhancing the hydrogen evolution performance[J]. J Mater Chem A, 2015, 3: 1863-1867. doi: 10.1039/C4TA05686H
XU X B, FARHAT N, WANG X. Ni-Decorated molybdenum carbide hollow structure derived from carbon-coated metal-organic framework for electrocatalytic hydrogen evolution reaction[J]. Chem Mater, 2016, 28(17): 6313-6320. doi: 10.1021/acs.chemmater.6b02586
SUYLAN L A D, ANDRE L L M, CARLSON P S. Synthesis and characterization of molybdenum carbide doped with nickel[J]. Mater Chem Phys, 2018, 216: 243-249. doi: 10.1016/j.matchemphys.2018.05.074
TEODÓRA N K, DÁVID H, ALEX L A DE L, IMRE M S. Thermal decomposition of ammonium molybdates[J]. J Therm Anal Calorim, 2016, 124(2): 1013-1021. doi: 10.1007/s10973-015-5201-0
CUI G F, SHEN P K, MENG H, ZHAO J, WU G. Tungsten carbide as supports for Pt electrocatalysts with improved CO tolerance in methanol oxidation[J]. J Power Sources, 2011, 196(15): 6125-6130. doi: 10.1016/j.jpowsour.2011.03.042
MA C A, CHEN Z Y, ZHAO F M. Synthesis of ultrafine mesoporous tungsten carbide by high-energy ball milling and its electrocatalytic activity for methanol oxidation[J]. Chin J Chem, 2011, 29: 611-616. doi: 10.1002/cjoc.v29.4
XU L J, DU J J, TANG J X, ZHANG J D. Electrochemical behavior of electrodeposited Ni-Cr alloys[J]. Mater Prot, 2008, 41(2): 23-25.

Figure 1 (a) Digital photo of the precursor powder, ((b), (c)) TEM images of Ni-MoO3 and ((d), (e)) TEM images of Ni-MoO3-T (the inset (in Figure 1(d)) shows its particle size distribution)

Figure 2 (a) N2 adsorption-desorption isotherms and (b) corresponding pore-size distribution of samples

Figure 3 (a) SEM images of pure Mo2C, (b) SEM images of Ni-Mo2C, (c) SEM images of Ni-Mo2C-T, (d) XRD patterns of samples, (e) TG curves of samples, (f) N2 adsorption-desorption isotherms of samples and (g) corresponding pore-size distribution of samples

Figure 4 (a) TEM images of Pd/Ni-Mo2C-T, (b) particle size distribution of Pd/Ni-Mo2C-T, (c) elemental mapping images of Pd/Ni-Mo2C-T, (d) HRTEM images of Pd/Ni-Mo2C-T and (e) EDX analysis of Pd/Ni-Mo2C-T (the inset (in Figure 4(a)) shows the colour change of catalyst before and after loading palladium)

Figure 5 (a) Cyclic voltammograms (CV) of Pd/Ni-Mo2C, Pd/Ni-Mo2C-T and Pd/C in presence of 1 mol/L KOH and 1 mol/L C2H5OH with a scan rate of 50 mV/s at 30 ℃, (b) Chronoamperometry curves (CA) of the samples in presence of 1 mol/L KOH and 1 mol/L C2H5OH at -0.05 V for 1800 s at 30 ℃, (c) CV curves of Pd/Ni-Mo2C-T catalyst in presence of 1 mol/L KOH and 1 mol/L C2H5OH with different scan rates from 100 to 500 mV/s at 30 ℃ and (d) the relation of Ip-v1/2

Figure 6 (a) LSV curves of Pd/Ni-Mo2C catalyst in presence of 1 mol/L KOH and 1 mol/L C2H5OH at 298-313 K, (b) the relationship of lgi-1/T for Pd/Ni-Mo2C catalyst, (c) LSV curves of Pd/Ni-Mo2C catalyst in presence of 1 mol/L KOH and 1 mol/L C2H5OH at 298-313 K, and (d) the relationship of lgi-1/T for Pd/Ni-Mo2C-T catalyst
Table 1. Catalytic performance characteristics of different catalysts for ethanol electro-catalytic in alkaline condition
| Catalyst | Onset potential /V | Peak current /(mA·mg-1 Pd) | Residual current /(mA·mg-1 Pd) |
| 10%Pd/C | -0.561 | 1107.6 | 96.1 |
| Pd/Ni-Mo2C | -0.606 | 2232.3 | 124.9 |
| Pd/Ni-Mo2C-T | -0.628 | 2832.2 | 447.8 |
 下载: 导出CSV

 扫一扫看文章


扫一扫关注我们