Received Date:
01 November 2017 Accepted Date:
08 January 2018 Revised Date:
05 January 2018 Available Online:
22 April 2018
Abstract:
We report a simple method for fabricating all-solid-state micro-supercapacitors, utilizing laser writing technology. Porous graphene films with three-dimensional networks induced by laser from commercial polymer was acted as scaffold for loading MnO2, a typical pseudocapacitive materials. Using gel electrolyte, all-solid-state pseudocapacitive micro-supercapacitors were fabricated. Compare to traditional printing and lithography techniques produced micro-supercapacitors, the as-fabricated devices demonstrate high volumetric capacitances, good stability and low leakage current, indicating a scalable and facile approach for future energy storage devices in portable microelectronics.
Supercapacitors and batteries are considered as the most promising energy storage devices for electric vehicles and renewable energy systems [1, 2]. Among them, supercapacitors, combined with exceptionally long cycle life and high power density, afford a smart strategy [3-6]. As a burgeoning architecture, micro-supercapacitors are of significant importance expecting to couple with micro-batteries in various applications, including AC line-filtering, microelectromechanical system and portable electronics [7-11]. Although they can be fabricated using printing and lithography techniques [12-14], continued improvements in lowcost and scalability are required to realize their future commercialization. Recently, Tour et al. report a scalable approach for producing porous graphene films with three-dimensional networks from commercial polymer films using laser irradiation, and they have equipped the graphene in micro-supercapacitors systems [15-18].
Here, we combine the laser irradiation process with subsequent electroless deposition of pseudocapacitive materials for the fabrication of all-solid-state micro-supercapacitors. A CO2 laser is first used to convert the polyimide (PI) into porous graphene with interdigitated architecture, which works as conductive matrix for the deposition of pseudocapacitive materials. Manganese dioxide (MnO2) representing pseudocapacitive transition metal oxides is chose via self-limiting electroless deposition. Allsolid-state micro-supercapacitors are fabricated with the interdigitated electrodes using gel electrolyte. The fabricated devices exhibit many advantages in performance such as high capacitance, long lifetime and low leakage current.
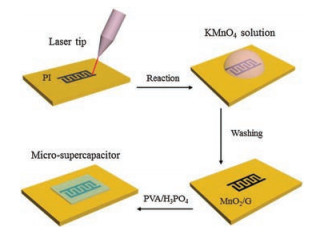
The fabrication process of the micro-supercapacitors is detailed shown in Fig. 1. In a typical experiment, graphene is obtained from CO2 laser induction and designed to form 8 in-plane interdigitated electrodes (four per polarity) on PI substrate [18]. The pseudocapacitive MnO2 is deposited on the laser-induced graphene to form MnO2/graphene (MnO2/G) composite via a self-limiting process [19-21]. Briefly speaking, the laser-induced graphene was immersed in 0.1 mol/L KMnO4 for 15 min. In a pH neutral solution, the reaction between carbon and MnO4- can be assumed to be: 4MnO4- + 3C + H2O→4MnO2 + CO32- + 2HCO3-. After cleaned by deionized water, solid-state polymer electrolyte containing poly (vinyl alcohol) (PVA)/H3PO4 is used to complete the fabrication of the devices [22]. The effective area of a micro-supercapacitor is about 6 mm2.
图 1
图 1
The process illustration of the pseudocapacitive micro-supercapacitors.
Figure 1.
The process illustration of the pseudocapacitive micro-supercapacitors.
The morphology and structural properties of the composites was characterized by scanning electron microscope (FEI Nova Nano450) equipped with an energy dispersive X-ray spectrometer, X-ray photoelectron spectroscope (XPS, ESCALAB 250) and Raman spectrometer (Renishaw inVia, 514.5 nm line of an Ar+ laser). Electrochemical measurements were performed using a workstation (CHI 660D). The volumetric capacitance is calculated by from the cyclic voltammetry (CV) curves, s is the potential scan rate, V is the volume of the micro-supercapacitor (about 6 × 10⁻⁵ cm3), and ΔU is the potential window.
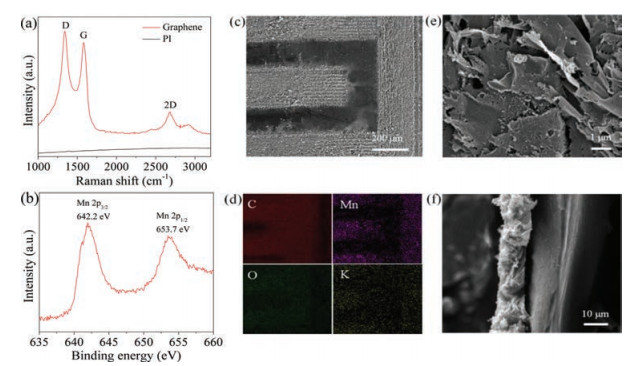
The Raman spectrum of the graphene in Fig. 2a shows three characteristic peaks for graphene-derived material: The D peak at ~1340 cm-1 induced by defects or disordered bent sites, the G peak at ~1580 cm-1 showing graphitic sp2 carbon, and the 2D peak at ~2690 cm-1 originating from second-order zone boundary phonons [16]. XPS data (Fig. 2b) showed that Mn 2p3/2 and Mn 2p1/2 peaks were located at ca. 642.2 eV and 653.7 eV, suggesting the element Mn in the sample was present in the chemical state of Mn4+ [19, 23]. Each interdigitated electrode branch is about 200 μm, according to the scanning electron microscopy (SEM) image in Fig. 2c. Energy-dispersive X-ray spectrometry (EDS) mapping analysis of elements Mn, K, C and O (shown in Fig. 2d, respectively) from the select area in Fig. 2c confirms the uniform distribution of MnO2 in the composite. In a magnified image of Fig. 2e, the composites present a nanoflake-like structure, with numerous nanopores. Fig. 2f shows the crosssectional SEM image of the MnO2/G composite, and the average thickness of the nanocomposite is about 10 μm, generally higher enough than pervious graphene-based micro-supercapacitors' electrodes [24, 25].
图 2
图 2
(a) Representative Raman spectrum of the graphene film and the starting PI film. (b) XPS spectrum of Mn 2p from the MnO2/G nanocomposites. (c) SEM image of patterned electrode. (d) EDS mapping images from the same area as in (c). (e) Magnified SEM image from (c). (f) Cross-sectional SEM image of the nanocomposites on the PI substrate.
Figure 2.
(a) Representative Raman spectrum of the graphene film and the starting PI film. (b) XPS spectrum of Mn 2p from the MnO2/G nanocomposites. (c) SEM image of patterned electrode. (d) EDS mapping images from the same area as in (c). (e) Magnified SEM image from (c). (f) Cross-sectional SEM image of the nanocomposites on the PI substrate.
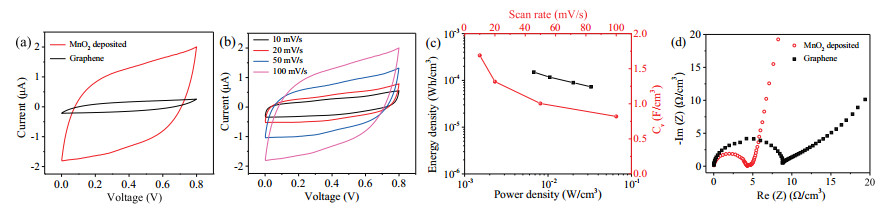
We first studied the electrochemical performance of the assembled device using CV experiments in a potential window from 0 to 0.8 V. Fig. 3a shows the CV curves of graphene and MnO2/G devices at a scan rate of 100 mV/s. Since graphene is known to contribute capacitance by the electric double layer capacitor mechanism, the MnO2/G device shows much better performance, confirming the necessity of introducing pseudocapacitive materials for designing high performance micro-supercapacitor. As shown in Fig. 3b, the MnO2/G devices demonstrate excellent pseudocapacitive behavior at scan rates ranging from 10 mV/s to 100 mV/s. The specific volumetric capacitance is derived from the CV curves (Fig. 3c). At a scan rate of 10 mV/s, the micro-supercapacitor shows a volumetric capacitance of 1.7 F/cm3, delivering an energy density of 0.15 mWh/cm3, which is comparable to previous micro-supercapacitors [26-28]. Electrochemical impedance spectroscopy (EIS) is used to characterize the ion transport properties over the frequency ranging from 10 mHz to 100 kHz at an open-circuit potential (Fig. 3d). The nearly perpendicular line with a small tangential angle shown at lowfrequency region indicates good capacitive behavior of the device. The high-frequency regime exhibits a semicircle, with charge transfer resistance no more than 5Ω/cm3, indicating the conductivity of the MnO2/graphene is even better than the pure graphene scaffold.
图 3
图 3
(a) CV curves of MnO2/G nanocomposites and pure graphene at a scan rate of 100 mV/s. (b) CV curves of MnO2/G nanocomposites as the scan rate ranging from 10 mV/s to 100 mV/s. (c) Volumetric capacitance of the micro-supercapacitor device and the Ragone plot. (d) Nyquist plot of the devices measuring from 10 mHz to 100 kHz.
Figure 3.
(a) CV curves of MnO2/G nanocomposites and pure graphene at a scan rate of 100 mV/s. (b) CV curves of MnO2/G nanocomposites as the scan rate ranging from 10 mV/s to 100 mV/s. (c) Volumetric capacitance of the micro-supercapacitor device and the Ragone plot. (d) Nyquist plot of the devices measuring from 10 mHz to 100 kHz.
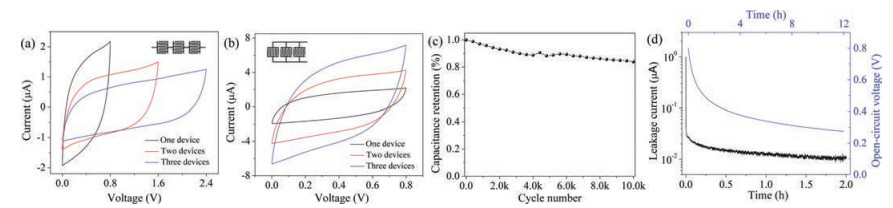
In consideration of practical application, combination of the supercapacitors is demonstrated for the purpose of increasing the operating voltage and output current. Figs. 4a and b show the CV curves of micro-supercapacitors in both series and parallel configurations. The tandem devices exhibit essentially rectangular CV curves profiles. The increase of voltage and currents in series and parallel combination, respectively, confirms them to the pure capacitor characteristics.
图 4
图 4
Electrochemical performance of micro-supercapacitors connected in (a) series and (b) parallel at scan rate of 100 mV/s. (c) Capacitance retention of the device. (d) Leakage current and self-discharge characteristics of the micro-supercapacitor.
Figure 4.
Electrochemical performance of micro-supercapacitors connected in (a) series and (b) parallel at scan rate of 100 mV/s. (c) Capacitance retention of the device. (d) Leakage current and self-discharge characteristics of the micro-supercapacitor.
Stability and reliability of the micro-supercapacitors are evaluated. These devices show stable cycling performance, retaining about 84% of initial capacitance after 10, 000 charge/discharge cycles (Fig. 4c). Other considerable factors in practical use are leakage current and self-discharge. These issues have received limited concern in the growing literatures of supercapacitors [29, 30]. It is found from Fig. 4d that the leakage current dropped significantly after 1 h (from 1μA to 10 nA). With such small leakage current, the fabricated micro-supercapacitors may be integrated with energy generators to create efficient energy monument systems. The self-discharge curves can be obtained immediately after measuring the leakage current. After charging at 0.8 V for 2 h, the open-circuit potential was recorded. After 12 h, the micro-supercapacitor still contains 0.3 V of voltage. The advantages of low self-discharge property and high power output can be satisfied for the applications of supercapacitor devices.
In summary, we have demonstrated a simple route to make allsolid-state pseudocapacitive micro-supercapacitors. The room temperature laser induction is followed by MnO2 electrodeless deposition. The solid-state micro-supercapacitors based on MnO2/G nanocomposites deliver high volumetric capacitances, promising energy density, good stability and low leakage current. The simplicity of the approach and considerable electrochemical performance hold the micro-supercapacitors promising potential for energy storage devices in portable microelectronics.
Acknowledgments
This work is financially supported by the National Natural Science Foundation of China (Nos. 51706016, 51506014), and the China Postdoctoral Science Foundation (No. 2017T100677)
[1]
B. E. Conway, Electrochemical Supercapacitors: Scientific Fundamentals and Technological Applications, Kluwer Academic/Plenum, New York, 1999.
Figure 2
(a) Representative Raman spectrum of the graphene film and the starting PI film. (b) XPS spectrum of Mn 2p from the MnO2/G nanocomposites. (c) SEM image of patterned electrode. (d) EDS mapping images from the same area as in (c). (e) Magnified SEM image from (c). (f) Cross-sectional SEM image of the nanocomposites on the PI substrate.
Figure 3
(a) CV curves of MnO2/G nanocomposites and pure graphene at a scan rate of 100 mV/s. (b) CV curves of MnO2/G nanocomposites as the scan rate ranging from 10 mV/s to 100 mV/s. (c) Volumetric capacitance of the micro-supercapacitor device and the Ragone plot. (d) Nyquist plot of the devices measuring from 10 mHz to 100 kHz.
Figure 4
Electrochemical performance of micro-supercapacitors connected in (a) series and (b) parallel at scan rate of 100 mV/s. (c) Capacitance retention of the device. (d) Leakage current and self-discharge characteristics of the micro-supercapacitor.

 下载:
下载:


 下载:
下载:


