State Key Laboratory of Bioelectronics, National Demonstration Centre for Experimental Biomedical Engineering Education, School of Biological Science and Medical Engineering, Southeast University, Nanjing 210096, China
b.
SceneRay Co., Ltd., Suzhou 215123, China
* Corresponding author. E-mail address: tingwang@seu.edu.cn (T. Wang). 1 These authors contributed equally to this work.
Received Date:
31 March 2023 Accepted Date:
26 May 2023 Revised Date:
23 May 2023 Available Online:
15 April 2024
Abstract:
In the physiological environment, nanoparticles (NPs) interact with proteins to form a protein-rich layer on the surface which is called "protein corona". Understanding and analyzing the formation process of protein corona and protein corona-nanoparticles is of great significance for biological related nano research. Many separation techniques have been used to analyze the composition of protein corona, but in situ analysis of protein corona is still absent. With the development of detection technology, sum frequency generation (SFG) is an effective instrument to analyze the surface protein structure and dynamic changes of protein corona in situ. In this work the molecular mechanism and surface structure effect of the interaction between nanoparticles with surface protein corona (S-NPP) and phospholipid membrane were studied. When S-NPP interacts with phospholipid membrane, the bond affinity network formed by the binding water can stabilize S-NPP around the lipid bilayer. In this process, S-NPP can be found wrapped in the hydration shell. This ultimately leads to a more moderate interaction between particles and phospholipid membrane.
Proteins adsorption on nanoparticles (NPs) is the first and important process in a biological environment, which will endow NPs with new biological functions and lead to major change in physical and chemical properties for the NPs [1,2]. In vivo, the NPs-cell interactions, their toxicity and biodistribution were propelled by the surface protein from the intravascular environment, which were so-called "protein corona". The changes to the structure and activity of adsorbed proteins were studied by numerous groups, the corona composition and dynamics in various biological systems were also studied [3,4]. The absorption process of protein and ionic strength on the surface will be complicated by the structural change between protein and NPs surface chemistry, as well as the medium biochemical properties.
In most cases, the protein corona will undergo a dynamic process which depends on the affinity scale, biological medium and their concentration during cell processing [5,6]. Some of the studies have shown that free water in the biological medium plays a role in shaping the protein corona, but during the process that the NPs with protein corona come close to the phospholipid membrane, free water layer around the NPs can change its surface energy. And interactions of NPs with proteins and lipid bilayers are mediated by the solvation structure [7,8]. Thus, investigating the interactions between protein corona/particles, phospholipid membrane and solvent system is critical to understand the complex effects of NPs in physiological environments.
In order to analyze the relation between NPs and lipid bilayers, many research teams conduct research by different methods, such as centrifugation. The structural and physicochemical parameters of surface protein on NPs are always determined by centrifugation [9,10]. Through centrifugation, the adsorbed proteins on NPs were separated to be free proteins in solution. Proteomics were analyzed to determine the composition of the corona. Based on the NPs separation steps, the protein coronas which weakly bound to the NPs were referred to as the "soft corona". In contrary, the corona which tightly attach on the NPs is called as "hard corona". Weber et al. reviewed different separation techniques for altering the composition of the protein corona. He has pointed out that the techniques to analyze the corona in situ are still absent, but for protein analysis, classical approaches such as separation or incubation of NPs are always be accepted [11]. But some studies have shown that the classical approach based on biological medium cannot be used to fully predict biological effects of nanomaterials in situ [12,13]. So how to detect the interaction between protein corona and NPs is imperative.
Some specific proteins on NPs in human serum can be analyzed by immunolabeling and observed by confocal laser scanning microscopy, fluorescence spectroscopy or quantified by flow cytometry [14,15]. The protein structures can be analyzed by nuclear magnetic resonance (NMR) or small angle neutron scattering [16,17]. But it is still hard to find a technology to detect the structure changing and stability mediated of protein on the surface of NPs in situ. Here we introduced an effect approach, based on sum frequency generation (SFG) to analyze the protein corona and stability that mediated by NPs in situ. To explore the surface protein corona and their effects with bio-membrane, it is not only required the technology have structural and temporal resolution, but also need to meet the requirements of time, space, in vivo and non-interactivity. The recently developed SFG vibration spectroscopy technique is one of the few techniques that can meet these requirements simultaneously [18,19]. Due to its unique surface and interfacial selectivity and monolayer sensitivity, and frequency vibration spectra have been widely used in molecular structure and dynamics characterization under various interfacial environments. The interfaces studied involve water molecules [20–25], polymers [26,27], cholesterol [28], proteins [29–31], even DNA [32,33] and so on. In addition, the SFG signal is a combination of Raman and infrared (IR) signals, and there have been many studies on the molecular structure of the interface by Raman and IR spectroscopy [34–37]. Based on our previous work on NPs with cell membrane, it was demonstrated that SFG can be used to monitor the interaction behavior of NPs with phospholipid membrane [38,39]. Thus, SFG will be an effective approach for in-situ and real-time analysis of the surface protein corona and stability of nanoparticle mediated interactions.
In this work, we applied amino modified NPs (S-NPs) and amino modified NPs with protein corona (S-NPP) to investigate the effect of protein corona on the interaction between NPs and phospholipid membrane. The types and contents of proteins on the surface of S-NPP were analyzed by high performance liquid chromatography (HPLC). The results show that alpha globulin encoded by hemoglobin subunit alpha 2 (HBA2) is the most abundant protein on S-NPP surface. S-NPs and S-NPP were investigated by SFG respectively to study the structure change of lipid membrane and the ordered behavior of interfacial water hydrogen bonded networks during the interaction process. The results illustrate the molecular mechanism and surface structure effects of S-NPP with a surface rich in alpha globulin encoded by HBA2 during the interaction with phospholipid membrane. We characterized the formation of stable systems of nanoparticle/protein corona and phospholipid membrane in-situ and real-time by using SFG. The detailed experimental description can be found in Supporting information.
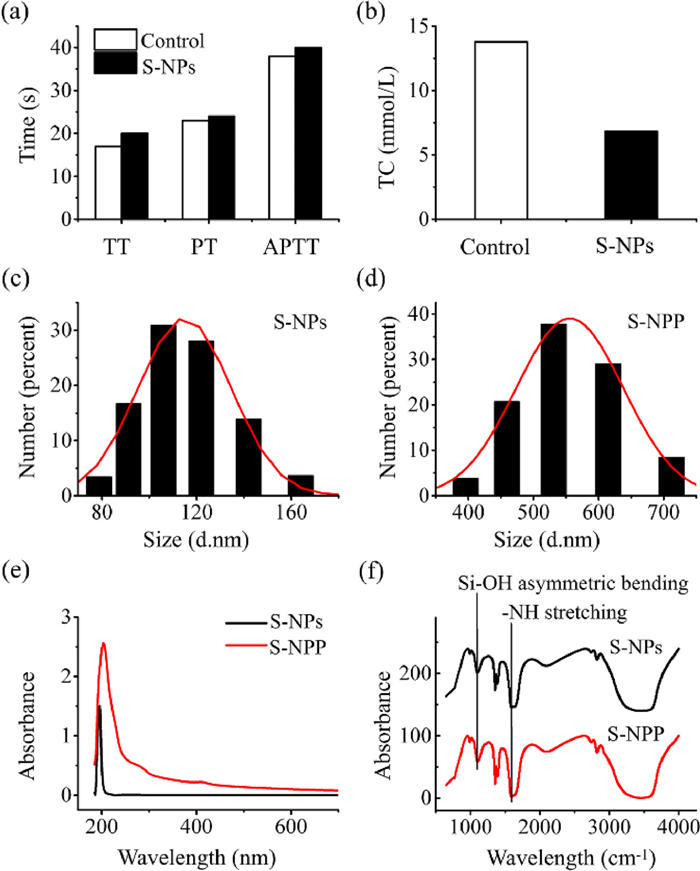
Firstly, we prepared S-NPs and S-NPP, followed by stepwise verification of the adsorption of protein corona on the surface of NPs. We prepared S-NPs and confirmed that the surface of the NPs was successfully modified with -NH2 by energy dispersive spectroscopy (EDS) analysis (Fig. S1 in Supporting information). S-NPP was prepared by blending S-NPs with human blood. In order to investigate the biological effects caused by the interaction between particles and blood, we first studied the influence of S-NPs on coagulation function. After the interaction between S-NPs and blood, we separated the particles and investigated the three indexes of thrombin time (TT), prothrombin time (PT) and activated partial thrombin time (APTT) of blood samples. At the same time, we also tested the three indicators of normal blood samples, as the control group. The measurement results of TT, PT and APTT are shown in Fig. 1a. By comparing the results of S-NPs treated blood samples with normal blood samples (control group), it can be observed that TT, PT and APTT increased after S-NPs treatment. Coagulation factors are various protein components involved in the blood clotting process. Coagulation process is a process in which a series of coagulation factors are activated by continuous enzymatic hydrolysis and eventually produce thrombin and form fibrin clot. The TT test assays the ability of plasma fibrinogen to convert to fibrin. PT test is a screening test for the determination of exogenous coagulation factors. APTT assay reflects endogenous coagulation factors. The increase of TT, PT and APTT indicates the decrease of coagulation factors in plasma and the ability to convert fibrinogen to fibrin, which means the coagulation function of blood samples treated with S-NPs decreased significantly. Based on the results, we speculate that coagulation factors are absorbed by particles during the interaction between particles and blood, which leads to the decrease of blood coagulation function. The decrease of coagulation function may be related to the adsorption of proteins on NPs surface.
Figure 1
Figure 1.
Characterization of NPs. Measurement results of (a) TT, PT, APTT and (b) TC in blood. DLS size measurement of (c) S-NPs and (d) S-NPP. The results of Gaussian Fit are shown as red curves. (e) Ultraviolet spectra of S-NPs and S-NPP. (f) Infrared spectra of S-NPs (black) and S-NPP (red). Si-OH asymmetric bending (1100 cm−1), NH stretching (1640 cm−1).
To further investigate the interaction of S-NPs with blood, we also measured total cholesterol (TC) in blood samples. Fig. 1b shows the measurement results of the TC. By comparing the TC level of blood samples treated with S-NPs and normal blood samples (control group), it can be observed that the TC level of blood samples treated with S-NPs decreased, which indicates that cholesterol molecules are adsorbed by particles during the interaction between particles and blood. We speculate that S-NPs adsorb lipoprotein molecules in the blood, possibly due to the active amino groups on their surface.
The above results indicate that some biomolecules are adsorbed on the particles surface after interaction with blood. To further verify and analyze the existence and composition of biomolecules, we comprehensively characterized the physicochemical properties of S-NPs and S-NPP. The dynamic light scattering (DLS) size measurements were performed, and the spectra of ultraviolet and Fourier transform infrared (FT-IR) were obtained. DLS size measurement results show that the average particle size range of S-NPs is 115 ± 30 nm, and that of S-NPP is 555 ± 30 nm (Figs. 1c and d). The results indicate that the hydration radius of S-NPP is significantly larger than that of S-NPs, which confirms the presence of surface inclusions of S-NPP. It should be proteins in blood that absorb on the surface of the NPs. By analyzing the ultraviolet spectra (Fig. 1e), a peak value at 195 nm is observed in S-NPs. The peak value at 195 nm is contributed by the alkane amino groups. It is proved that the S-NPs surface is modified with -NH2 groups. In addition, a significant peak value at 205 nm is observed in S-NPP, which is contributed by the absorption of amino acids in proteins. It is confirmed that the surface of S-NPP is coated with a protein corona. The FT-IR spectra of S-NPs and S-NPP both show the characteristic peak of -NH stretching vibration located at 1640 cm−1 (Fig. 1f). Compared with S-NPs, the -NH stretching vibration characteristic peak of S-NPP is very sharp, which indicates that the presence of protein corona on the surface of S-NPP can enhance the original -NH stretching vibration of particles [40]. In addition, the characteristic peak of -OH asymmetric bending vibration is also observed near 1100 cm−1. The -OH characteristic peak of S-NPP is weaker than that of S-NPs, indicating that the presence of protein corona can weaken the asymmetric Si-OH bending vibration of particles. These results further confirm that after the interaction between NPs and blood, the particles adsorb biological macromolecules and form protein corona on the surface.
To further determine the composition of protein corona, the surface proteins of S-NPP were analyzed by HPLC. The details are shown in Fig. S2 (Supporting information). It is indicated that the highest protein concentration is alpha globulin encoded by HBA2. The heat map of protein abundance proves that the alpha globulin encoded by HBA2 with the highest adsorption capacity, which shows that many proteins are adsorbed on the surface of the particles after the interaction with blood, and the content of alpha globulin encoded by HBA2 is higher than other proteins. It is indicated that alpha globulin encoded by HBA2 is the main component of the surface protein corona of the S-NPP, and is involved in a variety of biological reactions in vivo. Human hemoglobin is related to the clotting function of blood, especially its alpha globulin structure encoded by HBA2, which is directly related to blood clotting and associated with hemoglobin H disease and alpha-thalassemia [41]. Therefore, when we see more alpha globulin structure encoded by HBA2 on the surface of particles, it means that there is less of this protein in the blood, which leads to a decrease in clotting function. This is consistent with the experimental results of TT, PT and APTT measurements.
The toxicity of the NPs was evaluated by zebrafish experiments, which were approved by the Southeast University Laboratory Animal Welfare and Animal Experimental Ethical Inspection Committee and conducted in accordance with the committee's approved guidelines. We investigated the development of zebrafish under the treatment of S-NPs and S-NPP. As shown in Fig. S3 (Supporting information), developmental malformation can be observed in zebrafish treated with S-NPs, while S-NPP have no significant effect on the development of zebrafish. It is indicated that the surface protein corona could attenuate the physiological toxicity of NPs. In order to explain the altered toxicity of NPs in terms of molecular mechanism, SFG is a potential approach to study the interaction between phospholipid membrane and NPs.
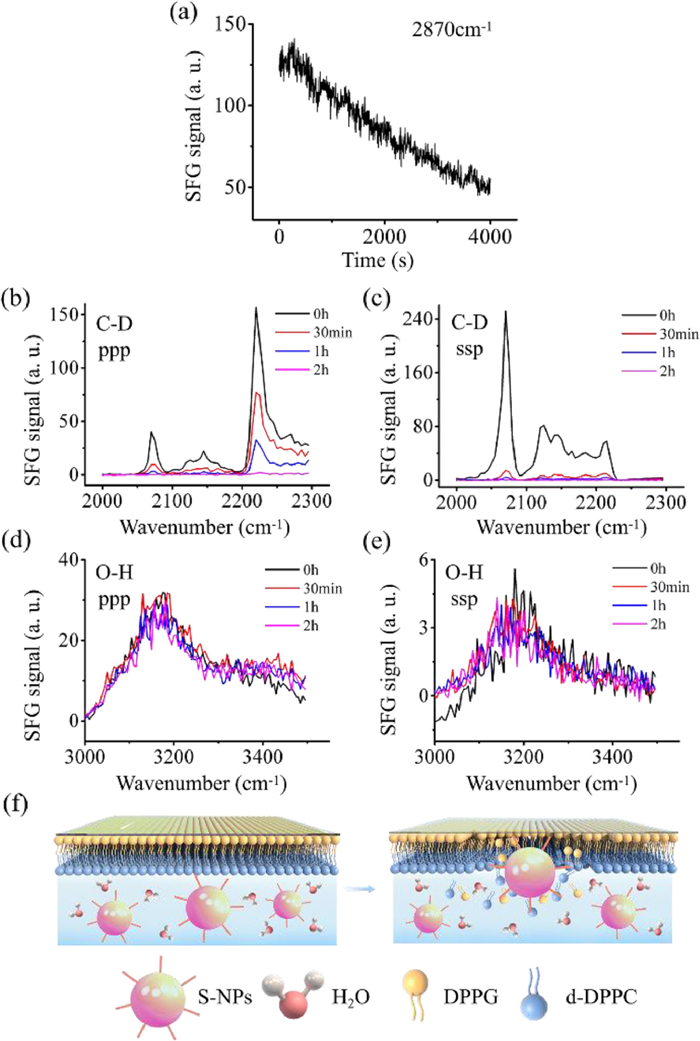
To study the effect of particles on the structure of phospholipid membrane, we used SFG to investigate the interaction of S-NPs and S-NPP with phospholipid membrane (Fig. 2,Fig. 3). First, we studied the interaction between S-NPs and phospholipid membrane. To monitor the interaction process between S-NPs and phospholipid membrane in real time, time-dependent SFG signals were collected after the addition of 10 µg S-NPs. Fig. 2a shows the time-dependent SFG signals at 2870 cm−1 contributed by the C-H stretching of inner leaflet after the addition of S-NPs. The characteristic peak positions in the SFG spectra can be found in Table S1 (Supporting information). The SFG signal intensity at 2870 cm−1 overall shows a downward trend within 4000 s. There are signal fluctuations in this process, which may be caused by the interference of the particle's own signal and the contact and separation process with the phospholipid membrane. The effect of the particle itself will enhance the signal intensity of the membrane, but the results show that the signal intensity is diminished. Therefore, it can be concluded that the phospholipid membrane is gradually destroyed during the contact with S-NPs. Considering the effect of methyl vibration of NPs, the details of SFG spectra in C-H stretching are shown in Fig. S4 (Supporting information), which can be a supplement to investigate the effect of S-NPs on phospholipid membrane.
Figure 2
Figure 2.
SFG results of the interaction of S-NPs with phospholipid membrane. (a) Time-dependent signal change at 2870 cm−1 after 10 µg S-NPs interacting with DPPG-d-DPPC bilayer at 200 s. DPPG: 1,2-dipalmitoyl-sn–glycero-3-[phospho-rac-(1-glycerol)]; d-DPPC: 1,2-dipalmitoyl-D62-sn–glycero-3-phosphocholine-1,1,2,2-D4-N,N,N-trimethyl-D9. (b) ppp SFG spectra collected from C-D stretching frequency regions at different time points after the addition of S-NPs and (c) ssp. Black: 0 h; Red: 30 min; Blue: 1 h; Purple: 2 h. (d) ppp SFG spectra collected from O-H stretching frequency regions at different time and (e) ssp. Black: 0 h; Red: 30 min; Blue: 1 h; Purple: 2 h. (f) Schematic diagram of S-NPs interacting with phospholipid membrane from 0 h (left) to 2 h (right). ppp: p-polarized sum frequency signal, p-polarized visible input beam, and p-polarized IR input beam. ssp: s-polarized sum frequency signal, s-polarized visible input beam, and p-polarized IR input beam.
Figure 3.
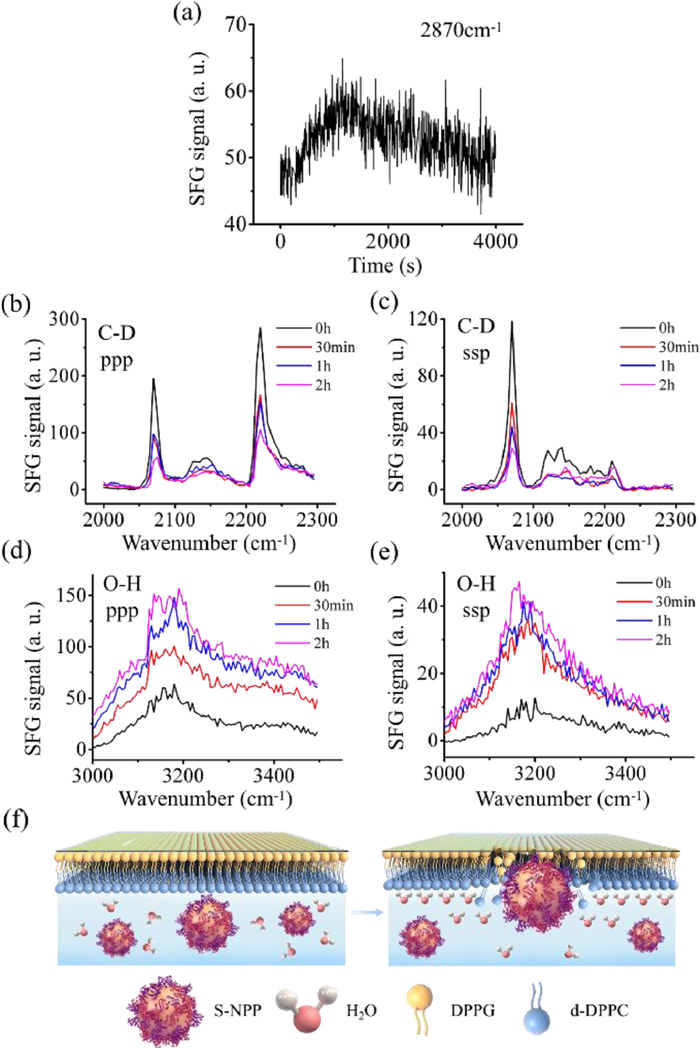
SFG results of the interaction of S-NPP with phospholipid membrane. (a) Time-dependent signal change at 2870 cm−1 after 10 µg S-NPP interacting with DPPG-d-DPPC bilayer at 200 s. (b) ppp SFG spectra collected from C-D stretching frequency regions at different time points after the addition of S-NPP and (c) ssp. Black: 0 h; Red: 30 min; Blue: 1 h; Purple: 2 h. (d) ppp SFG spectra collected from O-H stretching frequency regions at different time and (e) ssp. Black: 0 h; Red: 30 min; Blue: 1 h; Purple: 2 h. (f) Schematic diagram of S-NPP interacting with phospholipid membrane from 0 h (left) to 2 h (right).
By using SFG and isotopically asymmetric lipid bilayers, we monitored the C-D stretching signals to investigate the molecular interactions between S-NPs and outer leaflet. To study the effect of S-NPs on the structure of outer leaflet, SFG spectra were collected from the outer leaflet d-DPPC membrane. SFG spectra (Figs. 2b and c) collected from the outer leaflet are dominated by a peak centered at ~2070 cm−1, which is contributed by the symmetric C-D stretching of the CD3 groups at the outer leaflet end. Figs. 2b and c show SFG signals of outer leaflet d-DPPC membrane at different time points after adding S-NPs. It can be observed that SFG signals of C-D stretching gradually drop off with time after the addition of S-NPs. The results show that the addition of S-NPs also caused the destruction of the outer membrane.
In addition, SFG spectra of O-H stretching were collected to investigate the influence of S-NPs on the interfacial water. Figs. 2d and e show SFG spectra collected from O-H stretching frequency regions at different time points after S-NPs addition, which are dominated by the peak centered at ~3200 cm−1. It can be observed that SFG signals of ppp and ssp are almost unchanged over time. Schematic diagram of S-NPs interacting with phospholipid membrane from 0 h to 2 h is shown in Fig. 2f. As the S-NPs interact with the phospholipid membrane, the structure of the lipid bilayers is gradually destroyed, the phospholipid molecules are disordered in the system, as well as the water molecules. The results suggest that the amino groups on the particle surface block the free water between the phospholipid membrane and particle interface, so it can be observed that the water signal has not changed. Interestingly, the signals of phospholipid membrane decrease with time, which may from the influence of amino group, it led to flip-flop of phospholipid membrane.
To investigate the interaction between S-NPP and phospholipid bilayer, we followed the same research process as that for S-NPs. Fig. 3a shows the time-dependent SFG signals at ~2870 cm−1 contributed by the C-H stretching of inner leaflet after the addition of S-NPP. It can be observed that the SFG signal intensity at 2870 cm−1 increased rapidly within 1200 s, and then slowly decreased with time prolonged to 4000 s. Due to the interference from the methylene C-H vibration of the S-NPP, the signal intensity of 2870 cm−1 will be enhanced. But SFG signal intensity showed a downward trend between 1200 s and 4000 s. The results indicate that the inner leaflet is gradually destroyed during the contact with S-NPP. SFG spectra of C-H stretching were also collected, which can be a supplement to study the effect of S-NPP with surface protein corona on phospholipid membrane (Fig. S5 in Supporting information).
We further investigated the influence of S-NPP on the outer membrane by monitoring the C-D stretching signals without interference. SFG spectra collected from the outer leaflets (Figs. 3b and c) are dominated by a peak centered at ~2070 cm−1, which is contributed by the symmetric C-D stretching of the CD3 groups at the end of the outer leaflets. Figs. 3b and c show SFG signals at different time points after adding S-NPP. It can be observed that SFG signals gradually weaken with time after the addition of S-NPP. The results show that the outer leaflets are disrupted by the S-NPP. Compared with the effect of S-NPs on phospholipid membrane (Figs. 2b and c), S-NPP has less destructive effect on the outer layer phospholipid membrane. The results suggest that the protein corona can weaken the destructive effect of S-NPs on phospholipid membrane.
To study the influence of S-NPP on the interfacial water, SFG spectra of O-H stretching were collected. Figs. 3d and e show SFG spectra collected from O-H stretching frequency regions at different time points after S-NPP addition. It can be observed that the ppp and ssp signals of O-H stretching at ~3200 cm−1 are both enhanced from 0 h to 2 h. The ppp signals of O-H stretching are contributed by water molecules. Therefore, the enhancement of ppp signals indicates S-NPP can enhance the order of interfacial water. Schematic diagram of S-NPP interacting with phospholipid membrane from 0 h to 2 h is shown in Fig. 3f. As the S-NPP interact with the phospholipid membrane, the structure of the lipid bilayers is gradually destroyed, the phospholipid molecules are disordered in the system, and the water molecules are arranged in an ordered structure at the interface.
It can be observed that the signals of O-H stretching around the peak center 3200 cm−1 are contributed by the bound water that blocked by amino groups on particle surface. At the same time, the proteins that absorbed on the S-NPP will lead to additional quantities of bound water that around and insert the protein. Therefore, the enhancement of water signals may be contributed by the amino groups and the proteins on the surface of the S-NPP. SFG signal of outer phospholipid membrane were decreasing, we can deduce that the out leaflet was flip-flop and it will weaken the water signal between the interfaces. However, we can see from the experimental results that the signal of binding water between S-NPP and phospholipid membrane increases with time, which indicates that, in the process of interaction between particles and phospholipid membrane, the system tends to be stable in a lower energy state, which requires more bound water to maintain. The bond affinity network formed by binding water may maintain the final stability between particles and phospholipid membrane.
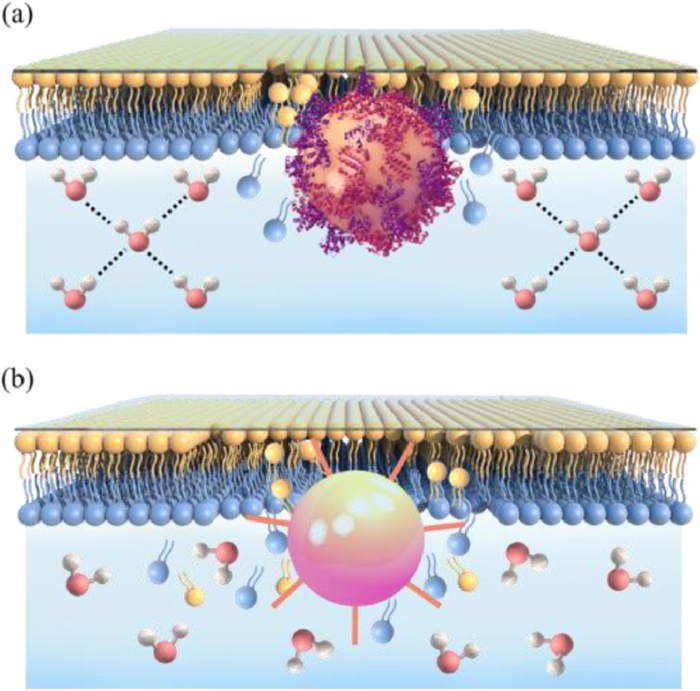
As shown in Figs. 3c and d, during the interaction between S-NPP and phospholipid membrane, the signal intensity of O-H stretching increases continuously, and finally the interfacial water forms a strong hydrogen bond network structure. Therefore, we drew a cartoon diagram of the interfacial water structure after the interaction of S-NPP with the membrane, as shown in Fig. 4a. After the interaction of S-NPP with phospholipid membrane, the hydrogen bond network of interfacial water was enhanced, thus stabilizing the S-NPP around the phospholipid membrane. Fig. 4b shows the water structure after S-NPs interact with the membrane. After the interaction of S-NPs with phospholipid membrane, the interfacial water structure remained unchanged and the water molecules were dispersed. This is consistent with Figs. 2c and d, the signal intensity of O-H stretching remained basically unchanged during the interaction of S-NPs with membrane.
Figure 4
Figure 4.
Diagram of interfacial water structure. (a) Interfacial water structure of S-NPP after interaction with phospholipid membrane. (b) Interfacial water structure of S-NPs after interaction with phospholipid membrane.
In conclusion, we use SFG at the phospholipid membrane interface to elucidate in situ and in real time the effect of surface modified amino group silica particles on the structure and stability of proteins absorbed from the blood. The molecular mechanism and surface structure effect of S-NPP on phospholipid membrane are investigated. The effects of the properties of NPs on the membrane structure and the interfacial water structure are elucidated. From the study, we can establish a picture that when the S-NPP with a protein corona interacted with the phospholipid membrane, bond affinity network formed by binding water will stable the S-NPP around the lipid bilayer, and the S-NPP can be found enveloped in hydration shells in this process. The existence of water structure ultimately leads to a moderate interaction between particles and phospholipid membrane.
This work provides a new approach for in-situ real-time study of particle surface protein corona and their effects on surface structure. At the same time, the conclusions of this paper will be beneficial in exploring the effects of structural changes on function and biological effects during the interaction between nanomaterials and phospholipid membrane. Furthermore, the typical secondary structure information of proteins can be indicated by the SFG spectra of amide region. Based on the results of this work, the dynamic changes in the secondary structure of protein corona during the interaction between NPs and phospholipid membrane can be further studied in the future. This will be significant for the design and development of nanomedicine.
Declaration of competing interest
The authors declare that they have no known competing financial interests or personal relationships that could have appeared to influence the work reported in this paper.
Acknowledgments
Thanks for the Southeast University and Nanjing Medical University Cooperation Project. Thanks to SceneRay Co., Ltd. for the financial support. This work was founded by the National Key Reserch and Development Program of China (No. 2017YFA0205304).
Supplementary materials
Supplementary material associated with this article can be found, in the online version, at doi:10.1016/j.cclet.2023.108619.
[1]
M.P. Monopoli, C. Åberg, A. Salvati, K.A. Dawson, Nat. Nanotechnol. 7 (2012) 779–786. doi: 10.1038/nnano.2012.207
S. Shourni, A. Javadi, N. Hosseinpour, A. Bahramian, M. Raoufi, Colloids Surf. A 638 (2022) 128273. doi: 10.1016/j.colsurfa.2022.128273
[41]
B. Giardine, J. Borg, E. Viennas, et al., Nucl. Acids Res. 42 (2014) 1063–1069. doi: 10.1093/nar/gkt911
Figure 1
Characterization of NPs. Measurement results of (a) TT, PT, APTT and (b) TC in blood. DLS size measurement of (c) S-NPs and (d) S-NPP. The results of Gaussian Fit are shown as red curves. (e) Ultraviolet spectra of S-NPs and S-NPP. (f) Infrared spectra of S-NPs (black) and S-NPP (red). Si-OH asymmetric bending (1100 cm−1), NH stretching (1640 cm−1).
Figure 2
SFG results of the interaction of S-NPs with phospholipid membrane. (a) Time-dependent signal change at 2870 cm−1 after 10 µg S-NPs interacting with DPPG-d-DPPC bilayer at 200 s. DPPG: 1,2-dipalmitoyl-sn–glycero-3-[phospho-rac-(1-glycerol)]; d-DPPC: 1,2-dipalmitoyl-D62-sn–glycero-3-phosphocholine-1,1,2,2-D4-N,N,N-trimethyl-D9. (b) ppp SFG spectra collected from C-D stretching frequency regions at different time points after the addition of S-NPs and (c) ssp. Black: 0 h; Red: 30 min; Blue: 1 h; Purple: 2 h. (d) ppp SFG spectra collected from O-H stretching frequency regions at different time and (e) ssp. Black: 0 h; Red: 30 min; Blue: 1 h; Purple: 2 h. (f) Schematic diagram of S-NPs interacting with phospholipid membrane from 0 h (left) to 2 h (right). ppp: p-polarized sum frequency signal, p-polarized visible input beam, and p-polarized IR input beam. ssp: s-polarized sum frequency signal, s-polarized visible input beam, and p-polarized IR input beam.
Figure 3
SFG results of the interaction of S-NPP with phospholipid membrane. (a) Time-dependent signal change at 2870 cm−1 after 10 µg S-NPP interacting with DPPG-d-DPPC bilayer at 200 s. (b) ppp SFG spectra collected from C-D stretching frequency regions at different time points after the addition of S-NPP and (c) ssp. Black: 0 h; Red: 30 min; Blue: 1 h; Purple: 2 h. (d) ppp SFG spectra collected from O-H stretching frequency regions at different time and (e) ssp. Black: 0 h; Red: 30 min; Blue: 1 h; Purple: 2 h. (f) Schematic diagram of S-NPP interacting with phospholipid membrane from 0 h (left) to 2 h (right).
Figure 4
Diagram of interfacial water structure. (a) Interfacial water structure of S-NPP after interaction with phospholipid membrane. (b) Interfacial water structure of S-NPs after interaction with phospholipid membrane.

 DownLoad:

 下载:
下载:


 下载:
下载:
