Figure 1.
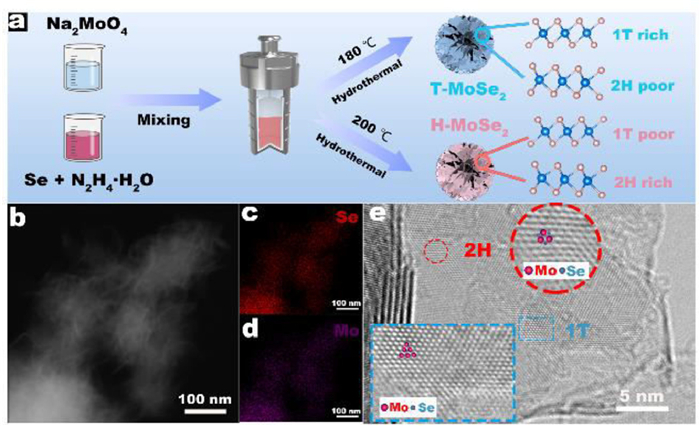
(a) Schematic diagram of the preparation processes for T-MoSe2 and H-MoSe2. (b-d) HAADF-STEM image of T-MoSe2 and EDS analysis. (e) HRTEM images of T-MoSe2.
Enhancing electrochemical conversion of lithium polysulfide by 1T-rich MoSe2 nanosheets for high performance lithium–sulfur batteries
Ruilong Li , Zhe Bai , Wensuo Hou , Zeyu Wu , Pingli Feng , Yu Bai , Kening Sun , Zhenhua Wang

Within the background of the rapid development of electric vehicles and portable electronic devices, it is imperative to develop low-cost and high-energy-density secondary batteries [1,2]. With the merits of environmental friendliness, low cost, high specific capacity (1675 mAh/g) and high energy density (2600 Wh/kg), lithium–sulfur batteries are considered to be one of the most promising next-generation secondary batteries [3,4]. And yet, the commercialization of lithium–sulfur batteries is limited by numerous problems, including the shuttle effect of soluble lithium polysulfides (LiPSs), slow sulfur redox kinetics, and the low reversibility of lithium anodes. In particular, the shuttle effect and sluggish sulfur redox kinetics result in low active material utilization, rapid battery capacity decay, and terrible cycling stability [5–7].
Over the last decades, numerous researches have been carried out to address the above issues. Based on the mechanism of physical and chemical adsorption, various non-polar carbon materials [8,9], polar carbon materials [10–13], metal oxides [14,15] and sulfides [16,17] etc. are reported to suppress the shuttle effect. However, limited by the finite active adsorption sites and the slow reaction kinetics of sulfur, such strategies cannot effectively solve the problems of lithium–sulfur batteries [18]. In this situation, a great deal of studies on electrocatalysts have been reported based on the mechanism of catalytic conversion in the domain of lithium–sulfur batteries. As the role of lithium–sulfur electrocatalysts, oxides [19–22], nitrides [23–25], phosphides [26,27], transition metal dichalcogenide [28–30], and single-atom catalysts [31,32] have been extensively studied. The electrocatalysts cannot only effectively adsorb LiPSs but also facilitates the redox of the active substance sulfur and suppress the shuttle effect [33]. Transition metal dichalcogenides have modest adsorption capacity and excellent catalytic ability, so they have attracted the attention of researchers [34,35]. Amongst them, transition metal selenides have better electronic conductivity in comparison to sulfides, since selenium has a weaker electronegativity than sulfur. At the same time, transition metal selenides also have the merits of moderate affinity for LiPSs and excellent catalytic performance [36]. Besides, it has been reported that the phase structure will significantly affect the activity of transition metal selenides in the HER and OER domains [37–40]. Common phase structures of transition metal dichalcogenides include 1T phase and 2H phase. The 1T phase have a much better catalytic ability than the 2H phase due to its abundant active sites and excellent electronic conductivity [41,42]. However, in the domain of lithium–sulfur batteries, rare research has been reported on the effect of selenide phase structures on the catalytic performance.
In this paper, we synthesized 1T-rich MoSe2 nanosheets and 2H-rich MoSe2 nanosheets and used them to functionalize separators. The effect of the phase structure of MoSe2 were explored on the adsorption of LiPSs and the catalytic conversion performance. Electrochemical tests and battery performance prove that T-MoSe2 nanosheets not only present stronger chemical affinity to LiPSs but also display better redox kinetics for LiPSs with the comparison of H-MoSe2 nanosheets. In addition, in-situ Raman spectroscopy as well as XPS found that T-MoSe2 effectively captures LiPSs through the formation of Mo-S and Li–Se bonds, and simultaneously achieves fast catalytic conversion of LiPSs. Attributed to the superiorities of T-MoSe2, the lithium–sulfur batteries with T-MoSe2 functionalized separator delivers wonderful cycling stability, with a capacity decay rate as low as 0.065% over 400 cycles at 1 C. This work offers a new perspective for the application of 1T phase transition metal dichalcogenides in high performance lithium–sulfur batteries.
Using the selenium powder as selenium source and the sodium molybdate as molybdenum source, MoSe2 nanosheets were synthesized via a simple one-step hydrothermal approach under the action of a strong reducing agent, hydrazine hydrate (Fig. 1a). MoSe2 nanosheets with different 1T phase contents, MoSe2 nanosheets rich 1T phase (T-MoSe2) and nanosheets rich 2H phase (H-MoSe2), were obtained by adjusting the synthesis temperature. The morphology and structural information of the MoSe2 nanosheets were investigated by SEM and TEM. It is apparent that T-MoSe2 exhibits a hierarchical architecture with the size of 100–200 nm comprising numerous nanosheet with the thickness of approximately 10 nm (Figs. S1 and S2 in Supporting information). Moreover, EDS indicates uniform distribution of Se and Mo elements, and the atomic ratio is roughly 2:1 (Figs. 1b-d and Fig. S3 in Supporting information). To further characterize the crystal structure, selective area electron diffraction (SAED) was performed. The diffraction rings with the radii of 0.17, 0.27 and 0.77 nm correspond to (110), (100), (002) crystal planes of the T-MoSe2, respectively (Fig. S4 in Supporting information). The slightly larger (002) and (110) crystal plane spacing of T-MoSe2 compared to the standard 2H MoSe2 crystal plane spacing are probably closely linked to the existence of 1T-phase MoSe2 [37,42]. To further demonstrate the existence of the 1T phase state, high-resolution transmission electron microscopy was performed. Note that the two observed different atomic arrangements correspond to two different phases of 1T and 2H for T-MoSe2 respectively (Fig. 1e). The Mo atoms of 1T phase exhibit an octahedral or trigonal antiprismatic symmetry coordination, while the 2H phase display trigonal prismatic coordination [43,44]. The above phenomena all indicate that two phases of 1T and 2H co-existence in T-MoSe2. It is noteworthy that H-MoSe2 has a similar morphology and crystal structure to T-MoSe2, which allows us to directly compare the differences in catalytic performance due to phase differences (Figs. S5-S7 in Supporting information).
The XRD was performed to examine the crystal structure of the synthesized MoSe2 nanosheets. As clearly displayed in Fig. 2a, the H-MoSe2 diffraction peaks located at 12.5°, 31.9°, 37.4° and 56.5° can be attributed to the (002), (100), (103) and (110) crystal planes of the standard 2H phase MoSe2 (PDF#29-0914), respectively. Due to taking hydrothermal method, the samples exhibit poor crystallinity. Furthermore, the presence of (103) diffraction peaks suggests that H-MoSe2 is enriched with 2H-phase MoSe2. The diffraction peak corresponding to the (002) crystal plane of T-MoSe2 shifts left and the diffraction peak corresponding to the (100) crystal plane of T-MoSe2 shifts right compared with H-MoSe2, which is in congruent with the previous reports of the existence of 1T phase MoSe2 [45,46]. According to Bragg’s equation, the (002) layer spacing of T-MoSe2 is 0.77 nm, which fits well the 0.77 nm layer spacing obtained by SAED results (Fig. S4 in Supporting information), and is more than the layer spacing of the standard 2H phase MoSe2. Raman spectroscopy is a nondestructive tool, which could be used to analyze the phase state of T-MoSe2 and H-MoSe2 (Fig. 2b). The H-MoSe2 exhibits characteristic Raman peak of the 2H phase at 240 cm−1, corresponding to the A1g mode of the 2H phase. At the same time, both T-MoSe2 and H-MoSe2 have two characteristic Raman peaks of the 1T phase at 198 and 288 cm−1, which correspond to the J1 and E2g1 vibration modes [42,47]. This phenomenon indicates that T-MoSe2 contains abundant 1T phase MoSe2.
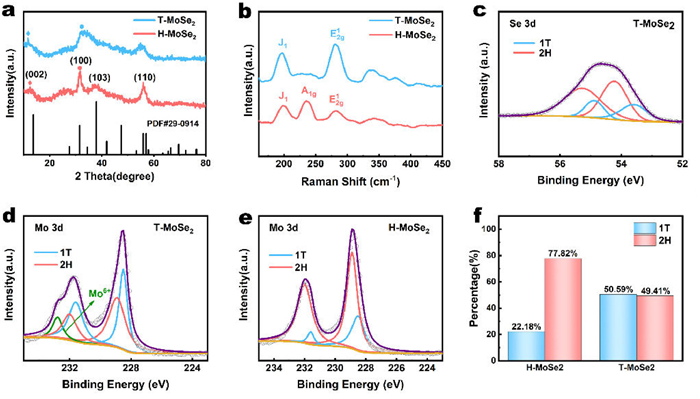
Then, the surface chemical bonding of H-MoSe2 and T-MoSe2 nanosheets was examined by XPS. The peaks at 53.5 and 54.9 eV are from Se 3d5/2 and Se 3d3/2 of the 1T phase, while the peaks at 54.1 and 55.3 eV are from Se 3d5/2 and Se 3d3/2 of the 2H phase [43,44]. The co-existence of 1T and 2H phases is further demonstrated in Fig. 2c and Fig. S8 (Supporting information) [35]. As illustrated in Figs. 2d and e, the peaks at 228.5 and 231.6 eV are ascribed to Mo 3d5/2 and Mo 3d3/2 of 1T-MoSe2, and the weaker peaks at 228.9 and 232 eV are relevant to Mo 3d5/2 and Mo 3d3/2 of 2H-MoSe2, separately. According to XPS analysis results, the content of different phases can be obtained by the area of different types of peaks [41,42]. The results display that only 22.18% of 1T phase MoSe2 in H-MoSe2, and 50.59% 1T phase MoSe2 in T-MoSe2, which was consistent with XRD and Raman results (Fig. 2f).
The efficient trapping of LiPSs by adsorption is of great significance for effectively suppressing the shuttle effect and facilitating the catalytic conversion of LiPSs. Visual LiPSs absorption ability test was conducted. It can be seen that the Li2S6 electrolyte with T-MoSe2 had the lightest color, followed by H-MoSe2 (Fig. 3a). The UV–visible spectroscopy revealed that T-MoSe2 showed the weakest absorption peak. This is due to the stronger chemisorption between T-MoSe2 and LiPSs. During the discharge process, the sulfur cathode is composed of two reaction processes: liquid phase reaction and liquid–solid reaction, which contribute 1/4 and 3/4 of the specific discharge capacity, respectively [33]. To assess the catalytic effect of T-MoSe2 and H-MoSe2 on the liquid phase reaction process, the two materials and CNT mixture were scraped on aluminum foil as sulfur-free cathodes, and Li2S6 symmetrical cells were assembled to test the CV curves respectively. To remove the influence of CNTs on the symmetrical CV test results, the symmetrical CV curves of pure CNT electrodes were also tested. As shown in Fig. 3b, the response value of the redox current is T-MoSe2 > H-MoSe2 > CNT, which suggests that T-MoSe2 has the stronger catalytic ability on the liquid phase reaction. The impedance of the symmetric cell was tested to study the interfacial charge transfer behavior. As shown in Fig. S9 (Supporting information), the T-MoSe2 symmetric cell has a smaller charge transfer impedance compared with the H-MoSe2 symmetric cell. The reason is that T-MoSe2 had a higher content of 1T phase MoSe2 with high electronic conductivity, which can contribute more electrocatalytic active sites and promote the liquid phase catalytic conversion of LiPSs [48]. The liquid-solid reaction has slower kinetics than the liquid phase reaction process, and is the step that determines the reaction rate of the sulfur cathode. To evaluate the catalytic effect of CNT, T-MoSe2 and H-MoSe2 on the liquid-solid reaction process, potentiostatic discharge was conducted to examine the nucleation behaviors of Li2S on various hosts (Figs. 3c-e). The three materials all reached the peak value of the current approximately 1000 s, but the capacity of Li2S precipitation was very different. The Li2S on nucleation capabilities were 188.30, 208.53 and 256.46 mAh/g of CNT, H-MoSe2 and T-MoSe2, respectively. The above experimental results demonstrate that T-MoSe2 nanosheets significantly accelerate the liquid phase transformation of LiPSs and the Li2S nucleation process compared with the H-MoSe2 nanosheets. The successive reduction processes from S8 to Li2S2/Li2S on T-MoSe2 and H-MoSe2 is schematically illustrated in Fig. 3f.

Recently, the construction of functional separators is also considered as an effective way to suppress the shuttle effect and improve the kinetics of lithium–sulfur chemistry, which is more economical and convenient than the precise design and construction of sulfur cathode to obtain the results in line with the commercial demand [33,49,50]. Therefore, we used a simple blade coating process to prepare functional membranes by loading T-MoSe2, H-MoSe2 and CNT on PP separators respectively. As shown in Fig. S10 (Supporting information), the three materials are uniformly covered on the PP separator, and at the same time, the functionalized separators loaded with different materials all show good flexibility and stability, and the slurry will not crack and fall off in the situation of bending. SEM was applied to characterize the surface morphologies of the three functionalized separators. The microscopic morphologies of the three functionalized separators are basically the same, and the surfaces are relatively flat. The exposed PP separator was not visible even when zoomed in to the micrometer scale. The cross-sections of the three functionalized separators were observed by SEM, and the coating thicknesses of the three functionalized separators were about 4–5 µm. The electrocatalytic material loading of the functionalized separators were also controlled to be approximately 0.2 mg/cm2. The three functionalized separators had good structural consistency, which eliminated the influence of structural differences on electrochemical performance (Figs. S11-S13 in Supporting information). DFT theoretical calculation results show that 1T phase MoSe2 and LiPSs neutral molecules have higher binding energy (Fig. S14 in Supporting information) and recent studies show that LiPSs are mainly present as Li2Sn molecules in ether-based electrolytes [51,52], and that the polysulfide anions are rarely present. It can be predicted that T-MoSe2 functionalized separator can effectively block LiPSs. The H-cell-type tests showed that no obvious Li2S6 penetration was observed in the T-MoSe2 functionalized separator after 3 h, compared with the other two functionalized separators (Fig. S15 in Supporting information). We examined the ionic conductivity (σ) and Li ion transference number (tLi+) of different functionalized separators. (Figs. 4a-c and Fig. S16 in Supporting information). The σ of CNT, H-MoSe2 and T-MoSe2 functionalized separators is calculated to be 0.22, 0.28 and 0.32 mS/cm at 25 ℃, respectively. The tLi+ of T-MoSe2, H-MoSe2 and CNT functionalized separators is 0.363, 0.323 and 0.251, respectively. These results indicate that the Li–S batteries with T-MoSe2 functionalized separators will have better rate performance [53].
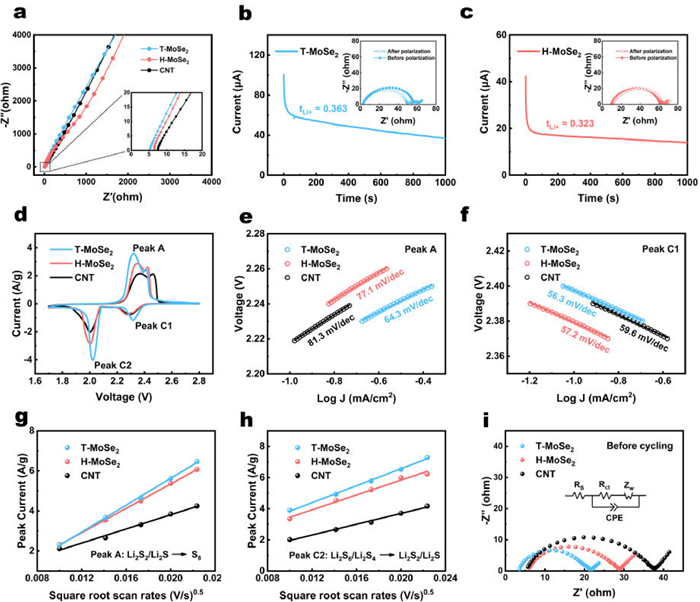
To demonstrate the practical effect of different phases on MoSe2 electrocatalysts, the lithium–sulfur full batteries with H-MoSe2, T-MoSe2, and CNT functionalized separators, respectively, were assessed in CR2025-type coin cells. The CV curves recorded in the voltage range of 1.7–2.8 V at a scan rate of 0.1 mV/s. There are two typical cathodic peaks at 2.3–2.4 and 1.9–2.1 V, which correspond to the successive reduction reaction from S8 to long-chain LiPSs (Li2Sx (4 ≤ x ≤ 6)) and then to Li2S2/Li2S, respectively. Meantime, the anodic peak at approximately 2.4 V is allocated to Li2S oxidation (Fig. 4d). It is worth noting that the cells based on the T-MoSe2 functionalized separator exhibits the largest response current and the lowest polarization voltage compared to T-MoSe2 and CNT functionalized separators. This phenomenon indicates that the increase of 1T phase content in MoSe2 can significantly facilitate the redox reaction of sulfur. The electrocatalytic performance of the material can be measured by the Tafel slope [54–56]. Analyzing of the first stage of the reduction reaction, the Tafel slopes for CNT, H-MoSe2 and T-MoSe2 batteries are 59.6, 57.2 and 56.3 mV/dec (Fig. 4f). The Tafel slopes of CNT, H-MoSe2, T-MoSe2 batteries for the oxidation process are 81.3, 77.1, 64.3 mV/dec (Fig. 4e). The T-MoSe2 battery displays the minimum Tafel slope in the reduction and oxidation reactions, so the T-MoSe2 functionalized separator battery has the most outstanding electrocatalytic performance. In addition, the Randles-Sevcik equation is shown below. The lithium-ion diffusion coefficient (DLi+) can be acquired via measuring the CV curves at different sweep rates [57,58].
|
|
(1) |
where A represents area of electrode, n represents charge transfer number, ν represents scan rate, CLi+ represents concentration of Li+ and Ip represents peak current. The fitted curves of the T-MoSe2 functionalized separator are steeper for all redox peaks, which correspond to the largest DLi+ during electrochemical reactions (Figs. 4g and h, Fig. S17 in Supporting information). This result suggests that T-MoSe2 with a higher 1T phase content has a higher diffusion coefficient of lithium ions. Electrochemical impedance spectroscopy (EIS) testing was performed on lithium–sulfur batteries based on CNT, H-MoSe2 and T-MoSe2 functionalized separator, when the batteries were 100% state of charge. The plots were analyzed with the help of the equivalent circuit modeling (Fig. 4i). In this sense, Zw represents the Warburg element and Rs represents the resistance of the electrolyte. The sloping line in the low-frequency region corresponds to ion diffusivity and the semicircle in the high-frequency region reflects charge-transfer impedance [59]. Note that the lithium–sulfur batteries with T-MoSe2 functionalized separator harvests the lowest charge-transfer resistance value (Table S2 in Supporting information). The conclusion indicates that the rise in 1T phase content is benefit to electron transfer.
The rate capabilities of the batteries based on CNT, H-MoSe2 and T-MoSe2 functionalized separators are shown in Fig. 5a. The battery with T-MoSe2 functionalized separator demonstrates outstanding rate performance with the capacities of 1231.2, 966.3, 876.7, 813.7 and 770.1 mAh/g at 0.2, 0.5, 1.0, 2.0 and 3.0 C, respectively. Note that the CNT and T-MoSe2 functionalized separator exhibit lower capacity at the same rate. Particularly when the rate reaches 3C, CNT and H-MoSe2 functionalized separators only maintain the specific capacities of 562.9 and 654.3 mAh/g. A further analysis of charge-discharge profiles (Fig. 5b and Fig. S19 in Supporting information) show that the T-MoSe2 functionalized separator has the smallest overpotential and a flatter voltage plateau. The overpotential of the T-MoSe2 functionalized separator at 0.2, 0.5, 1, 2 and 3 C are 0.166, 0.203, 0.273, 0.409 and 0.533 V, respectively (Fig. 5c). These results demonstrate that T-MoSe2 has a superior electrocatalytic capacity for LiPSs. Fig. 5f shows the cycle stability of these functionalized separators at 1 C. The T-MoSe2 functionalized separator acquires a high initial discharge capacity of 845.9 mAh/g and holds a high capacity of 599.5 mAh/g after 400 cycles. In comparison, CNT and H-MoSe2 functionalized separators obtain an initial discharge capacity of 834.2 and 772.5 mAh/g, separately. After 200 cycles, only the capacity of 552.5 and 508.2 mAh/g have left respectively. The high-voltage plateau capacity QH (S8-Li2S4) and the low-voltage plateau capacity QL (Li2S4–Li2S/Li2S2) together constitute the entire discharge capacity. Note that the T-MoSe2 functionalized separator has the maximum values of QH and QL (Fig. 5d), suggesting that the T-MoSe2 can validly accelerate the electrochemical conversion of LiPSs, thus bringing improvement in the utilization of sulfur.
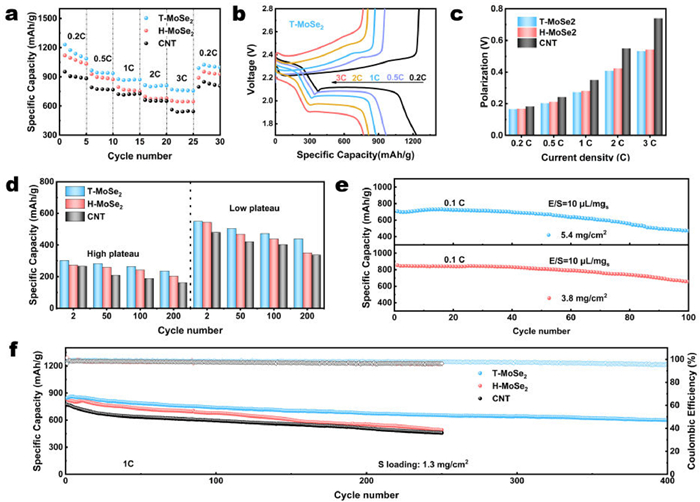
Previous studies have shown that the long-term cycling stability of lithium–sulfur batteries is strongly dependent on lithium anode protection [60,61]. With the help of SEM, we investigated the morphology of the lithium anode after cycling. In comparation with the lithium anode corresponding to CNT and H-MoSe2 functionalized separator, the lithium anode corresponding to T-MoSe2 functionalized separator is relatively flat (Fig. S21 in Supporting information). This is because the T-MoSe2 functionalized separator contains more 1T phase, so it has more efficient adsorption and catalytic conversion performance of LiPSs. Therefore, the T-MoSe2 functionalized separator effectively suppresses the shuttle effect of LiPSs. In the consideration of the commercialization of lithium–sulfur batteries, it is crucial to study lithium–sulfur batteries under lean liquid and high sulfur loading conditions [62,63]. The cycling performance of the T-MoSe2 functionalized separator with the sulfur load of 3.8 and 5.4 mg/cm2 were measured (Fig. 5e). The batteries with a sulfur loading of 3.8 mg/cm2 and an E/S ratio of about 10 µL/mg sulfur provided an initial discharge specific capacity of 854.3 mAh/g at 0.1 C current density. The high sulfur loading battery maintained a discharge specific capacity of 655.2 mAh/g after 100 cycles. With the sulfur loading of 5.4 mg/cm, the cell had an initial discharge specific capacity of 706.6 mAh/g at 0.1 C, and still retained a specific capacity of 471.3 mAh/g after 100 cycles. At the same time, the batteries with T-MoSe2 functionalized separators still provide stable cycling performance with the E/S ratio of 4.8 µL/mg (Fig. S22 in Supporting information). These experimental results can be attributed to the efficacious enhancement of the catalytic conversion of LiPSs by T-MoSe2.
With the assistance of in-situ Raman spectroscopy, we monitored the evolutions of LiPSs in the neighborhood of the functionalized separator in real time. Figs. 6a-c correspond to the Raman test results, voltage-time curves and corresponding contour plots of H-MoSe2 when charged and discharged at a rate of 0.1 C, respectively. In the initial stage of discharge, a clear S8/S82− signal can be detected at 475 cm−1. At the same time, the peaks of S62−/S42− and S42−/S32− can be observed near 400 and 455 cm−1. As the discharge progresses, the peak intensities of S62− and S42− gradually decrease, indicating that the long-chain LiPSs to short-chain LiPSs occurred at this stage, while S8 maintained a high peak intensity, indicating that the H-MoSe2 functionalized separator failed to catalyze the conversion of polysulfides well. However, in the T-MoSe2 functionalized separator (Figs. 6d-f), no obvious peak signals of S62−/S42− and S42−/S32− were detected, and the peak intensity of S8 was also lower, which indicated that the T-MoSe2 functionalized separator could effectively catalyze the conversion of LiPSs. The phenomenon during charging were similar to discharging. The above phenomena suggest that the T-MoSe2 with abundant 1T phase can efficaciously accelerate the redox kinetics of LiPSs, inhibit the shuttle effect, and raise the utilization of sulfur.
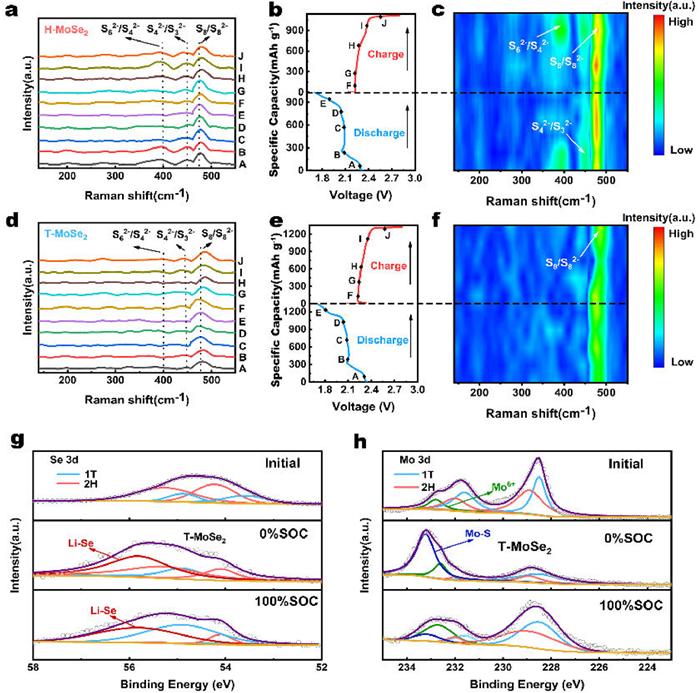
To further reveal the electrocatalytic mechanism of T-MoSe2 nanosheets during the discharge process, the T-MoSe2 nanosheets at different SOCs were investigated by means of XPS (Figs. 6g and h). The characteristic peaks located at 228.5 and 231.6 eV are attributed to MoSe2 of 1T phase, while the characteristic peaks of 228.9 and 232 eV are attributed to the characteristic peaks of 2H phase. The characteristic peak located at about 233.3 eV, corresponding to the characteristic peak of Mo6+, is due to the inevitable oxidation during the disassembly of the battery to test XPS. At different SOCs, we were able to observe the Mo-S bonds and Li-Se bonds [48], which contributed to the efficient adsorption of LiPSs by T-MoSe2 nanosheets. In previous reports [48], the phase transition phenomenon of MoSe2 during sulfur cathode discharge stage was reported. However, quantitative studies of 2H to 1T are lacking. As mentioned above, the 1T phase content of T-MoSe2 is 50.59% while the 1T phase content of H-MoSe2 is 22.18%. Our results show that the 1T phase content of T-MoSe2 increases by about 20% during sulfur cathode discharge stage, and the 1T phase content decreases by about 17% during charge stage. After a complete charge-discharge process, the 2H to 1T phase variable is only about 3% (Fig. S23 in Supporting information). Similarly, we find that the 1T phase content of H-MoSe2 increases by about 13% during sulfur cathode discharge stage and decreases by about 11% during charge stage. After a complete charge- discharge process, the 2H to 1T phase variable was only about 2% (Fig. S27 in Supporting information). During the charge-discharge process, T-MoSe2 always maintains a higher 1T phase content than H-MoSe2, which contributes to the catalytic conversion of polysulfides. Therefore, lithium–sulfur batteries with T-MoSe2 functionalized separators exhibit more superior electrochemical performance.
In conclusion, we successfully synthesized 1T phase-rich MoSe2 (T-MoSe2) nanosheets and 2H phase-rich MoSe2 (H-MoSe2) nanosheets to research the effect of phase structure on the catalytic conversion. Compared with H-MoSe2, the T-MoSe2 have stronger adsorption capacity and catalytic conversion ability in sulfur redox reactions. With the help of in-situ Raman and XPS, we found that the T-MoSe2 functionalized separator can adsorb LiPSs through Mo–S and Li–Se bonds, and facilitating the catalytic conversion of LiPSs to effectively suppress the shuttle effect. Benefiting from the superiority of T-MoSe2, the lithium–sulfur batteries with T-MoSe2 functionalized separator exhibit superior cycling stability (the capacity decay rate of only 0.065% during 400 cycles), and outstanding rate capacity (770.1 mAh/g under 3 C). This research provides a new perspective for designing highly efficient lithium–sulfur batteries based on selenide electrocatalysts.
The authors declare that they have no known competing financial interests or personal relationships that could have appeared to influence the work reported in this paper.
This work was supported by the National Natural Science Foundation of China (No. 22179007).
Supplementary material associated with this article can be found, in the online version, at
Y. Chen, T. Wang, H. Tian, et al., Adv. Mater. 33 (2021) e2003666. doi: 10.1002/adma.202003666
S. Feng, Z.H. Fu, X. Chen, Q. Zhang, InfoMat 4 (2022) e12304. doi: 10.1002/inf2.12304
Y.Q. Peng, M. Zhao, Z.X. Chen, et al., Batter. Supercaps 5 (2021) e202100359.
J. Li, Z. Xiong, Y. Wu, et al., J. Energy Chem. 73 (2022) 513–532. doi: 10.1016/j.jechem.2022.05.034
Z.X. Chen, M. Zhao, L.P. Hou, et al., Adv. Mater. 34 (2022) e2201555. doi: 10.1002/adma.202201555
Z. Shen, X. Jin, J. Tian, et al., Nat. Catal. 5 (2022) 555–563. doi: 10.1038/s41929-022-00804-4
Z. Han, R. Gao, Y. Jia, et al., Mater. Today 57 (2022) 84–120.
Y.S. Su, A. Manthiram, Nat. Commun. 3 (2012) 1166. doi: 10.1038/ncomms2163
S.H. Chung, A. Manthiram, Adv. Funct. Mater. 24 (2014) 5299–5306. doi: 10.1002/adfm.201400845
M. Shi, S. Zhang, Y. Jiang, et al., Nano-Micro Lett. 12 (2020) 146. doi: 10.1007/s40820-020-00477-3
L. Gai, C. Zhao, Y. Zhang, Z. Hu, Q. Shen, Carbon Energy 4 (2022) 142–154. doi: 10.1002/cey2.168
S. Niu, S.W. Zhang, R. Shi, et al., Energy Storage Mater. 33 (2020) 73–81. doi: 10.1016/j.ensm.2020.05.033
Y. Zhao, Z. Gu, W. Weng, et al., Chin. Chem. Lett. 34 (2023) 107232. doi: 10.1016/j.cclet.2022.02.037
H. Shao, W. Wang, H. Zhang, et al., J. Power Sources 378 (2018) 537–545. doi: 10.1016/j.jpowsour.2017.12.067
Z. Li, L. Tang, X. Liu, et al., Electrochim. Acta 310 (2019) 1–12. doi: 10.1016/j.electacta.2019.04.057
B. Moorthy, S. Kwon, J.H. Kim, et al., Nanosc. Horiz. 4 (2019) 214–222. doi: 10.1039/C8NH00172C
Y.C. Jeong, J.H. Kim, S.H. Kwon, et al., J. Mater. Chem. 5 (2017) 23909–23918 A. doi: 10.1039/C7TA08153G
P. Wang, B. Xi, M. Huang, et al., Adv. Energy Mater. 11 (2021) 2002893. doi: 10.1002/aenm.202002893
Z. He, T. Wan, Y. Luo, et al., Chem. Eng. J. 448 (2022) 137656. doi: 10.1016/j.cej.2022.137656
W. Hou, P. Feng, X. Guo, et al., Adv. Mater. 34 (2022) e2202222. doi: 10.1002/adma.202202222
K. Gao, R. Xu, Y. Chen, et al., Chin. Chem. Lett. 34 (2023) 107229. doi: 10.1016/j.cclet.2022.02.034
M. Wang, D. Yin, Y. Cao, et al., Chin. Chem. Lett. 33 (2022) 4350–4356. doi: 10.1016/j.cclet.2021.11.043
N. Shi, B. Xi, J. Liu, et al., Adv. Funct. Mater. 32 (2022) 2111586. doi: 10.1002/adfm.202111586
M. Luo, Y. Bai, R. Sun, et al., J. Energy Chem. 73 (2022) 407–415. doi: 10.1016/j.jechem.2022.05.029
E. Jing, L. Chen, S. Xu, et al., J. Energy Chem. 64 (2022) 574–582. doi: 10.1016/j.jechem.2021.05.015
R. Sun, Y. Bai, Z. Bai, et al., Adv. Energy Mater. 12 (2022) 2102739. doi: 10.1002/aenm.202102739
S. Yang, R. Xiao, T. Hu, et al., Nano Energy 90 (2021) 106584. doi: 10.1016/j.nanoen.2021.106584
Q. Wang, H. Zhao, B. Li, et al., Chin. Chem. Lett. 32 (2021) 1157–1160. doi: 10.1016/j.cclet.2020.09.022
F. Li, L. Wang, G. Qu, et al., Chin. Chem. Lett. 33 (2022) 3909–3915. doi: 10.1016/j.cclet.2021.11.046
D. Tian, X. Song, Y. Qiu, et al., ACS Nano 15 (2021) 16515–16524. doi: 10.1021/acsnano.1c06067
R. Xiao, T. Yu, S. Yang, et al., Energy Storage Mater. 51 (2022) 890–899. doi: 10.1016/j.ensm.2022.07.024
Y. Ding, Q. Cheng, J. Wu, et al., Adv. Mater. 34 (2022) e2202256. doi: 10.1002/adma.202202256
S. Li, W. Zhang, J. Zheng, et al., Adv. Energy Mater. 11 (2020) 2000779.
D. Yang, M. Li, X. Zheng, et al., ACS Nano 16 (2022) 11102–11114. doi: 10.1021/acsnano.2c03788
W. Tian, B. Xi, Z. Feng, et al., Adv. Energy Mater. 9 (2019) 1901896. doi: 10.1002/aenm.201901896
C. Li, W. Ge, S. Qi, et al., Adv. Energy Mater. 12 (2022) 2103915. doi: 10.1002/aenm.202103915
I.S. Kwon, I.H. Kwak, T.T. Debela, et al., ACS Nano 14 (2020) 6295–6304. doi: 10.1021/acsnano.0c02593
C. Yang, L. Zhou, C. Wang, et al., Appl. Catal. B 304 (2022) 120993. doi: 10.1016/j.apcatb.2021.120993
Z. Qin, J. Zhao, J. Colloid Interface Sci. 605 (2022) 155–162. doi: 10.1016/j.jcis.2021.07.087
N.K. Oh, C. Kim, J. Lee, Nat. Commun. 10 (2019) 1723. doi: 10.1038/s41467-019-09339-y
Y. Li, Y. Zhang, X. Tong, et al., J. Mater. Chem. A 9 (2021) 1418–1428. doi: 10.1039/D0TA08514F
Q. Xia, L. Zhao, D. Li, et al., J. Mater. Chem. A 9 (2021) 19922–19931. doi: 10.1039/D1TA03584C
Y.J. Chung, C.S. Yang, J.T. Lee, G.H. Wu, J.M. Wu, Adv. Energy Mater. 10 (2020) 2002082. doi: 10.1002/aenm.202002082
R. Zhou, H. Wang, J. Chang, et al., ACS Appl. Mater. Interfaces 13 (2021) 17459–17466. doi: 10.1021/acsami.0c22923
N. Li, J. Wu, Y. Lu, et al., Appl. Catal. B 238 (2018) 27–37. doi: 10.1016/j.apcatb.2018.07.002
H. Shi, H. Zhang, M. Li, Y. Wang, D. Wang, J. Alloys Compd. 878 (2021) 160381. doi: 10.1016/j.jallcom.2021.160381
J. Chen, Y. Luo, W. Zhang, et al., Nano-Micro Lett. 12 (2020) 171. doi: 10.1007/s40820-020-00511-4
K. Mahankali, S.V. Gottumukkala, N. Masurkar, et al., ACS Appl. Mater. Interfaces 14 (2022) 24486–24496. doi: 10.1021/acsami.2c05508
Y. Li, Z. Li, C. Zhou, et al., Chem. Eng. J. 422 (2021) 130107. doi: 10.1016/j.cej.2021.130107
M.K. Aslam, S. Jamil, S. Hussain, M. Xu, Energy Environ. Mater. 6 (2023) e12420. doi: 10.1002/eem2.12420
Y.W. Song, L. Shen, N. Yao, et al., Chem 8 (2022) 3031–3050. doi: 10.1016/j.chempr.2022.07.004
B. Zhang, J. Wu, J. Gu, et al., ACS Energy Lett. 6 (2021) 537–546. doi: 10.1021/acsenergylett.0c02527
Y. Liu, Y. Zhu, Y. Cui, Nat. Energy 4 (2019) 540–550. doi: 10.1038/s41560-019-0405-3
Z. Shi, Z. Sun, J. Cai, et al., Adv. Mater. 33 (2021) e2103050. doi: 10.1002/adma.202103050
B. Wang, L. Wang, B. Zhang, et al., Energy Storage Mater. 45 (2022) 130–141. doi: 10.1016/j.ensm.2021.11.039
Y. Li, H. Wu, D. Wu, et al., Adv. Sci. 9 (2022) e2200840. doi: 10.1002/advs.202200840
W. Hou, Y. Yang, L. Fang, et al., Chem. Eng. J. 409 (2021) 128079. doi: 10.1016/j.cej.2020.128079
R. Sun, Y. Bai, M. Luo, et al., ACS Nano 15 (2021) 739–750. doi: 10.1021/acsnano.0c07038
J. Sun, Y. Sun, M. Pasta, et al., Adv. Mater. 28 (2016) 9797–9803. doi: 10.1002/adma.201602172
J. Li, L. Dai, Z. Wang, et al., J. Energy Chem. 67 (2022) 736–744. doi: 10.1016/j.jechem.2021.11.017
X.Z. Fan, M. Liu, R. Zhang, et al., Chin. Chem. Lett. 33 (2022) 4421–4427. doi: 10.1016/j.cclet.2021.12.064
L. Kong, L. Yin, F. Xu, et al., J. Energy Chem. 55 (2021) 80–91. doi: 10.1016/j.jechem.2020.06.054
C. Yang, Appl. Energy 306 (2022) 118116. doi: 10.1016/j.apenergy.2021.118116

Figure 1 (a) Schematic diagram of the preparation processes for T-MoSe2 and H-MoSe2. (b-d) HAADF-STEM image of T-MoSe2 and EDS analysis. (e) HRTEM images of T-MoSe2.

Figure 2 (a) XRD patterns of T-MoSe2. (b) Raman spectra of the obtained T-MoSe2 and H-MoSe2. (c) XPS spectra of Se 3d regions of T-MoSe2. XPS spectra of Mo 3d regions of (d) T-MoSe2 and (e) H-MoSe2. (f) Ratios of 1T and 2H phases of T-MoSe2 and H-MoSe2.

Figure 3 (a) Comparative photo and UV–visible spectroscopy after 12 h of static adsorption of Li2S6. (b) CV curves of Li2S6 symmetric cells employing T-MoSe2, H-MoSe2 and CNT, respectively. (c-e) Potentiostatic discharge current-time curves and the corresponding capacity of Li2S precipitation. (f) Schematic illustration of the reaction processes from S8 to Li2S2/Li2S on T-MoSe2 and H-MoSe2.

Figure 4 (a) Nyquist plots of stainless steel sheet symmetric cells with CNT, H-MoSe2 and T-MoSe2 functionalized separators. Current-time curves for the cells with (b) T-MoSe2 and (c) H-MoSe2 functionalized separators. (d) CV curves of T-MoSe2, H-MoSe2 and CNT functionalized separators at 0.1 mV/s. Tafel plots of (e) the peak A and (f) peak C1. The linear relationship between peak current and square root scan rate for (g) peak A and (h) peak C2 in three functionalized separators, respectively. (i) Nyquist plots of batteries with different functionalized separators.

Figure 5 (a) The rate capabilities of the T-MoSe2, H-MoSe2 and CNT functionalized separators. (b) Corresponding charge–discharge profiles of T-MoSe2 functionalized separators. (c) Polarization at various rates. (d) The capacity contribution of the high plateau and the low plateau at 1 C. (e) Cycling performance of T-MoSe2 functionalized separator with raised sulfur loadings at 0.1 C. (f) Ultralong cycling performance the T-MoSe2, H-MoSe2 and CNT functionalized separators.

Figure 6 In-situ Raman spectra of the (a) H-MoSe2 and (d) T-MoSe2 functionalized separator. Voltage–capacity curves corresponding the (b) H-MoSe2 and (e) T-MoSe2 functionalized separator. The corresponding contour curves of (c) H-MoSe2 and (f) T-MoSe2 functionalized separator. (g) XPS spectra of Se 3d regions of T-MoSe2 in different states of charge. (h) XPS spectra of Mo 3d regions of T-MoSe2 in different states of charge.

 扫一扫看文章

扫一扫关注我们
 DownLoad:
 下载:
下载: