School of Materials Science and Engineering, Tianjin Key Laboratory of Photoelectric Materials & Devices, Tianjin University of Technology, Tianjin 300384, China
Received Date:
25 April 2023 Accepted Date:
16 June 2023 Revised Date:
29 May 2023 Available Online:
15 May 2024
Abstract:
The relationship mechanism between the material pore structures and cathodic iodine chemistry plays a vital role in efficient Zn-I2 batteries, but is unclear, retarding further advances. This work innovatively indicates a great contribution of ~2.5 nm pore structure of nanocarbons to efficient iodine adsorption, rapid I− ↔ I2 conversion, and polyiodide inhibition, via scrupulously designing catalysts with controllable pore sizes systematically. The I2-loading within the designed nitrogen-doped nanocarbons can reach up to as high as 60.8 wt%. The batteries based on the cathode deliver impressive performances with a large capacity of 178.8 mAh/g and long-term cycling stability more than 4000 h at 5.0 C. Notably, these is no polyiodide such as I3− and I5− detected during the charge-discharge processes from comprehensive electrochemical cyclic voltammetry, X-ray photoelectron spectroscopy, and Raman technique. This work provides a novel knowledge-guided concept for rational pore design, promising better Zn-I2 batteries, which is also hoped to benefit other advanced energy technologies, such as Li–S, Li-ion, and Al–I2 batteries.
High-performance energy storage technologies revolutionize our world towards safe, portable, environment-friendly, and high-tech modern-life experiences [1–7]. Among them, aqueous zinc-iodine battery attracts a broad of research interests due to the high theoretical capacity of 211 mAh/g, low cost, and especially the safety gifted by the aqueous electrolytes [8–14]. Nevertheless, the practical battery efficiency is heavily restricted by the inefficient iodine adsorption and sluggish conversion, which is originated from the inherent physical and chemical properties [15–20]. In physical ones, iodine suffers a limited electrical conductivity. The massive storage also leads to a heavy shape change of cathodic materials. In chemical ones, iodine prefers a polymerization in thermodynamics, via electron overlapping in σ orbits and conjugation in π orbits, forming a relatively stable polyiodide. These properties result in the limited utilization of iodine and thus degraded battery performances. Therefore, advanced concepts and smart synthesis methodologies for the cathode materials, towards rapid electric conductivity, abundant storage capacity, and fast kinetic conversion, are greatly desirable [21–29].
Nanocarbons possess benign skeletons with high electric conductivity, and rich porosity for abundant iodine storage. The regulation in the inherent electronic structures is also able to offer favorable active sites. The catalyst family is thus promising to invoke new opportunities for high-performance cathodes towards optimal Zn-I2 batteries. Great plane conjugation of sp2 carbon can provide high-speed pathways for electron conductivity [30–32]. The change of bond polarity via heteroatom doping could regulate the electronic structures towards favorable iodine adsorption and conversion [33,34]. For example, nitrogen possesses moderate electronegativity and polarity, of which doping is thought can efficiently regulate the electronic structures of carbon sites with benign cathodic iodine chemistry [35,36]. Besides the intrinsic characteristics, the extrinsic physicochemical properties also play a vital role in cathodic iodine chemistry [37]. Rich porosity can afford abundant volume for iodine storage and also the inhibition in material shape change. High surface areas benefit full exposures of active centers [38–40]. Designed porosity can also contribute suitable interfacial micro-environments such as favorable surface wetting, strong interfaces for enhanced charge and electron transportation [41–44]. However, despite the benign constructions of porous carbon materials, such as abundant pores, high surface areas, and structural hierarchy, the exclusive investigation in the structure-property mechanism between precise pore diameter distributions and Zn-I2 battery performance is rarely reported, but is of great significance for the rational design of the cathodes towards optimal Zn-I2 batteries.
In this contribution, a clear structure-performance mechanism that ~2.5 nm pore structure of nanocarbons have a great contribution to I2 adsorption and fast polyiodide conversion is innovatively elucidated, via scrupulously systematic design of materials with well controlled pore structures. It is contributed by a smart synthetic methodology with H-bond-gifted uniform precursor and precise cooperation of different pore-forming agents. The incorporation of ~2.5 nm porosity leads to a greatly promoted iodine adsorption to be as high as 60.8 wt%, and fast polyiodide conversion with no obvious polyiodide like I3− and I5− detected during charge-discharge processes. As a result, the batteries based on the constructed cathode deliver impressive performances with a large specific capacity of up to 178.8 mAh/g and long stability more than 4000 h at 5.0 C. The findings provide new concepts in theory-guided catalyst design for high-performance Zn-I2 batteries, which is hoped to be enlightening for other advanced energy technologies like Li-S, Li-ion, and Al-I2 batteries.
The nitrogen-doped graphene architecture (NGA) is fabricated via a facile one-step carbonization method. A uniform precursor was firstly fabricated by the virtue of the designed H-bond interactions and networks, with glucosamine as carbon source, melamine as nitrogen source, and CaCO3 as well as KHCO3 as pore-generating agents. O- or N- containing functional groups and molecules like HO−, HCO3−, H2O, and C3H6N6 contribute the H-bond network. The synthesis is then completed by gentle drying, controlled carbonization, and purification. Nanocarbon flakes could be in-situ grown on CaO surfaces, generated by CaCO3 decomposition when carbonizing. Glucosamine possesses a fine molecular weight and abundant hydroxyl functional groups, facilitating H-bond formation and precisely bottom-up material design. Melamine has abundant N of as large as 66.6 wt%, serving as nitrogen resources. The N doping contributes a break in electric neutrality of carbon matrix, endowing benign activity. N possesses lone-pair electrons and unique electronegativity, of which doping in nanocarbons can attract part of electrons of the cooperated carbons to the doped nitrogens, delivering electropositivity to the carbons, which can server as the catalytic centers to iodine redox. The carbon sites with relatively strong electropositivity are generally thought to have the optimal catalytic activity. According to the XPS analysis, three main nitrogen-doping types are existed in the constructed catalysts, which are graphitic-N, pyrrolic-N, and pyridinic-N (Fig. S1 in Supporting information). Graphitic-N cooperates with three carbon atoms via a sp3 configuration, leaving the lone-pair electrons. The lone pair electrons can effectively attract the electrons of the cooperated carbons, delivering relative strong electropositivity for efficiently catalyzing iodine redox. Pyrrolic-N is in the five-member ring with the lone-pair electrons of N participating in the ring aromaticity, thus the nitrogen cannot attract the electrons of carbons efficiently. Pyridinic-N cooperates with two carbons via extended π bonds. The lone-pair electrons are not directly participated in the ring aromaticity, but can interact with the extended π bonds of the ring, leading to limited electropositivity of the cooperated carbons. Therefore, graphitic-N has the mostly electrocatalysis efficiency for iodine redox [45]. Benign pore structures like the ones with ~2.5 nm diameters can further inspire the potentials of the active sites, exhibiting great apparent catalytic activity. Besides, heteroatom doping can also induce the generation of defects, which are potential active sites as well. The precise cooperation of CaCO3 and KHCO3 pore-forming agents gifts a flexible tunability in the pore structures, allowing further accurate structure-performance mechanism investigation.
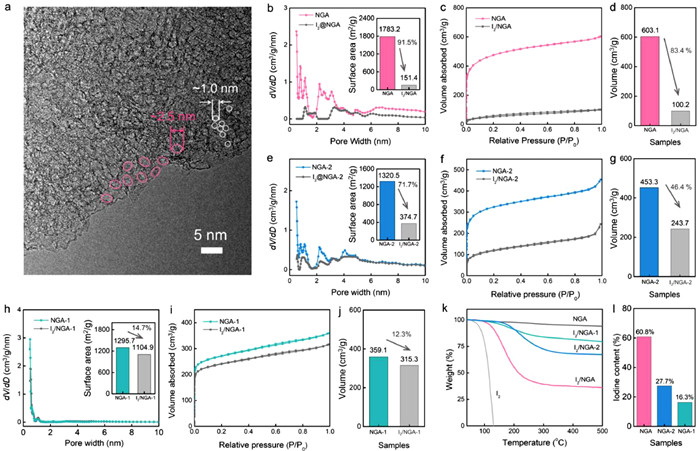
The morphology of NGA was revealed by high-resolution transmission electron microscope (HR-TEM). As shown in Fig. 1a, dense and uniformly distributed pore structures are observed over the whole graphene planes. Further analysis reveals two dominant types of pores, with diameters at ~1 nm and ~2.5 nm, respectively. Besides, there is only 2–5 graphene layers are observed in the lateral edges, suggesting an ultra-thin structure for the material. It can also be supported by the light TEM image contrast for the whole graphene plane. It facilitates a high surface area, opened pore structures, and full exposure of active sites, attributed by the smart in-situ growth on the metal oxide catalysts. The uniform distribution of the dense pores is contributed by the homogeneous mixture of the pore-generating agents and precursors, gifted by the well-developed H-bond network. Furthermore, the cooperation between the different pore-forming agents facilitates controllable pore structures. For example, the conjugation interactions between the cooperated pore-forming agents of CaCO3 and KHCO3 achieve a stable release of CO2 bubbles in pore generation. Moreover, KHCO3 prefers to generate small pores and CaCO3 trends to create relatively large ones in nanocarbons. NGA is synthesized via employing a moderate ratio of KHCO3 and CaCO3 to be 5:1. As a result, controllable and uniformly dispersed pores are well constructed over the whole nanocarbon flakes. Notably, the ~1 nm and ~2.5 nm pores could be mutually promoted and transformed. ~1 nm micropores can be reconstructed to the large ones by regulating the pore-forming agents. In comparison, ~2.5 nm mesopores spontaneously prone to grow to the small ones with more stable sp2 carbons. As a result, the narrow pores can hardly be avoided in thermodynamics during high-temperature carbonization. With the aim to investigate the functions of various pores on iodine conversion chemistry under the condition that narrow ~1 nm pores unavoidably exist, two other reference samples denoted as NGA-1 and NGA-2 are rationally fabricated, with NGA-1 only possessing ~1 nm pores basically, NGA-2 obtaining dominant ~1 nm pores and some ~2.5 nm pores. The ratios of KHCO3 to CaCO3 pore-forming agents during the synthesis of NGA-1 and NGA-2 are 1:0 and 1:1, respectively. Consequently, NGA-1, NGA-2, and NGA see an obviously gradual increase in ~2.5 nm-pore share, and a decrease in ~1.0 nm-pore share in the materials. Additionally, the specific surface areas contributed by the macropores larger than 3.5 nm in NGA-1, NGA-2 and NGA are detected to be 68.9, 69, 6, and 83.5 m2/g, respectively, which are similar and take a small part of total surface areas in the each of samples. The well-controlled and systematically regulated pore structures allow the following pore structure-battery performance investigation clearly. The precisely systematic regulation and oriented synthesis are gifted by the smart design concept.
Figure 1
Figure 1.
Characterizations of the constructed NGA and reference samples. (a) High-resolution TEM image for NGA. (b) Pore distribution of NGA and the comparison of the specific surface area between the materials before and after I2 adsorption (the inset). (c) Pore volumes for NGA before and after I2 adsorption. (d) Pore volume change after I2 adsorption. (e) Pore distribution of NGA-2 and the comparison of the specific surface area between the materials before and after I2 adsorption (the inset). (f) Pore volumes for NGA-2 before and after I2 adsorption. (g) Pore volume change after I2 adsorption. (h) Pore distribution of NGA-1 and the comparison of the specific surface area between the materials before and after I2 adsorption (the inset). (i) Pore volumes for NGA-1 before and after I2 adsorption. (j) Pore volume change after I2 adsorption. (k) Thermal gravimetric analyzer curves of NGA and reference samples. (l) The comparison of I2 adsorbed content in the samples.
Aiming to confirm the pore configurations of the invested samples, nitrogen adsorption is employed to probe the porosity of NGA and the reference samples in statistics. As shown in Figs. 1b-j, NGA sees a dominant pore distribution at ~2.5 and ~1 nm, which is in good accordance with the TEM observation. In comparison, NGA-1 basically exhibits unique ~1 nm pores. NGA-2 gives a pore distribution with dominant ~ 1 nm and some ~2.5 nm pores. The specific surface area and pore volume are 1783.2 m2/g and 603.1 cm3/g for NGA (Figs. 1b-d), 1320.5 m2/g and 453.3 cm3/g for NGA-2 (Figs. 1e-g), and 1295.7 m2/g and 359.1 cm3/g for NGA-1 (Figs. 1h-j). After the adsorption of I2, NGA observes a sharply decrease in the surface area from 1783.2 m2/g to 151.4 m2/g (Fig. 1b inset). Furthermore, ~2.5 nm pore saw a prominently more decrease than ~1.0 nm ones in pore distribution configuration (Fig. 1b). The results indicate benign iodine adsorption performance in the ~2.5 nm pore structure. This phenomenon is also supported by the greatly reduced pore volumes after I2 adsorption on the samples with more ~2.5 nm pore share. NGA-1, NGA-2, and NGA deliver a gradual decrease in pore volumes, with a reducing ratio to be 12.3%, 46.4%, and 83.4%, respectively (Figs. 1d,g and j). During I2 adsorption, the initial anchor prefers occurring on the sites with broken electric neutrality, leading to relatively uneven growth and even the generation of iodine dendrites. It would be even worse in the practical battery environments under the influence of electric fields. In the case of large pores, the ones are not easy to be blocked, but the surface area and pore volume which can afford for I2 adsorption are limited theoretically on the one hand. On the other hand, the pore volume far away from the material surfaces is hard to be utilized in Zn-I2 battery, due to the poor ion and electron conductivity of iodine layer. Furthermore, the aggregation of iodine in the large pores and worse electron transport prone to result in the polymerization and slow conversion of polyiodide (Fig. S2 in Supporting information). In comparison, too narrow pores although have a relatively large surface area, pore volume, and benign electric conductivity for adsorbed I2, the pores are easy to be blocked, leading to a low pore-utilizing efficiency. As a result, the pores with moderate diameters like ~2.5 nm could give a great contribution to I2 adsorption. The large-scale scanning electron microscope (SEM) images for NGA before and after I2 adsorption show a uniform iodine distribution on the whole NGA plane, indicating homogeneous adsorption of iodine, with no apparent aggregated iodine particles is observed (Figs. S3 and S4 in Supporting information). It manifests the advantages of ~2.5 nm pore structure in iodine uniform adsorption. Diffraction of X-rays (XRD) of NGA indicate similar results to those after I2 adsorption, corroborating the uniform adsorption of iodine (Fig. S5 in Supporting information). The Raman analysis for NGA shows an ID/IG value of 0.93. This value increased to 0.99 after the adsorption of iodine, implying the preferring adsorption of iodine on the nitrogen-adjacent sp2 carbons (Fig. S6 in Supporting information). The nitrogen-adjacent sp2 carbons, the defects, and the combinations of the two sites can serve as the active centers for iodine adsorption and conversion. Contributed by the benign iodine adsorption behavior, gifted by the ~2.5 nm pore structure, NGA observes the most iodine weight loss of 60.8% in thermogravimetric results (Figs. 1k and l) in comparison to NGA-2 and NGA-1, which is 27.7% and 16.3%, respectively. It highlights the great contribution of ~2.5 nm pore structure to the iodine adsorption.
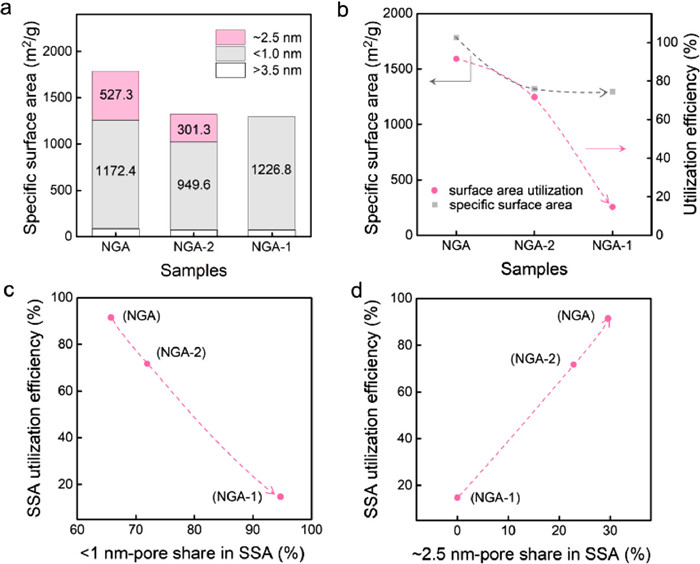
To quantitatively distinguish the contributions of different pore structures to I2 adsorption, scrupulous analysis for the different contributions of the various pore structures to the specific surface area is conducted. As shown in Fig. 2a, ~2.5 nm pores have a prominent contribution and share to the specific surface area for NGA, affording 527.3 m2/g and 29.6%, respectively. The values are greatly higher than those of the reference samples, which are 301.3 m2/g and 22.8% for NGA-2, and almost 0 for NGA-1. The specific surface areas from the pores less than 1.0 nm are 1226.8, 949.6, and 1172.4 m2/g in NGA-1, NGA-2, and NGA, respectively, accounting for 94.7%, 71.9%, and 65.7% in the each of samples. The specific surface areas contributed by the macropores larger than 3.5 nm in NGA-1, NGA-2 and NGA are detected to be 68.9, 69.6, and 83.5 m2/g, respectively, which are similar and take a small part of the total surface areas in the each of samples. The samples in the order of NGA, NGA-2, and NGA-1 saw a little decrease in overall specific surface areas (Fig. 2b), but a dramatic reduction in the utilization efficiency of surface areas. The utilization efficiency refers to the percentage of the remained specific surface areas after I2 adsorption to the pristine ones. Moreover, with the increase of the ~1 nm-pore share in the specific surface area from NGA, NGA-2 to NGA-1, the utilization is considerably decreased (Fig. 2c). In comparison, the value sees a significantly increase when the ~2.5 nm-pore share is slightly increased (Fig. 2d). These results can be also confirmed by the similar change tendency in pore volumes (Figs. S7-S9 in Supporting information), fully highlighting the great contribution of ~2.5 nm pores to iodine adsorption. Controlling pore distribution of nanocarbons is significant but challengeable. Macropores like the ones from nano-particle stacking is unavoidable. Different-size pores also occur mutual transformations with forming more stable sp2 carbons. It is the reason why the clear relationship mechanisms between specific pore distributions and Zn-I2 battery performances are greatly critical but rarely reported. The characterizations and analysis above comprehensively indicate the successful construction of the nanocarbons with precisely controlled pore structure and the great contribution of ~2.5 nm pores to iodine adsorption. The accurate and systematically tunable pore structures, and benign iodine adsorption performance allow further investigation to the performance-relationship mechanism between the pore structures of cathodic materials and Zn-I2 batteries clearly.
Figure 2
Figure 2.
The relationship investigations between iodine adsorption and pore diameters. (a) Contributions of pores with different diameters to specific surface areas. (b) The surface area utilization efficiency of the different samples. (c) The change tendency of specific-surface-area utilization efficiency alone with <1.0 nm-pore contribution for the invested samples. (d) The change tendency of specific-surface-area utilization efficiency alone with ~2.5 nm-pore contribution for the invested samples.
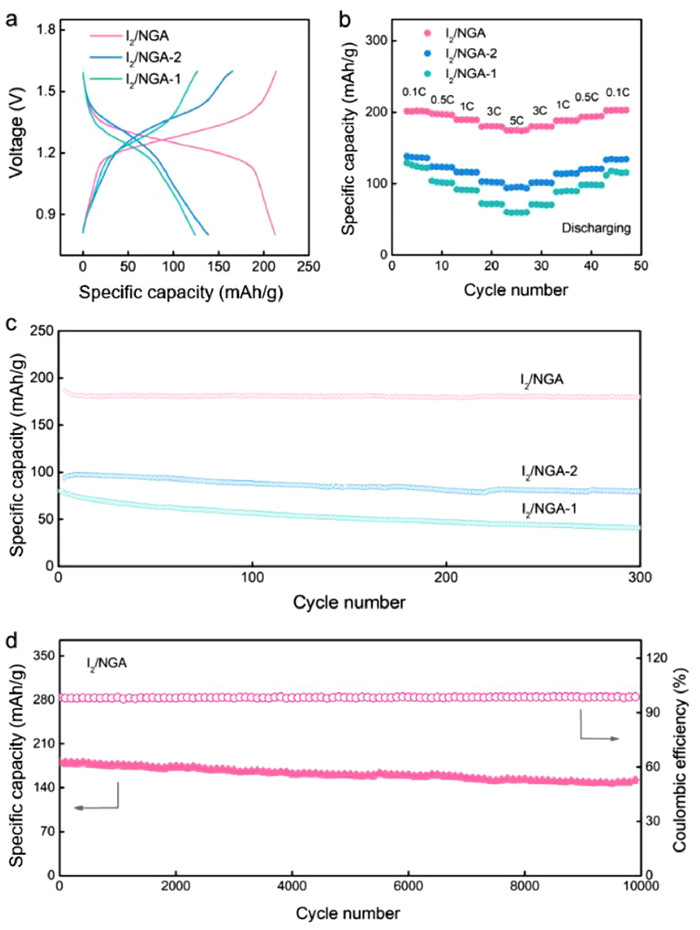
Zn-I2 batteries were assembled using I2 adsorbed NGA (I2/NGA) and reference samples as cathodes, polished zinc foil as anode, and aqueous ZnSO4 solution as electrolyte. Fig. 3a shows the galvanostatic charge-discharge plots for the battery based on I2/NGA. The battery saw a high and flat voltage plateau at 1.26 V (Fig. 3a). The specific capacity can reach up to 213.9 mAh/g at 0.1 C, indicating benign battery performance and reversibility. This value is larger than those of the batteries based on I2/NGA-1, and I2/NGA-2, determined to be 124.2 mAh/g and 138.4 mAh/g, respectively, highlighting the advantages of ~2.5 nm pore structure for zinc-iodine batteries. The specific capacity slightly decreased to 178.8 mAh/g when the current density dramatically increased to 5.0 C, implying a high efficiency for the I2/NGA-based battery with great interfacial behavior and inhibited self-discharge process (Figs. S10-S12 in Supporting information). The batteries based on I2/NGA-1, I2/NGA-2, and I2/NGA saw a gradually reduced trend in the polarization configuration, reflected by the consequently decreased voltage gap value during charging and discharging processes, manifesting the contribution of ~2.5 nm porous structures. The rate performance was evaluated in a large change of current density scale from 0.1 C to 5.0 C. As shown in Fig. 3b, the battery based on I2/NGA delivered a specific capacity of more than 200.0 mAh/g at 0.1 C. It decreased to 178.8 mAh/g when the current density gradually increased to 5.0 C. This value can be well returned when the current density reduced back to 0.1 C, indicating a great high-rate performance. Furthermore, I2/NGA-based batteries deliver the highest specific capacity in the probed samples at a given current density, followed by I2/NGA-2 and I2/NGA-1 (Fig. 3c). The order is well accordant to the ~2.5 nm-pore shares in the samples. Besides activity and reversibility, durability is another significant merit for the batteries. As shown in Fig. 3d, the I2/NGA based battery gave a stable reversible specific capacity of 178.8 mAh/g tested at 5.0 C for more than 10,000 cycles and 4000 h, during which a Coulombic efficiency of almost 100% was well kept. In comparison, the batteries based on reference materials, especially I2/NGA-1, delivers an unsatisfied stability even during a relatively short-term test (Fig. 3c). The above comprehensive results deliver a benign battery performance based on I2/NGA cathodes, highlighting the advantages of ~2.5 nm pores to iodine adsorption and conversion.
Figure 3
Figure 3.
Zn-I2 battery evaluation based on NGA and reference samples. (a) Galvanostatic charge-discharge curves at 0.1 C rate. (b) Rate capability tested from 0.1 C to 5.0 C. (c) Specific capacity comparison between the batteries based on different samples. (d) Long-term cycle test for NGA-based batteries.
With the aim to reveal the structure-property relationship mechanism behind the high-performance batteries, the kinetics which is the key point of the storage and conversion of iodine were further probed. Electrochemical impedance spectroscopy was thus detected for the kinetics analysis. Fig. 4a shows the Nyquist plots of the batteries based on I2-adsorbed NGA and reference samples. An arc with greatly smaller radius was observed in the Nyquist plots for NGA-based zinc-iodine batteries, compared to the ones based on NGA-1 and NGA-2. The batteries based on the invested samples delivered typical semicircle shape arcs in high-frequency regions and diagonal lines in low frequency ones. The radius of the arcs reflects the charge transfer resistance (Rct) and the diagonal lines is related to ion diffusion. Batteries based on NGA-1, NGA-2, and NGA see an obviously gradual decrease in the arc radius, which is accordant to the degrees of the ~2.5 nm pore shares in the probed samples. It indicates an enhanced interfacial kinetics on I2/NGA than other samples. Moreover, I2/NGA delivers a more sloping diagonal line than I2/NGA-2 and I2/NGA-1, suggesting a promoted ion diffusion process. The results reflect a fast interfacial and diffusion kinetics on I2/NGA electrodes, implying the contribution of ~2.5 nm porosity to rapid kinetics in zinc-iodine batteries. Benign kinetic processes benefit fast and sufficient conversion of polyiodide intermediates. The conversion of iodide intermediates during the charge and discharge processes mainly occurs among I−, I3−, and I5−. The insufficient conversion in pore micro-environments leads to decreased utilization of I2 with low specific mass capacity. Fig. 4b shows the Cyclic voltammetry (CV) curve of I2/NGA after discharging at 5.0 C (Fig. 4c). A unitary pair of pronounced redox peaks were observed, assigned to the conversion of I and I−. No apparent other redox peaks are detected, implying a fast and sufficient conversion of I3− and I5− to I− on I2/NGA. It can be supported by the high-resolution I 3d XPS spectrum for I2/NGA after discharging (Fig. 4d, Figs. S13 and S14 in Supporting information). Two peaks at 620.2 eV and 619.1 eV were observed in the high-resolution I 3d5/2 spectrum, assigned to I2 and I−, respectively, which is well accordant to that of CV observation. To corroborate the kinetic results, scrupulous investigations on the iodine conversion during both the charge and discharge processes are conducted. Fig. 4e shows the charge-discharge processes of I2/NGA-based batteries. Raman measurements at all the different charge-discharge states shown in Fig. 4e observes no apparent characteristics peaks of I3− and I5−, expected to be 109.0 cm−1 and 160.0 cm−1, respectively (Fig. 4f). In comparison, the batteries based on the I2/NGA-1, the material basically possess only ~1.0 nm pores and no ~2.5 nm ones, provide distinguished characteristic peaks of I3− and I5−, suggesting a sluggish conversion of iodine conversion chemistry (Fig. 4g). The results above fully indicate fast kinetics of iodine conversion on NGA electrodes, highlighting the great contribution of the ~2.5 nm pore structures to the rapid conversion of polyiodide. This advantage benefits the utilization of active sites on the one hand, on the other hand, it effectively limits side reactions like carbon corrosion. Thus, the batteries based on NGA present higher performances and cycle stability than the ones based on NGA-1 and NGA-2.
Figure 4
Figure 4.
Benign battery performance arising from fast conversion of polyiodide. (a) Kinetic investigations of the invested samples. (b) The CV curve of NGA-based batteries during discharging process shown in (c). (c) The discharging process of the battery based on I2/NGA. (d) The high-resolution I 3d spectrum of I2/NGA electrodes when discharging. (e) Discharge and charge curves, in which the marked points were the configurations for Raman tests of the investigated samples. (f) Raman measurements of I2/NGA tested during charge and discharge processes. (g) Raman measurements of I2/NGA-1 tested during charge and discharge processes.
In summary, a new structure-property mechanism between pore structures and cathodic iodine chemistry is clearly elucidated towards optimal Zn-I2 batteries, via smart design and rational synthesis of greatly controllable nanocarbons systematically. The carbon architecture is well constructed via a facile one-pot method. The widespread H-bond interactions among precursor and pore-forming agents contribute a uniform mixing. The in-situ growth on metal oxides generated when carbonizing hinders lateral stacking of graphene layers and full exposure of carbon sites. The cooperation of different pore-forming agent further gifts elaborate tune in porous structure. Contributed by the well-defined and systematically tunable pore structures, a clear structure-property relationship mechanism is innovatively elucidated that ~2.5 nm pore structure has a great contribution to iodine storage and fast conversion. As a result, the zinc-iodine batteries based on the constructed NGA with abundant ~2.5 nm porosity delivers an impressive performance. The iodine adsorption content can reach up to 60.8 wt%. The capacity is as high as 178.8 mAh/g with a long-term stability more than 10,000 charge-discharge cycle for 4000 h at 5.0 C. This work provides new theory-guided design concepts for efficient zinc-iodine battery fabrication, which also inspires new opportunities for carbon materials and benefits other advanced energy systems.
Declaration of competing interest
The authors declare that they have no known competing financial interests or personal relationships that could have appeared to influence the work reported in this paper.
Acknowledgment
This work was supported by the Tianjin Natural Science Foundation of China (Nos. 20JCZDJC00280 and 20JCYBJC00380).
Supplementary materials
Supplementary material associated with this article can be found, in the online version, at doi:10.1016/j.cclet.2023.108697.
S. Xin, L. Gu, N.H. Zhao, et al., J. Am. Chem. Soc. 134 (2012) 18510–18513. doi: 10.1021/ja308170k
[41]
Y. He, M. Liu, S. Chen, J. Zhang, Sci. China Chem. 65 (2022) 391–398.
[42]
H. Liu, J.G. Wang, Z. You, et al., Mater. Today 42 (2021) 73–98.
[43]
C. Li, Z.T. Sun, T. Yang, et al., Adv. Mater. 32 (2020) 2003425.
[44]
X. Yang, J. Lv, C. Cheng, et al., Adv. Sci. 10 (2023) 2206077.
[45]
T. Liu, H. Wang, C. Lei, et al., Energy Storage Mater. 53 (2022) 544–551.
Figure 1
Characterizations of the constructed NGA and reference samples. (a) High-resolution TEM image for NGA. (b) Pore distribution of NGA and the comparison of the specific surface area between the materials before and after I2 adsorption (the inset). (c) Pore volumes for NGA before and after I2 adsorption. (d) Pore volume change after I2 adsorption. (e) Pore distribution of NGA-2 and the comparison of the specific surface area between the materials before and after I2 adsorption (the inset). (f) Pore volumes for NGA-2 before and after I2 adsorption. (g) Pore volume change after I2 adsorption. (h) Pore distribution of NGA-1 and the comparison of the specific surface area between the materials before and after I2 adsorption (the inset). (i) Pore volumes for NGA-1 before and after I2 adsorption. (j) Pore volume change after I2 adsorption. (k) Thermal gravimetric analyzer curves of NGA and reference samples. (l) The comparison of I2 adsorbed content in the samples.
Figure 2
The relationship investigations between iodine adsorption and pore diameters. (a) Contributions of pores with different diameters to specific surface areas. (b) The surface area utilization efficiency of the different samples. (c) The change tendency of specific-surface-area utilization efficiency alone with <1.0 nm-pore contribution for the invested samples. (d) The change tendency of specific-surface-area utilization efficiency alone with ~2.5 nm-pore contribution for the invested samples.
Figure 3
Zn-I2 battery evaluation based on NGA and reference samples. (a) Galvanostatic charge-discharge curves at 0.1 C rate. (b) Rate capability tested from 0.1 C to 5.0 C. (c) Specific capacity comparison between the batteries based on different samples. (d) Long-term cycle test for NGA-based batteries.
Figure 4
Benign battery performance arising from fast conversion of polyiodide. (a) Kinetic investigations of the invested samples. (b) The CV curve of NGA-based batteries during discharging process shown in (c). (c) The discharging process of the battery based on I2/NGA. (d) The high-resolution I 3d spectrum of I2/NGA electrodes when discharging. (e) Discharge and charge curves, in which the marked points were the configurations for Raman tests of the investigated samples. (f) Raman measurements of I2/NGA tested during charge and discharge processes. (g) Raman measurements of I2/NGA-1 tested during charge and discharge processes.

 DownLoad:


 下载:
下载:


