Figure 1.
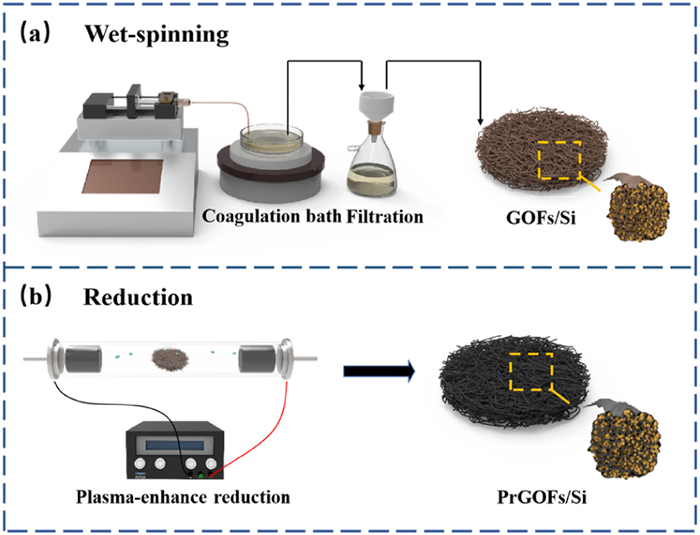
Schematic illustration of the preparation process of PrGOFs/Si anode: (a) Wet-spinning process and (b) plasma-enhanced reduction process.
Plasma enhanced reduction method for synthesis of reduced graphene oxide fiber/Si anode with improved performance
Yihong Li , Zhong Qiu , Lei Huang , Shenghui Shen , Ping Liu , Haomiao Zhang , Feng Cao , Xinping He , Jun Zhang , Yang Xia , Xinqi Liang , Chen Wang , Wangjun Wan , Yongqi Zhang , Minghua Chen , Wenkui Zhang , Hui Huang , Yongping Gan , Xinhui Xia

Lithium ion batteries (LIBs) have achieved widespread application with the emerging consumption of energy storage system (e.g., electric vehicles (EVs) and hybrid electric vehicles (HEVs), electronic devices, and grid-scale energy storage [1-6]. Si anode is considered as one of the leading anode candidates for the next-generation high-capacity LIBs owing to its high theoretical specific capacity (~4200 mAh/g), abundant reserves (the second most abundant element), low discharge potential, and environmental friendliness [7-12]. However, several critical bottlenecks further impede its practical applications: (1) Large volume expansion of Si particles during alloying processes. This causes particle pulverization, loss of electrical contact with collectors, and instable solid electrolyte interphases (SEIs), leading to unstable cycling stability. (2) Low intrinsic electrical conductivity, resulting in unsatisfactory reaction kinetics and undermined high-rate performance. Thus, developing a novel and controllable preparation technology is essential for construction of high-performance silicon-based composite anodes [13,14].
To date, several electrode design strategies have been adopted to enhance the electrochemical properties of Si anodes, including nanostructure design and conductive composite design. Among these, nano-sized Si materials have attracted tremendous attention in virtue of shortened Li transportation and released volume change and accelerated ion/electron transportation. To further enhance the electrical conductivity of Si-based anodes, carbonaceous materials (e.g., amorphous carbon [15], graphite [16], carbon nanotubes [17], carbon nanofibers [18], and graphene [19]) with high conductivity and structural stability are introduced as the conductive skeleton to form Si/C composites. However, the conventional Si/C electrodes with polymer binders show limited volume release ability and can easily cause the detachment of active materials from the current collector, leading to a rapid deterioration on battery performance. Therefore, the preparation of self-supported Si/C electrodes is an effective way to solve these problems. Until now, various methods have been applied to fabricate self-supported silicon anodes, such as coating-drying method [20], layer-by-layer filtration [21,22], electrochemical spinning [17], wet-spinning [23]. Among them, wet-spinning using graphene oxide (GO) solution as precursor is one of the most attractive strategies to fabricate fiber materials and self-supported electrode materials owing to its cost effectiveness and ease of fabrication compared to other technologies. Moreover, the spun fiber presents a highly ordered liquid crystal structure under the influence of shear forces, which can effectively construct a porous 3D carbon framework for fast electron/ion transport and accommodation of Si nanospheres after reduction [24-26].
It has been reported that there are different bonds/groups on the surface of GO, including dangling bonds, vacancies and oxygen functional groups, which adversely affect cell performance [27]. According to the reported literature, thermal and chemical reduction are two primary methods for conversion of GO to rGO. However, plasma can also effectively reduce graphene oxide. For instance, Yong et al. proposed that the electrochemical performance of reduced graphene oxides (rGOs) prepared by three reduction methods (thermal, chemical and plasma) is highly dependent on the quality of rGO reduction, especially on the degree of defects and oxygen-containing functional groups [6,28]. After comparison, plasma treatment stands out as a method that shows higher efficiency and thoroughness in removing oxygen-containing functional groups from graphene oxide, surpassing alternative techniques. Thus, plasma contains high-energy activated atoms, ions, and radical species, which are considered as an efficient and suitable alternative for the reduction of materials [29-31]. In virtue of the plasma technique, these active radicals would react with the residual functional groups and the substituted solution (ethanol), thus improving the electron conductivity and specific surface area of the PrGOFs framework, which can further release the volume transition and accelerate the electrochemical reaction kinetics. In addition, plasma technology is a highly efficient and environmentally friendly process with low energy consumption without using solvents or altering the inherent properties of materials [32,33]. Interestingly, the entire treatment can be realized in a few minutes, which can greatly improve the preparation efficiency and reduce the preparation time. These exceptional characteristics position plasma technology as a promising prospect in the field of material reduction and modification [34-37].
In our case, we first proposed a novel self-supported and binder-free PrGOFs/Si composite anode prepared by wet-spinning and plasma-enhanced reduction technology. In this unique structural design, PrGOFs not only provide sufficient space to buffer the severe volume expansion of SiNPs, but also act as a flexible 3D conductive network and current collector to greatly enhance the conductivity of the electrode material. As a result, the prepared PrGOFs/Si anode exhibits a reversible capacity of 698.3 mAh/g and maintains a specific capacity of 602.5 mAh/g at 200 mA/g even after 100 cycles, superior to TrGOFs/Si counterparts. In addition, the implementation of plasma technology can effectively improve the reduction quality and preparation efficiency. From an industrial perspective, both wet-spinning and plasma technologies offer advantages such as scalability, cost effectiveness and high efficiency, which predict their potential for commercial applications. Therefore, the combination of these two technologies has a positive impact on the scalable preparation of self-supported and binder-free SiNPs/carbon composites, thus promoting the commercial application of high-performance Si-based anodes.
The primary fabrication process of the PrGOFs/Si anode is depicted in Figs. 1a and b, which can be divided into two simple steps. Firstly, a self-supported composite of GOFs/Si is prepared. This is done by initially mixing SiNPs with anisotropic GO liquid crystals (GOLCs) solution. The mixture is then extruded through a conical spinning needle during the wet-spinning process, where it is arranged in an orderly fashion via extrusion/shear processes. Subsequently, the solution is injected into the coagulation bath, leading to gelation and the formation of well-arranged fibers with a grid-like structure composed of SiNPs wrapped in GO sheets. After vacuum filtration, atmospheric pressure induces fibers intertwining and the material is then dried to volatilize its internal liquid component and reduce its size. Ultimately, a self-supported and flexible GOFs/Si electrode is obtained. Afterwards, the GOFs/Si material is subjected to H2 plasma treatment to achieve reduction and prepare PrGOFs/Si. The digital photos of this process are shown in Fig. S2a (Supporting information). Following plasma-enhanced reduction treatment, a small disc with an area of 0.785 cm2 is punched from the resulting PrGOFs/Si electrode material while the remaining portion maintains its integrity. Moreover, the prepared electrode material can also maintain its structural integrity after a bending test (Figs. S2b and c in Supporting information), which demonstrates the outstanding flexibility of PrGOFs/Si, making it an excellent candidate for free-supporting anodes.
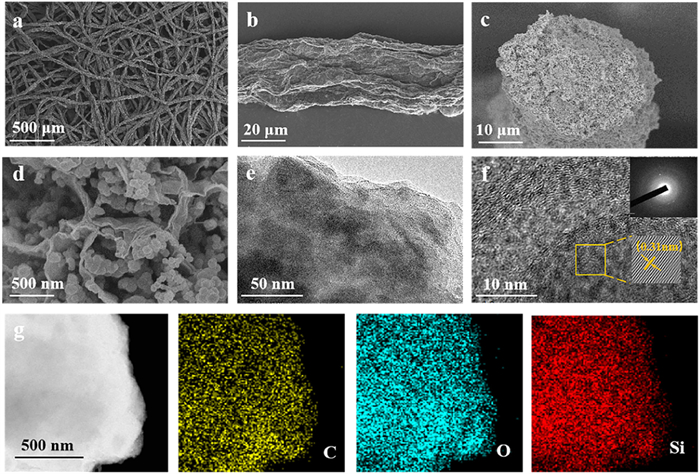
Fig. 2 presents the morphological characteristics of the GOFs/Si composites, which show a 3D network structure consisting of interconnected fibers (Fig. 2a). The diameter of a single microfiber is typically in the range from 20 µm to 40 µm, controlled by the size of the conical spinning needle. During the spinning process, shear forces cause the GO sheets to produce numerous wrinkles and stacks, which can be observed on the surface of the single microfiber (Fig. 2b and Figs. S3b-d in Supporting information). However, after integrating SiNPs, the degree of surface wrinkling in GOFs/Si is significantly reduced compared to the GO microfiber. The absence of discernible SiNPs on the surface of the fibers indicates successful incorporation of SiNPs. The cross-sectional image of GOFs/Si, as shown in Figs. 2c and d, clearly displays a grid-like structure. The abundant wrinkles of stacked graphene facilitate strong interface bonding and provide ample space for wrapping SiNPs into graphene fibers, thereby accommodating the significant volume expansion of SiNPs during lithiation and de-lithiation processes. Figs. 2e and f display the TEM-HRTEM and selected area diffraction (SAED) patterns of GOFs/Si, revealing that the SiNPs are well enveloped by graphene sheets. The well-defined lattice spacing of 0.31 nm, corresponding to the (111) plane of the Si crystal (JCPDS No. 77–2108), indicating that the crystallinity of SiNPs is preserved. Moreover, the SAED pattern of GOFs/Si displays a prominent diffuse ring feature, indicating an amorphous proportion attributed to the presence of sp3 carbon atoms formed during the oxidation process [38]. As shown in Fig. 2g, the Energy dispersive X-ray spectroscopy (EDX) elemental mapping images of GOFs/Si further demonstrate the homogeneous distribution of C, O, and Si atoms, indicating the evenly dispersion of SiNPs and the high oxidation degree of graphene.
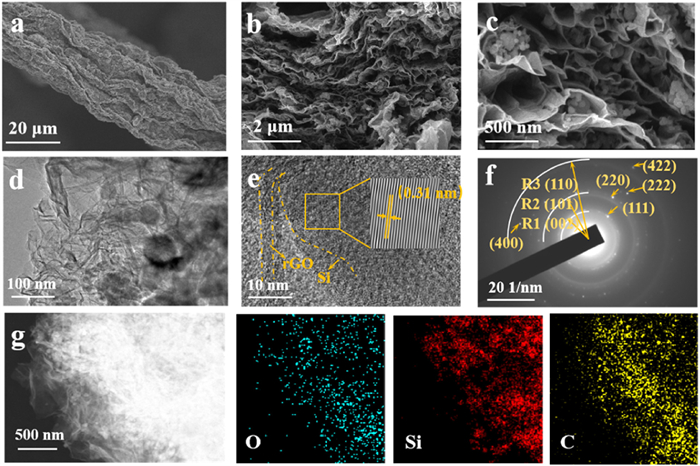
The plasma-enhanced method was utilized in our work to reduce GOFs/Si. In this self-supported electrode, the conductivity and integrity of the fibrous structure are crucial factors to consider. This is because graphene primarily functions as a conductive backbone and buffering medium. Therefore, the parameters of the plasma treatment (treatment power and time) were chosen based on the aforementioned evaluation criteria. To characterize the carbon allotropes and disordered variations of different samples, Raman spectroscopies were used (Fig. S4 in Supporting information). Specifically, the D band at around 1365 cm−1 and the G band at approximately 1580 cm−1 are of significance for carbon materials. The D band, indicating typical defects attributed to the structural edge effects, is arising from a breathing mode of rings or K-point photons of A1g symmetry, in terms of the G band, relating to the graphite carbon structure, it corresponds to the first order scattering of E2g phonon of sp2 C atoms at the Brillouin zone center. The ratio of the D to G bands (ID/IG) is usually considered as an important parameter to characterize the disorder or extent of graphitization of the carbonaceous materials, and the degree of graphitization is closely related to the electrical conductivity of the electrode material simultaneously [39-41]. The intensities of ID/IG simultaneously increase as the processing time prolongs (1, 5, and 10 min) at a treatment power of 100 W, indicating that longer processing time will bring more defects, (the ID/IG ratio of samples at different treatment parameters is listed in Table S1 in Supporting information). The occurrence of this phenomenon can be attributed to the etching effect of plasma. With increased processing time, the energy of plasma will simultaneously increase, resulting in more drastic etching effects on the samples [30]. The etching effect of the plasma can also be clearly observed through the SEM images under different treatment systems (Figs. 3a-c and Fig. S5 in Supporting information). With the prolongation of the treatment time, it can be observed that the degree of damage to the graphene layer wrapped outside the microfiber steadily worsens, eventually exposing the inner encapsulated SiNPs. All of the samples could still maintain their inner grid-like structure after different treatments in terms of the cross-section view. This can be attributed to the fact that plasma treatment is more effective on the surface of the material and causes less damage to the inner structure. It is worth noting that the microfiber exhibits a higher degree of graphitization at lower treatment times, which is more advantageous for its function as a conductive skeleton. Obviously, the surface morphology of the microfiber is finest when processing at 100 W and 1 min (Figs. 3a-c), which is more conducive to its role as Si host. Therefore, we finally choose a treatment parameter of 100 W and 1 min for consideration of the conductivity of the Si loaded substrate and its structural integrity. In comparison, SEM images of TrGOFs/Si are shown in Figs. S8a and b (Supporting information). Figs. 3d-g depict the TEM images of PrGOFs/Si at 100 W and 1 min, from which it can be clearly observed that SiNPs are well wrapped and anchored in the curved graphene sheets from low-resolution TEM image (Fig. 3d). High-resolution TEM image (HRTEM) in Fig. 3e displays a typical lattice spacing of 0.31 nm, corresponding to the (111) lattice planes of Si (JCPDS 77–2108). And its further SAED pattern in Fig. 3f shows several distinct diffraction rings, which relate to the (111), (220), (222), (400), and (422) lattice planes of Si, and the (002), (101), and (110) diffraction rings can be attributed to the rGO (JCPDS No. 89–8487), the lower divergence of the diffraction rings also indicates that a better reduction degree of graphene oxide (GO) is obtained after plasma-enhanced reduction. All of these results prove that the SiNPs are anchored on the graphene matrix. Furthermore, Fig. 3g reveals the uniform distribution of Si in the graphene matrix through TEM elemental mappings.
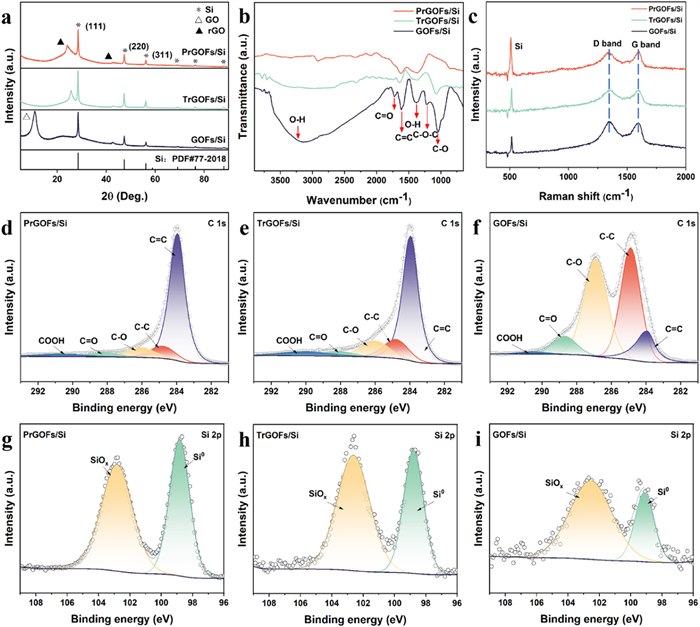
X-ray diffraction (XRD) was used to investigate the crystalline information of PrGOFs/Si, TrGOFs/Si, and GOFs/Si samples. Fig. 4a shows the detected peaks at 28.4°, 47.3°, and 56.1°, which correspond to the crystal planes of Si (111), (220), and (311) (JCPDS No. 77–2108), respectively. This indicates the successful incorporation of SiNPs into PrGOFs/Si, TrGOFs/Si, and GOF/Si samples. After both thermal reduction and plasma-enhanced reduction treatment, the reflection peak at 10.9°, attributed to GO (JCPDS No. 82–2261), vanished and is replaced by a new diffraction peak at about 24°−26° (which can be ascribed to the graphene (002) crystal plane), indicating that GO had been successfully reduced. Compared with the TrGOFs/Si, the graphene peak of the PrGOFs/Si shifts from 26° to 24°, meaning the interlayer distance of graphene increases after plasma treatment [23]. The nitrogen adsorption isotherms of both samples exhibit a typical Type IV curve (Figs. S6a and b in Supporting information), with a sharp capillary condensation step occurring at a relative pressure (P/P0) of 0.4 to 0.6, indicating the presence of a mesoporous structure. As illustrated in Figs. S6c and d (Supporting information), the pore size distribution of both PrGOFs/Si and TrGOFs/Si samples is similar, about 3.4 nm. But the specific surface area of PrGOFs/Si is about 152.4 m2/g, higher than the TrGOFs/Si sample (107.4 m2/g), attributed to the rapid reduction process by plasma treatment, which can cause rapid escape of small molecules within the graphene oxide, thereby generating a richer porous structure. FTIR spectra of PrGOFs/Si, TrGOFs/Si and GOFs/Si are shown in Fig. 4b. The characteristic peaks at about 3223, 1725, 1617, 1368, 1224, and 1048 cm−1 in GOFs/Si are attributed to O—H stretching, C=O stretching, aromatic C=C stretching, O—H deformation, epoxy C—O stretching, and alkoxy C—O stretching vibrations, respectively [40]. Generally speaking, these oxygen-containing functional groups should include -COOH and C=O located at the sheet edge, -OH and epoxy C—O on the basal planes of the GO sheets, which can seriously affect the electrochemical performance of the electrode by reacting with the electrolyte and resulting in irreversible lithiation and de-lithiation processes [42]. Although both plasma-enhanced and thermal reduction methods can remove oxygen-containing functional groups, the plasma-enhanced method is more thorough. Moreover, the existing C=C peak at about 1617 cm−1 in the spectra of PrGOFs/Si and TrGOFs/Si samples suggested that the sp2 structure of carbon atoms remained. Fig. 4c depicts the Raman spectroscopy of PrGOFs/Si, TrGOFs/Si and GOFs/Si. The characteristic peak of Si at 510 cm−1 is observed, which is consistent with the XRD results and indicates successful Si recombination. Additionally, the D and G bands provide significant information about the geometrical structure. Compared to GOFs/Si and TrGOFs/Si, a higher ID/IG ratio and intensified G band in PrGOFs/Si suggest that plasma-enhanced reduction effectively increases carbonaceous material graphitization (the ID/IG ratio of PrGOFs/Si, TrGOFs/Si and GOFs/Si is listed in Table S4 in Supporting information). XPS is generally adopted to survey the chemical compositional vibration of samples in detail. The high-resolution C 1s XPS spectra of PrGOFs/Si, TrGOFs/Si, and GOFs/Si samples are shown in Figs. 4d-f. The spectrum of the GOFs/Si sample presented five deconvolution peaks, corresponding to the C=C (284.0 eV), C—C (284.8 eV) in aromatic rings, epoxy C (C—O, 286.0 eV), carbonyl C (C=O, 288.0 eV), and carboxyl C (COOH, 290.0 eV), respectively [40]. For the PrGOFs/Si and TrGOFs/Si samples, the intensity of peaks assigned to oxygen-containing functional groups decreased significantly after reduction, indicating a considerable deoxygenation of GO. In XPS investigation, the change of C/O atomic ratio of rGO suggests the reduction degree, and the C=C ratio is usually related to the conductivity of the materials. As indicated in Table S2 (Supporting information), the C/O atomic ratio of these samples increased from 2.55 to 7.55 and 7.73, respectively, while the C=C ratio increased from 9.59% to 61.16% and 71.12% after thermal reduction and plasma-enhanced reduction, respectively. The significant increased C/O atomic ratio and the proportion of C=C bonds signified an effective reduction of the GO, which not only mitigated the consumption of the electrolyte but also effectively elevated the conductivity of the sample through the restoration of the sp2 conductive network. The XPS results of GOFs samples under thermal and plasma-enhanced reduction show the same phenomenon as the PrGOFs/Si, TrGOFs/Si and GOFs/Si samples above (Fig. S7 in Supporting information). The XPS spectra of Si 2p are split into two parts (Figs. 4g-i): The peak at about 99.0 eV is attributed to the monatomic Si, while the other peak at about 103.0 eV is attributed to the SiOx (x ≤ 2), resulting from the unavoidable exposure to oxidation in the air [24,43]. Fig. S8 (Supporting information) depicts the FESEM image and corresponding EDS mappings of the cross-section view of PrGOFs/Si and TrGOFs/Si. The plasma-enhanced reduction is capable of more effectively reducing the oxygen content of the composite material (Fig. S8 and Table S3 in Supporting information). Additionally, to better demonstrate the enhanced electrical conductivity of the electrode material after plasma-enhanced treatment, the electrical conductivity test was conducted on the samples (Table S5 in Supporting information). The PrGOFs/Si sample shows an average electrical conductivity of 0.89 S/cm, superior to the TrGOFs/Si sample (0.20 S/cm). To achieve a more comprehensive comprehension of the mechanism underlying the plasma-induced elimination of oxygen functional groups, optical emission spectroscopy (OES) was utilized for analysis. As depicted in Fig. S9 (Supporting information), it can be observed that there are three distinct peaks of H2 plasma, corresponding to the peak of atomic hydrogen Hα at 656.3 nm and the Hβ at 486.1 nm. The enrichment peak at around 603.0 nm corresponds to an un-ionized H2 molecule. During the process, excited reactive radicals and energetic particles diffused along the induction coil and are effectively treated on the surface of the samples. Physical bombardment and chemical reactions coexist, which promotes the removal of oxygen functional groups on GO surfaces. Specifically, the glow plasma discharge generates a variety of reactive species, with H+, H2 and hydrogen radicals playing a primary role in reduction.
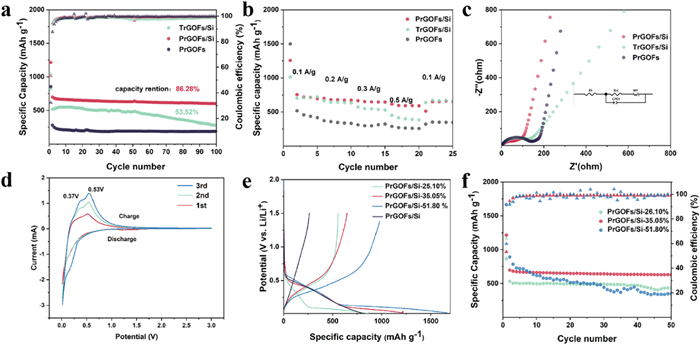
This study examined the influence of reduction treatment on the electrochemical performance of electrodes. As mentioned earlier, both the PrGOFs/Si and TrGOFs/Si anodes were derived from the same GOFs/Si material, differing only in their reduction methods. Fig. 5a demonstrates the cyclability comparison between PrGOFs/Si, TrGOFs/Si, and PrGOFs, with reversible specific capacities of 698.3, 519.8 and 188.7 mAh/g, respectively. Moreover, even after 100 cycles, PrGOFs/Si still maintained a specific capacity of 602.5 mAh/g while the specific capacity of TrGOFs/Si dropped rapidly to 278.2 mAh/g. The capacity retention rates for these two samples are 86.28% and 53.52%, respectively, indicating that PrGOFs/Si exhibits superior cycle performance compared to TrGOFs/Si. The rate performance of as-synthesized PrGOFs/Si, TrGOFs/Si, and PrGOFs samples were evaluated at various current densities ranging from 100 mA/g to 500 mA/g (Fig. 5b), the specific capacity of the PrGOFs/Si is much higher than that of the PrGOFs and TrGOFs/Si even at a high current density of 500 mA/g. When the current density is turned back to 100 mA/g, the specific capacity of PrGOFs/Si is also 654 mAh/g, indicating that the PrGOFs/Si anode exhibits best rate performance. Moreover, the performance enhancement is further evidenced by the electrochemical impedance (EIS) results (Fig. 5c), and the fitted charge transfer resistance (Rct) of the three samples is shown in Table S6 (Supporting information). It can be clearly observed that PrGOFs/Si anode illustrates the smallest semicircle (46.9 Ω), demonstrating the lowest charge transfer resistance than counterparts due to better conductive graphene matrix network obtained by plasma- enhanced reduction. Cyclic voltammetry (CV) analysis of different samples was conducted (0.2 mV/s, 0.01–3 V) for the initial three cycles (Fig. 5d and Fig. S10 in Supporting information). During the first negative scan, apart from the peak at approximately 1.2 V associated with the reductive decomposition of FEC in the electrolyte. For PrGOFs/Si and TrGOFs/Si anodes, a broad peak centered at 0.4 V linked to SEI film formation that is irreversible and disappears in subsequent cycles. The anodic peaks observed at 0.37 V and 0.52 V are predominantly attributed to the de-lithiation process, while the cathodic peak detected at 0.16 V is associated with the lithiation reaction of crystalline Si leading to LixSi formation [44,45]. Notice the PrGOFs/Si anode exhibits sharper redox peak and the larger peaks area, indicating its faster redox kinetics and higher capacity. PrGOFs anode exhibited no obvious specific peak as PrGOFs/Si and TrGOFs/Si. Furthermore, to investigate the influence of Si loading on the electrochemical performance, different mass loadings (26.10%, 35.05%, and 51.80%, TGA analysis can be observed in Fig. S11 in Supporting information) of the PrGOFs/Si anodes were prepared using identical synthetic procedures. These anodes were designated as PrGOFs/Si-26.10%, PrGOFs/Si-35.05%, and PrGOFs/Si-51.80%, respectively. The charge/discharge voltage curves are illustrated in Fig. 5e. All the PrGOFs/Si anodes exhibit a distinct long flat plateau attributed to the alloy reaction of Li with Si. By comparing the cyclic performance of the different Si loading samples (Fig. 5f), it is evident that an increase in Si content results in a corresponding rise in discharge specific capacity during the first cycle. However, the cycle performance exhibit a significant decline upon reaching a Si mass ratio of 51.80% because excessive Si content is not conducive to the construction of the conductive graphene network and would result in agglomerated dead Si. The PrGOFs/Si-35.05% anode shows an impressive specific capacity of 630.5 mAh/g with a retention rate of 90.26% after 50 cycles, which is attributed to the sufficient wrinkle spaces in the graphene fibers that are capable of accommodating the significant volume expansion of SiNPs during lithiation and de-lithiation. Regarding PrGOFs/Si-51.80%, the reversible capacity initially increases to 892.2 mAh/g, but subsequently decays rapidly to 351.7 mAh/g after 50 cycles with a capacity retention of only 39.4%. This emphasizes how excessive Si loading negatively affects electrode performance, leading to suboptimal utilization of Si and thereby impacting the cycle performance of the electrode. Areal capacity serves as a critical measure in evaluating battery performance. However, achieving heightened areal capacity in Silicon (Si) anodes remains a significant challenge, primarily due to volumetric expansion concerns during discharge and charge processes. Consequently, in addressing this hurdle, PrGOFs/Si electrodes with notably high areal densities of 12.1 and 15.2 mg/cm2 were meticulously engineered. Encouragingly, as depicted in Fig. S12 (Supporting information), the PrGOFs/Si electrode, boasting a mass loading of 12.1 mg/cm2, demonstrates a remarkable reversible areal capacity of 8.3 mAh/cm2 (equivalent to 660 mAh/g) at a current density of 0.8 mA/cm2. In order to further explore the potential application of the as-prepared PrGOFs/Si electrode, a full cell was assembled by coupling PrGOFs/Si anode with commercial LiFePO4 cathode. At 0.5 C (1 C=170 mA/g), the full cell achieves a high reversible specific capacity of 133.6 mAh/g, and remains a capacity retention of 80% after 30 cycles (Fig. S13 in Supporting information).
The stability of the unique self-supported fiber structure during cycling was verified by analyzing the morphology changes of different anodes after 100 cycles using SEM and TEM (Figs. S14a-d in Supporting information). From a macroscopic perspective, the cycled PrGOFs/Si anode maintains a stable 3D structure composed of interwoven fibers, without any discernible cracks on the fiber surface (Figs. S14a and b). This indicates that the fabricated fibrous structure network is inferred to possess sufficient strength to effectively mitigate the volume expansion of SiNPs during the de-lithiation and lithiation processes and maintain an electrically conductive path. As a result, the electrochemical performance of the anodes is significantly enhanced. TEM images of cycled PrGOFs/Si anode (Figs. S14c and d) also confirm that the SiNPs remain adhered to the graphene sheets after cycling, ensuring electrical contact and effectively suppressing capacity decay of the electrode material. Moreover, SAED images of the cycled PrGOFs/Si anode observes a transformation from crystalline to amorphous during the de-lithiation and lithiation processes. TEM elemental mapping images of cycled PrGOFs/Si (Fig. S14e in Supporting information) further demonstrate the homogeneous distribution of C, O, and Si atoms. Figs. 6a and b illustrate the mechanism of this unique structure and reduction method for enhancing the electrochemical performance of anodes. Specifically, the abundant wrinkles present in graphene fibers produced by wet-spinning provide sufficient space to accommodate the volume expansion of SiNPs during both de-lithiation and lithiation processes. Furthermore, the exceptional mechanical properties of graphene matrix ensure electrode structure stability, while its superior electrical conductivity enhances ion and electron diffusion kinetics within the anode. Additionally, plasma-enhanced reduction effectively reduces the residual oxygen-containing functional groups in GO, thereby enhancing the electrochemical performance of the anode.

In summary, a novel self-supported and binder-free PrGOFs/Si anode has been successfully fabricated through the integration of wet-spinning technology and plasma-enhanced reduction. The wet-spinning GOFs offer large space to accommodate the substantial volume expansion of the SiNPs while concurrently acting as a flexible 3D conductive network and current collector. The plasma reduction technolgy, in contrast to the conventional thermally reduction process, triggers distinctive physicochemical reactions during the swift reduction, resulting in a considerable augmentation of the specific surface area and conductivity of anodes, thereby enhancing the electrochemical performance. Consequently, the PrGOFs/Si anodes demonstrate a reversible capacity of 698.3 mAh/g and maintain a specific capacity of 602.5 mAh/g after 100 cycles. This study holds promising prospects for the scalable production of advanced self-supported Si/carbon anodes.
The authors declare that they have no known competing financial interests or personal relationships that could have appeared to influence the work reported in this paper.
This work is supported by Natural Science Foundation for Distinguished Young Scholars of Zhejiang Province (No. LR20E020001), National Natural Science Foundation of China (Nos. 52372235, 52073252, 22379020, 52002052, U20A20253, 21972127, 22279116), Science and Technology Department of Zhejiang Province (Nos. 2023C01231, Q23E020046, LD22E020006, and LY21E020005), Key Research and Development Project of Science and Technology Department of Sichuan Province (No. 2022YFSY0004), and Key Laboratory of Engineering Dielectrics and Its Application (Harbin University of Science and Technology), Ministry of Education (No. KFM 202202) and the Open Project Program of the State Key Laboratory of Photocatalysis on Energy and Environment (No. SKLPEE-KF202206), Fuzhou University.
Supplementary material associated with this article can be found, in the online version, at doi:
J.M. Tarascon, M. Armand, Nature 414 (2001) 359–367. doi: 10.1038/35104644
T. Zhang, C. Li, F. Wang, et al., Chem. Record. 22 (2022) e202200083. doi: 10.1002/tcr.202200083
J. Deng, C. Bae, A. Denlinger, T. Miller, Joule 4 (2020) 511–515. doi: 10.1016/j.joule.2020.01.013
C. Li, C. Zheng, F. Cao, Y. Zhang, X. Xia, J. Electron. Mater. 51 (2022) 4107–4114. doi: 10.1007/s11664-022-09687-4
X. Shan, Y. Zhong, L. Zhang, et al., J. Phys. Chem. C 125 (2021) 19060–19080. doi: 10.1021/acs.jpcc.1c06277
L. Huang, T. Guan, H. Su, et al., Angew. Chem. Int. Ed. 61 (2022) e202212151. doi: 10.1002/anie.202212151
P. Liu, B. Li, J. Zhang, et al., Chin. Chem. Lett. 34 (2023) 107946. doi: 10.1016/j.cclet.2022.107946
P. Sehrawat, A. Shabir, Abid, C.M.Julien, S.S. Islam, J. Power Sources 501 (2021) 229709. doi: 10.1016/j.jpowsour.2021.229709
F. Wang, G. Chen, N. Zhang, X. Liu, R. Ma, Carbon Energy 1 (2019) 219–245. doi: 10.1002/cey2.24
M.N. Ramdhiny, J.W. Jeon, Carbon Energy (2024) e356. doi: 10.1002/cey2.356
H. Wu, P. Gao, J. Mu, et al., Chin. Chem. Lett. 33 (2022) 3236–3240. doi: 10.1016/j.cclet.2021.10.039
P. Liu, Z. Qiu, F. Cao, et al., J. Mater. Sci. Technol. 177 (2024) 68–78. doi: 10.1016/j.jmst.2023.09.001
Y. Yang, W. Yuan, W. Kang, et al., Nanoscale 12 (2020) 7461–7484. doi: 10.1039/c9nr10652a
B. Deng, L. Shen, Y. Liu, et al., Chin. Chem. Lett. 28 (2017) 2281–2284. doi: 10.1016/j.cclet.2017.11.032
G. Fang, X. Deng, J. Zou, X. Zeng, Electrochim. Acta 295 (2019) 498–506. doi: 10.1016/j.electacta.2018.10.186
Z. Yan, H. Jin, J. Guo, Carbon Energy 1 (2019) 246–252. doi: 10.1002/cey2.8
X. Kong, S. Luo, L. Rong, et al., Inorg. Chem. Front. 8 (2021) 4386–4394. doi: 10.1039/d1qi00708d
X. Liu, J. Zhao, J. Wang, et al., J. Energy Storage 54 (2022) 105324. doi: 10.1016/j.est.2022.105324
W. Wang, L. Gu, H. Qian, et al., J. Power Sources 307 (2016) 410–415. doi: 10.1016/j.jpowsour.2016.01.010
L.F. Cui, L. Hu, J.W. Choi, Y. Cui, ACS Nano 4 (2010) 3671–3678. doi: 10.1021/nn100619m
Z. Luo, Q. Xiao, G. Lei, Z. Li, C. Tang, Carbon 98 (2016) 373–380. doi: 10.1016/j.carbon.2015.11.031
H. Zhang, S. Jing, Y. Hu, H. Jiang, C. Li, J. Power Sources 307 (2016) 214–219. doi: 10.1016/j.jpowsour.2015.12.107
F. Shao, H. Li, L. Yao, et al., ACS Appl. Mater. Interfaces 13 (2021) 27270–27277. doi: 10.1021/acsami.1c04277
Y. Zhang, Y. Cheng, J. Song, et al., Carbon 181 (2021) 300–309. doi: 10.1016/j.carbon.2021.05.024
B. Fang, D. Chang, Z. Xu, C. Gao, Adv. Mater. 32 (2020) e1902664. doi: 10.1002/adma.201902664
R. Tarcan, O. Todor-Boer, I. Petrovai, et al., J. Mater. Chem. C 8 (2020) 1198–1224. doi: 10.1039/c9tc04916a
Y. Ding, Z.A. Qiao, Adv. Mater. 34 (2022) e2206025. doi: 10.1002/adma.202206025
Y. Joshi, A. Umasankaran, C. Klaassen, M. AlAmer, Y.L. Joo, Electrochim. Acta 404 (2022) 139753. doi: 10.1016/j.electacta.2021.139753
A. Dey, A. Chroneos, N.S.J. Braithwaite, R.P. Gandhiraman, S. Krishnamurthy, Appl. Phys. Rev. 3 (2016) 021301. doi: 10.1063/1.4947188
Z. Qiu, S. Shen, P. Liu, et al., Adv. Funct. Mater. 33 (2023) 2214987. doi: 10.1002/adfm.202214987
S. Dou, L. Tao, R. Wang, et al., Adv. Mater. 30 (2018) e1705850. doi: 10.1002/adma.201705850
M. Magureanu, N.B. Mandache, F. Gherendi, et al., Catal. Today 366 (2021) 2–9. doi: 10.1016/j.cattod.2020.07.022
Q. Wang, M. Song, C. Chen, W. Hu, X. Wang, ChemPlusChem 77 (2012) 432–436. doi: 10.1002/cplu.201200070
V.K. Abdelkader-Fernández, M. Melguizo, M. Domingo-García, F.J. López-Garzón, M. Pérez-Mendoza, Appl. Surf. Sci. 464 (2019) 673–681. doi: 10.1016/j.apsusc.2018.09.121
C. Yang, J. Gong, P. Zeng, et al., Appl. Surf. Sci. 452 (2018) 481–486. doi: 10.1016/j.apsusc.2018.04.272
K. Akada, S. Obata, K. Saiki, Carbon 189 (2022) 571–578. doi: 10.1016/j.carbon.2021.12.074
D. Zhu, H. Pu, P. Lv, et al., Carbon 120 (2017) 274–280. doi: 10.1016/j.carbon.2017.05.032
Y. Tian, R. Mei, D.Z. Xue, X. Zhang, W. Peng, Electrochim. Acta 219 (2016) 781–789. doi: 10.1016/j.electacta.2016.10.055
M. Couzi, J.L. Bruneel, D. Talaga, L. Bokobza, Carbon 107 (2016) 388–394. doi: 10.1016/j.carbon.2016.06.017
C. Xu, X. Shi, A. Ji, et al., PLoS One 10 (2015) e0144842. doi: 10.1371/journal.pone.0144842
X. Zhang, B.I. Min, Y. Wang, et al., J. Phys. Chem. C 125 (2021) 15551–15559. doi: 10.1021/acs.jpcc.1c03209
Z. Xie, Z. Yu, W. Fan, G. Peng, M. Qu, RSC Adv. 5 (2015) 90041–90048. doi: 10.1039/C5RA17854A
Q. Shi, H. Wang, J. Zhou, et al., Nano Res. 15 (2022) 8146–8155. doi: 10.1007/s12274-022-4518-9
M. Bakierska, M. Lis, J. Pacek, et al., Carbon 145 (2019) 426–432. doi: 10.1016/j.carbon.2019.01.051
J. Zhou, Y. Lu, L. Yang, et al., Carbon Energy 4 (2022) 399–410. doi: 10.1002/cey2.176

Figure 1 Schematic illustration of the preparation process of PrGOFs/Si anode: (a) Wet-spinning process and (b) plasma-enhanced reduction process.

Figure 2 SEM images of (a) self-supported GOFs/Si fibers, (b) a single fiber of GOFs/Si, (c) cross-sectional view of GOFs/Si at low magnification, and (d) high magnification. (e, f) TEM and HRTEM images of GOFs/Si (the inset is the SAED image). (g) Elemental mapping of GOFs/Si.

Figure 3 Morphological characterization of PrGOFs/Si anodes treated by plasma parameters at 100 W, 1 min: (a-c) SEM images of single micro fiber of PrGOFs/Si at 100 W, 1 min. (d, e) TEM and HRTEM images of PrGOFs/Si at 100 W, 1 min. (f) SAED image, and (g) elemental mapping of PrGOFs/Si.

Figure 4 Compositional analysis of PrGOFs/Si, TrGOFs/Si and GOFs/Si: (a) XRD patterns. (b) FTIR spectra. (c) Raman spectra. High-resolution XPS spectra of (d-f) C 1s, and (g-i) Si 2p.

Figure 5 Electrochemical performances of different anodes: (a) Cycling comparison of PrGOFs/Si, TrGOFs/Si, and PrGOFs at the current density of 200 mA/g. (b) Rate performance of PrGOFs/Si, TrGOFs/Si, and PrGOFs. (c) Nyquist plots of PrGOFs/Si, TrGOFs/Si and PrGOFs (inset: equivalent circuit). (d) CV measurements of the PrGOFs/Si. (e) First-cycle charge/discharge voltage curves. (f) Comparison of cycle performance at different mass percentages.

 扫一扫看文章

扫一扫关注我们
 DownLoad:
 下载:
下载:
