 Figure 1.
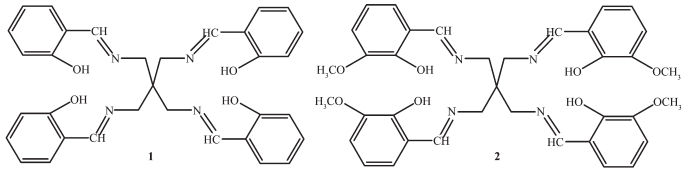
Structures of sensors 1 and 2
Figure 1.
Structures of sensors 1 and 2
Citation:
WANG Ruo, JIANG Guang-Qi. Two Tetrapodal Schiff Bases Acting as Colorimetric Sensors for Iron in Environmental Water Samples[J]. Chinese Journal of Inorganic Chemistry,
2017, 33(5): 881-889.
doi:
10.11862/CJIC.2017.079

两种四足席夫碱对环境水样中Fe (Ⅲ) 离子的比色识别
English
Two Tetrapodal Schiff Bases Acting as Colorimetric Sensors for Iron in Environmental Water Samples
Abstract:
Two colorimetric sensors, derived from pentaerythrityltetramine and salicylaldehyde (1) or o-vanillin (2), had been synthesized. Both sensors showed selective colorimetric sensing ability for Fe (Ⅱ) and Fe (Ⅲ) by changing color from light yellow to either orange or purple when immersed in water samples. The sensors coordinated to Fe (Ⅲ) with 1:1 stoichiometry, as has been confirmed from the results of LC-MS spectrometry and UV-Vis spectrum titration. The detection limits of sensors 1 (0.19 μmol·L-1) and 2 (0.21 μmol·L-1) are lower than the WHO guideline (5 μmol·L-1) in drinking water.
-
Key words:
- Schiff base
- / colorimetric sensor
- / iron
-
0 Introduction
According to recent research, the design and production of chemosensors for the detection of metal ions in aqueous solutions is an important area to develop, particularly with regards to sensors for the detection of heavy and transition metal cations[1-7]. Along with other transition metal ions, iron is an important element in living systems, as it plays crucial roles in the transport and storage of oxygen[8-9]. Iron is important because of its redox capacity in living systems, which can have a significant effect on homeostasis[10-11]. Iron can also promote development, increase resistance to disease, regulate tissue respira-tion, and prevent fatigue[12-13]. Thus, to design chemo-sensors for the detection of Fe (Ⅱ) and Fe (Ⅲ) in an aqueous medium is of great significance.
Many analytical techniques have been used to determine the content of metal ions, such as plasma atomic emission spectrometry[14], atomic absorption spectroscopy[15], and fluorescence[16-17], electro-chemical[18], gravimetric[19-20], and chromatographic[21] methods. Other analytical techniques are described in[22-23]. Most of these methods require the use of sophisticated equipment, multi-step sample preparation, and trained operators, all of which lead to high expenses. Colorimetric sensors present the advantage of having a low cost and of being easy to use. No expensive equipment is required and the analyte is detectable by the naked eye.
Schiff bases are good ligands for metal ions, with which they can form coordinate bonds. This characteristic has resulted in their extensive use in the production of sensors. The reported chemosensors for Fe (Ⅱ) and Fe (Ⅲ) in aqueous solution are rare[24-35]. In the present work, two tetrapodal Schiff bases with N and O donor atoms on the four pendant branches have been investigated to determine their ability in detecting the presence of common metal cations. Both 1 and 2 showed selective colorimetric sensing ability for Fe (Ⅱ) and Fe (Ⅲ) by changing color from light yellow to either orange or purple when immersed in the water samples. The detection limits of sensor 1 (0.19 μmol·L-1) and 2 (0.21 μmol·L-1) are lower than the WHO guideline (5 μmol·L-1) for drinking water. The deter-mination of the presence of Fe (Ⅲ) in a variety of environmental water samples was investigated.
Figure 1.
Structures of sensors 1 and 2
1 Experimental
1.1 Materials and instrumentation
Commercially available metal salts were purchased from Aldrich and Alfa Aesar Chemical Co., Ltd. The solutions of metal ions were prepared from chloride or nitrate salts of Fe2+, Fe3+, Co2+, Ni2+, Cu2+, Zn2+, Mn2+, Cr3+, Cd2+, Pb2+, Hg2+, K+, Ca2+ and Mg2+. Crystal structure was determined on a Bruker Apex 2 diffractometer. 1H NMR and 13C NMR (solvent CDCl3 or DMSO-d6) spectral analyses were performed on a JEOL-ECX 500 NMR spectrometer at room temperature using TMS as an internal standard. LC-MS was determined on an Agilent LC/MSD Trap based on infusion methods. UV-Vis absorption spectra were recorded on a UV-1800 spectrophotometer (Beijing General Instrument Co., China) in a 1 cm quartz cell.
1.2 Preparation of Schiff base
The Schiff bases 1 and 2 were prepared according to our previously described procedure[36-37].
1.3 Visual sensing of metal ions and UV-Vis study
Either sensor 1 or 2 (0.005 mmol) was dissolved in DMSO (Dimethyl sulfoxide; 50 mL). Fe2+, Fe3+, Co2+, Ni2+, Cu2+, Zn2+, Mn2+, Cr3+, Cd2+, Pb2+, Hg2+, K+, Ca2+ and Mg2+ (0.05 mmol) were dissolved in double-distilled water (50 mL), containing 1 mL of solution of either sensor 1 or 2; 0.5 mL of each metal salt solution were transferred to a 10 mL volumetric flask and diluted to the final volume of 10 mL with DMSO and double-distilled water to make the final solution (1: 5, nsensor / nmetal cations and 1: 9, VDMSO /VH2O). Significant color changes (from light yellow to orange for 1, to purple for 2) could be observed by the naked eye. After mixing for a few minutes, UV-Vis spectra were taken at room temperature.
1.4 Molar ratio method measurement of sensor 1 or 2 with Fe3+
Either sensor 1 or 2 (0.05 mmol) was dissolved in DMSO (50 mL), Fe (NO3)3·9H2O (20.2 mg, 0.05 mmol) was dissolved in double-distilled water (50 mL); 0.1~2.0 mL of Fe (NO3)3 solution were transferred to a 10 mL volumetric flask, 1 mL of the solution of either sensor 1 or 2 was added subsequently, and diluted to 10 mL with DMSO and double-distilled water to make the final solution (1: 9, VDMSO /VH2O). After mixing for a few minutes, UV-Vis spectra were taken at room temperature.
1.5 Job plot measurement
Either sensor 1 or 2 (0.05 mmol) was dissolved in DMSO (50 mL); 0.1, 0.2, 0.3, 0.4, 0.5, 0.6, 0.7, 0.8, and 0.9 mL of the solution of either sensor 1 or 2 were transferred to a 10 mL volumetric flask. Fe (NO3)3·9H2O (20.2 mg, 0.05 mmol) was dissolved in double-distilled water (50 mL); 0.9, 0.8, 0.7, 0.6, 0.5, 0.4, 0.3, 0.2, and 0.1 mL of the Fe (NO3)3 solution were added to each 10 mL volumetric flasks and diluted to 10 mL with DMSO and double-distilled water to make the final solution (1: 9, VDMSO /VH2O). After mixing for a few minutes, UV-Vis spectra were taken at room temperature.
1.6 Competitive experiments
Sensor 1 or 2 (0.05 mmol) was dissolved in DMSO (50 mL), and all the metal ions (0.05 mmol) were dissolved in double-distilled water (50 mL); 1.0 mL of the solution of either sensor 1 or 2 solution was trans-ferred to a 10 mL volumetric flask; 1.0 mL of Fe (NO3)3 solution and 1.0 mL of each other metal solution were added, then diluted to 10 mL with DMSO and double-distilled water to make the final solution (1: 1: 1, nsensor: nFe3+ : nother metal cations; 1: 9, VDMSO /VH2O). After mixing for a few minutes, UV-Vis spectra were taken at room temperature.
1.7 Determination of Fe3+ in environmental water samples
Environmental water samples were collected from a nearby river, water company, and spring water company. One milliliter of 1.0 mmol·L-1 Fe (NO3)3 solution was added to 8 mL of each environmental water sample using 10 mL volumetric flasks. Following this step, 1 mL of the 1.0 mmol·L-1 DMSO solution of either sensor 1 or 2 was added in each sample; 9 mL of each environmental water sample was mixed with 1 mL of the 1.0 mmol·L-1 DMSO solution of sensor 1 or 2 to carry out contrast experiments. The color changes of the artificial Fe (Ⅲ) containing environmental water samples could be observed easily.
2 Results and discussion
2.1 Detection properties of sensor 1 and 2 toward Fe2+ and Fe3+
We examined the detection abilities of sensors 1 and 2 in a series of metal ions such as Fe2+, Fe3+, Co2+, Ni2+, Cu2+, Zn2+, Mn2+, Cr3+, Cd2+, Pb2+, Hg2+, K+, Ca2+ and Mg2+ in a DMSO/H2O (1: 9, V/V) solution. Sensor 1 showed a significant color change, from light yellow to orange, in the presence of Fe2+ or Fe3+, while other metals caused no color change under identical conditions (Fig. 2a). Sensor 2 also showed a significant color change, from light yellow to purple, for Fe2+ or Fe3+ (Fig. 2b). Fig. 2c shows new absorption peaks at 482 nm and 488 nm in the presence of Fe2+ and Fe3+, respectively, for sensor 1; Fig. 2d shows new absorption peaks at 514 and 519 nm in the presence of Fe2+ and Fe3+, respectively, for sensor 2. These results are cons-istent with the changes of color in the Fe2+ and Fe3+ solution.
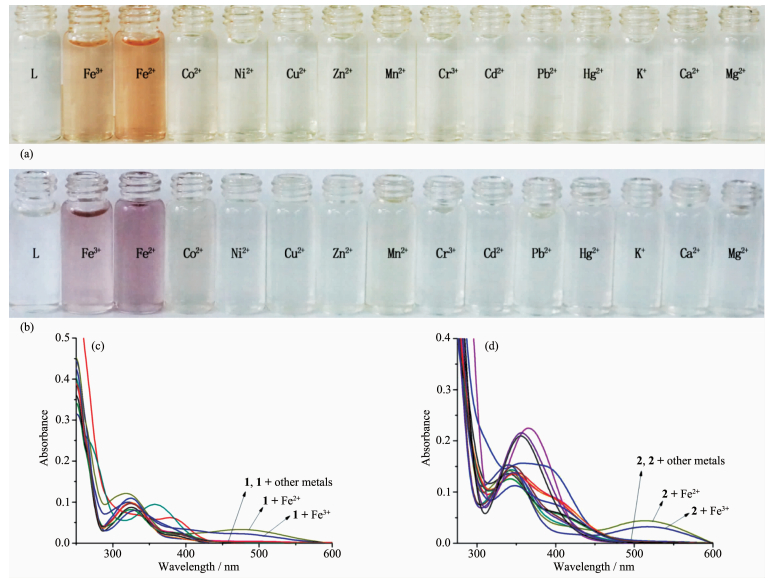 Figure 2.
(a) and (b) Color changes of sensors 1 and 2 (50 μmol·L-1) upon addition of various metal ions (5 equiv) in DMSO/H2O (1: 9, V/V); (c) and (d) UV-Vis absorption spectra of sensors 1 and 2 (10 μmol·L-1) in the presence of 5 equiv of different metal ions in DMSO/H2O (1: 9, V/V)
Figure 2.
(a) and (b) Color changes of sensors 1 and 2 (50 μmol·L-1) upon addition of various metal ions (5 equiv) in DMSO/H2O (1: 9, V/V); (c) and (d) UV-Vis absorption spectra of sensors 1 and 2 (10 μmol·L-1) in the presence of 5 equiv of different metal ions in DMSO/H2O (1: 9, V/V)
The binding properties of sensors 1 and 2 with Fe3+ were studied by UV-Vis titration. Upon the gradual addition of Fe3+ (0.0~1.0 equiv) to a solution of either sensor 1 or 2, new absorbance peaks appeared. For sensor 1, the new peak formed at 488 nm and kept increasing with a clear isosbestic point at 338 nm (Fig. 3a); for sensor 2, the new peak appeared at 519 nm and kept increasing with a clear isosbestic point at 345 nm (Fig. 3b). These changes in the UV-Vis spectra clearly indicated that new species formed during the titration of sensor 1 or 2 with Fe3+. The new peaks at 488 and 519 nm with molar extinction coefficients of 6.1×10³ and 4.4×10³ L·mol-1·cm-1, respectively, are higher than those relative to the Fe-based d-d transitions. Thus, these new peaks might be attributed to metal-to-ligand charge-transfer (MLCT)[38-39], which are responsible for the color changes of the solution.
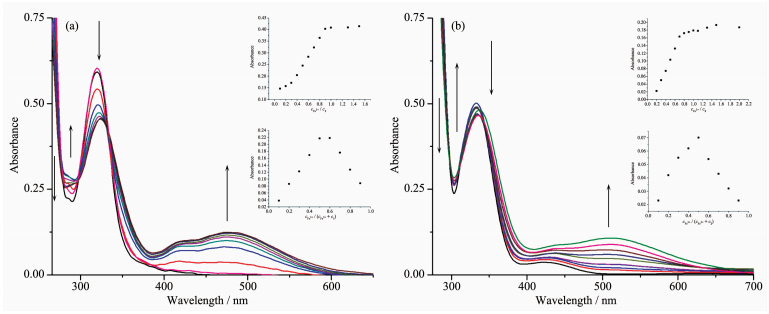 Figure 3.
UV-Vis absorption spectra of sensors 1 (a) or 2 (b) (0.1 mmol·L-1) with gradual addition of Fe3+ (0~1 equiv) in DMSO/H2O (1: 9, V/V) solution
Figure 3.
UV-Vis absorption spectra of sensors 1 (a) or 2 (b) (0.1 mmol·L-1) with gradual addition of Fe3+ (0~1 equiv) in DMSO/H2O (1: 9, V/V) solution
2.2 Evaluation of selectivity
Since selectivity is an important parameter in evaluating the behavior of an optical sensor, the interference effect of common coexistent metal ions was investigated on the detecting sensitivity of chemo-sensors towards Fe (Ⅲ). The results reported in Fig. 4a and 4b indicate that all the competing metal ions such as Ca2+, Cd2+, Co2+, Cr3+, Cu2+, Hg2+, K+, Mg2+, Mn2+, Ni2+, Pb2+, and Zn2+ did not interfere noticeably with naked-eye detection of Fe3+. These results indicate that the tested sensors can act specifically for the detection of Fe3+.
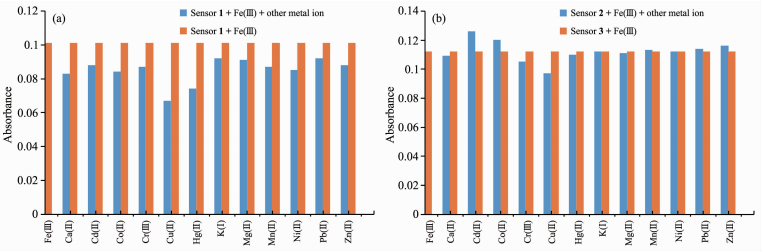 Figure 4.
Competitive selectivity of sensors 1 (a) or 2 (b) (0.1 mmol·L-1) towards various metal ions (0.1 mmol·L-1)
Figure 4.
Competitive selectivity of sensors 1 (a) or 2 (b) (0.1 mmol·L-1) towards various metal ions (0.1 mmol·L-1)
2.3 Stoichiometry and binding mode studies
The stoichiometry of metal complexes formed between the sensors and Fe3+ ions was determined by Job's titration method and the molar ratio method[40]. As shown in Fig. 3a and Fig. 3b, the maximum values of the absorbance curves were obtained at a 0.5 molar ratio, indicating 1: 1 stoichiometry of the resulting Fe (Ⅲ) complexes. The molar ratio method also showed the same results for these complexes. The stoichiometries of these complexes were further confirmed by LC-MS spectrometry analysis. The positive-ion mass spectrum of the sensors upon addition of 1 equiv of Fe3+ showed the formation of the sensor 1-3H++Fe3+ complex (m/z: 722.3; Calcd., 722.2) and the sensor 2-3H++Fe3+ complex (m/z: 602.2; Calcd., 602.15) (Fig. 5a and 5b, respectively). The crystal structure of sensor 1-3H++Fe3+ complex had also been obtained in our earlier work[36], which had clearly revealed the 1: 1 stoichiometry of the Fe (Ⅲ) complex (Fig. 5c). In this crystal structure, the Fe (Ⅲ) ion coordinated with imine nitrogen atoms (N (1), N (2), N (3)) and phenolic oxygen atoms (O (1), O (2), O (3)) from three pendant branches of sensor 1, located at the center of octahedral coordination sphere; meanwhile, one of the salicylaldimine pendant branches remained uncoordinated, and the phenolic OH and the imine nitrogen were intramolecularly hydrogen-bonded. Based on the UV-Vis titration, Job plot, and LC-MS analysis, as well as the crystal structure analysis, we confirmed the structures of the 1-Fe3+ and 2-Fe3+ complexes with 1: 1 stoichiometry. In addition, the binding constants (Ka) of sensors 1 and 2 with Fe3+ were calculated to be equal to 1.8×10⁴ and 8.5×10⁴, respectively, on the basis of Benesi-Hildebrand analysis. These values fall well within the range of 103 ~105, as previously reported for other Fe (Ⅲ) sensors[2, 41]. The detection limits of sensors 1 and 2 for Fe3+ ions were determined as 0.19 and 0.21 μmol·L-1, respecti-vely, based on the IUPAC definition (CDL=3Sb /m), well below the WHO guideline (5 μmol·L-1) for Fe3+ in drinking water. It is worth mentioning that the working curves for measurement of Fe3+ showed good linear relationships within the concentration range of 3~33 μmol·L-1 for both sensors (Fig. 6a and 6b). These results suggest that the tested sensors 1 and 2 can be adequately employed as probes for the detection of micromolar concentrations of Fe3+ in real water samples.
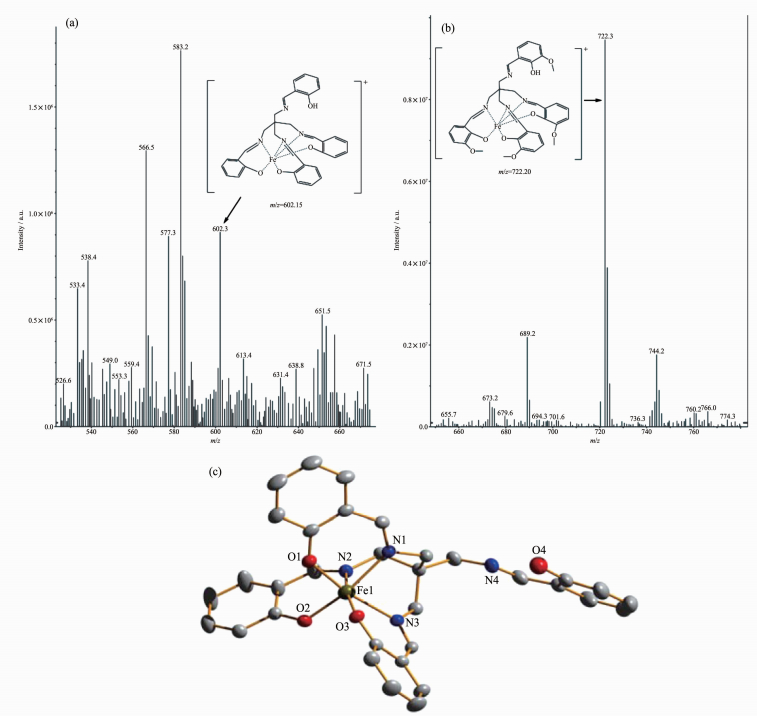 Figure 5.
(a) Positive-ion electrospray ionization mass spectrum of sensor 1 (50 μmol·L-1) upon addition of 1 equiv. of Fe (NO3)3 in acetonitrile solution; (b) Positive-ion electrospray ionization mass spectrum of sensor 2 (50 μmol·L-1) upon addition of 1 equiv of Fe (NO3)3 in acetonitrile solution; (c) Crystal structure of the sensor 1-3H++Fe3+ complex
Figure 5.
(a) Positive-ion electrospray ionization mass spectrum of sensor 1 (50 μmol·L-1) upon addition of 1 equiv. of Fe (NO3)3 in acetonitrile solution; (b) Positive-ion electrospray ionization mass spectrum of sensor 2 (50 μmol·L-1) upon addition of 1 equiv of Fe (NO3)3 in acetonitrile solution; (c) Crystal structure of the sensor 1-3H++Fe3+ complex
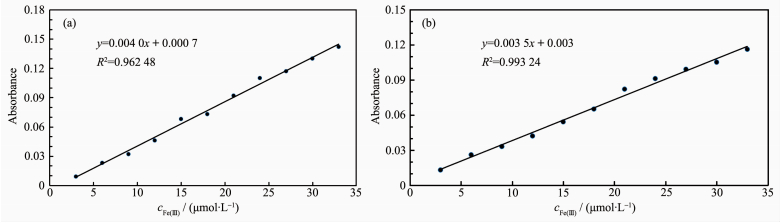 Figure 6.
Absorbance at 488 and 519 nm for sensor 1 (a) and sensor 2 (b) as a function of Fe3+ concentration
Figure 6.
Absorbance at 488 and 519 nm for sensor 1 (a) and sensor 2 (b) as a function of Fe3+ concentration
2.4 Effect of pH value
The sensitivity of the colorimetric sensor compl-exes (1-Fe3+ or 2-Fe3+) at different pH values was studied in a DMSO/H2O (1/9, V/V) solution. Experi-ments were conducted by adjusting pH using NaOH and HCl. As depicted in Fig. 7, both sensors were found to be quite effective in the neutral pH range. In an acidic medium, the absorbance of 1-Fe3+ or 2-Fe3+ complexes decreased due to the decomposition of the Fe (Ⅲ) complexes; while in a basic medium, the absor-bance decreased because of the formation of the Fe (OH)3 colloid. These results suggest that these colo-rimetric sensors are suitable for application under the biologically relevant pH range of 6.0~7.6.
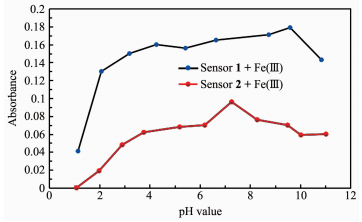 Figure 7.
pH value sensitivity of Fe3+ detection of sensors 1 and 2
Figure 7.
pH value sensitivity of Fe3+ detection of sensors 1 and 2
2.5 Application studies
To determine the applicability of the proposed sensors in a real-case scenario, we examined their colorimetric behavior in the detection of Fe3+ in different environmental water samples, under the same conditions. As shown in Fig. 8a and 8b, the changes in color of the environmental water samples are clearly observable when even trace levels of Fe (Ⅲ) were present. Furthermore, recovery experiments of eighteen samples were conducted at three different levels of the Fe (Ⅲ) concentration for river water, tap water and spring water, respectively, using the standard curve method[42-44]. As shown in Table 1, the results showed satisfactory recovery and R.S.D. values for these water samples, this indicates that the sensors 1 or 2 could potentially be used for the determination of the Fe3+ ion in envi-ronmental water samples. Furthermore, it is well known that Fe2+ ion can easily be oxidated to Fe3+ ion when exposed to air. It is possible for the deter-mination of the Fe2+ ion after its oxidation to the Fe3+ ion using the same procedure as described for the Fe3+ ion.
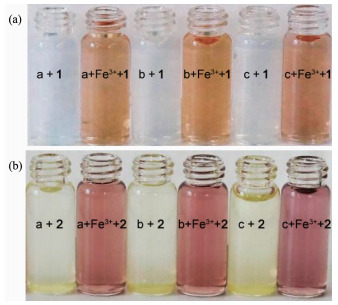 Figure 8.
Determination of Fe3+ in environmental water samples using sensor 1 (a) or 2 (b) as colorimetric sensors
Figure 8.
Determination of Fe3+ in environmental water samples using sensor 1 (a) or 2 (b) as colorimetric sensors
 Table 1.
Determinatin of Fe3+ in water samples*
Table 1.
Determinatin of Fe3+ in water samples*
Sample Sensor Fe (Ⅲ) added / (mmol·L-1) Fe (Ⅲ) found / (μmol·L-1) Recovery / % R.S.D (n=3) / % River water 1 or 2 0.00 0.00 — — 1 8.00 7.75 96.88 1.81 1 15.00 14.25 95.00 2.47 1 25.00 23.96 95.85 2.86 2 8.00 7.85 98.25 2.01 2 15.00 14.31 95.40 2.31 2 25.00 24.47 97.90 1.57 Tap water 1 or 2 0.00 0.00 — — 1 8.00 7.80 97.50 1.42 1 15.00 14.33 95.53 2.14 1 25.00 23.55 94.21 0.51 2 8.00 7.57 94.63 1.15 2 15.00 13.63 90.86 2.03 2 25.00 21.90 87.61 1.84 Spring water 1 or 2 0.00 0.00 — — 1 8.00 7.78 97.25 1.35 1 15.00 14.47 96.64 1.65 1 25.00 23.63 94.54 0.14 2 8.00 7.94 99.25 2.01 2 15.00 15.12 100.08 1.57 2 25.00 25.14 100.50 1.21 * Sensor 1 or 2, 50 μmol·L-1 in DMSO/H2O (1: 9, V/V) solution. Table 1. Determinatin of Fe3+ in water samples*3 Conclusions
In summary, two colorimetric sensors were developed for the detection of Fe2+ and Fe3+ in aqueous media. They exhibited excellent selectivity towards these two ions over other metal cations commonly found in water. The 1: 1 stoichiometries of the Fe (Ⅲ) complexes have been confirmed by X-ray crystallo-graphy, LC-MS spectrometry analysis, and UV-Vis spectrum titration. The detection limits of sensor 1 (0.19 μmol·L-1) and 2 (0.21 μmol·L-1) for Fe3+ are far below the WHO guidelines (5 μmol·L-1). Both sensors 1 and 2 were found to be quite effective in the neutral pH value range and showed good linear relationships within the 3~33 μmol·L-1 concentration range for the measu-rement of Fe3+. The practical applicability studies showed satisfactory recovery and R.S.D. values for the detection of Fe3+ ions in environmental water samples.
-
-
[1]
Callan J F, Silva A P, Magri D C. Tetrahedron, 2005, 61:8551-8588 doi: 10.1016/j.tet.2005.05.043
-
[2]
Sen S, Sarkar S, Chattopadhyay B, et al. Analyst, 2012, 137:3335-3342 doi: 10.1039/c2an35258c
-
[3]
Zhu J, Yuan H, Chan W, et al. Org. Biomol. Chem., 2010, 8:3957-3964 doi: 10.1039/c004871b
-
[4]
Valeur B, Leray I. Chem. Rev., 2000, 205:3-40
-
[5]
Shellaiah M, Wu Y H, Lin H C. Analyst, 2013, 138:2931-2942 doi: 10.1039/c3an36840h
-
[6]
Lee D Y, Singh N, Jang D O, et al. Tetrahedron Lett., 2010, 51:1103-1106 doi: 10.1016/j.tetlet.2009.12.085
-
[7]
H Kim, Na Y J, Song E J, et al. RSC Adv., 2014, 4:22463-22469 doi: 10.1039/c4ra02776k
-
[8]
Berthon G. Handbook of Metal-Ligand Interactions in Biolo-gical Fluids: Bioinorganic Medicine: Vol. 1. New York: Dekker, 1995.
-
[9]
Bertini I, Gray H B, Lippard S J, et al. Bioinorganic Chem-istry. Mill Valley:University Science Book, 1994.
-
[10]
Yang Z, Yan C, Chen Y, et al. Dalton Trans., 2011, 40:2173-2176 doi: 10.1039/C0DT01053G
-
[11]
Kim K B, Kim H, Song E J, et al. Dalton Trans., 2013, 42:16569-16577 doi: 10.1039/c3dt51916c
-
[12]
Crichton R R, Wilmet S, Legssyer R, et al. Inorg. Biochem., 2002, 91:9-18 doi: 10.1016/S0162-0134(02)00461-0
-
[13]
Philpott C C. J. Biol. Chem., 2012, 287:13518-13523 doi: 10.1074/jbc.R111.326876
-
[14]
Nomngongo P N, Ngila J C. Spectrochim. Acta B, 2014, 98:54-59 doi: 10.1016/j.sab.2014.06.001
-
[15]
Caldas L, Brum D M, Paula C. Talanta, 2013, 110:21-27 doi: 10.1016/j.talanta.2013.03.017
-
[16]
Lai T T, Zheng E H, Chen L X. Nanoscale, 2013, 5:8015-8021 doi: 10.1039/c3nr02014b
-
[17]
Kaya E N, Yuksel F, Ozpinar G A, et al. Sens. Actuators B, 2014, 194:377-388 doi: 10.1016/j.snb.2013.12.044
-
[18]
Oh J W, Kim T H, Yoo S W. Sens. Actuators B, 2013, 177:813-817 doi: 10.1016/j.snb.2012.11.066
-
[19]
Potts L W. Quantitative Analysis. New York:Theory and Practice, 1987:656
-
[20]
Arthur I V. Textbook of Macro and Semimicro Qualitative Inorganic Analysis. New York:Longman, 1979:605
-
[21]
Harvey D. Modern Analytical Chemistry. New York:Wiley, 2000:816
-
[22]
Zhang Z Y, Lu S Z, Sha C M, et al. Sens. Actuators B, 2015, 208:258-266 doi: 10.1016/j.snb.2014.10.136
-
[23]
Kozak J, Jodlowska N, Kozak M, et al. Anal. Chim. Acta, 2011, 702:213-217 doi: 10.1016/j.aca.2011.06.053
-
[24]
You G R, Park G J, Lee S A. Sens. Actuators B, 2015, 215:188-195 doi: 10.1016/j.snb.2015.03.064
-
[25]
Li P, Zhao Y, Yao L, et al. Sens. Actuators B, 2014, 191:332-336 doi: 10.1016/j.snb.2013.09.051
-
[26]
Li S H, Li Y C, Cao J. et al. Anal. Chem., 2014, 86:10201-10207 doi: 10.1021/ac503183y
-
[27]
Nandre J, Patil S, Patil V, et al. Biosens. Bioelectron., 2014, 61:612-617 doi: 10.1016/j.bios.2014.06.017
-
[28]
Goel A, Umar S, Nag P, et al. Chem. Commun., 2015, 51:5001-5004
-
[29]
Chen Y J, Yang S C, Tsai C C, et al. Chem. Asian J., 2015, 10:1025-1034 doi: 10.1002/asia.v10.4
-
[30]
Chereddy N R, Nagaraju P, Raju M, et al. Biosens. Bioelec-tron., 2015, 68:749-756 doi: 10.1016/j.bios.2015.01.074
-
[31]
Ju J, Chen W. Biosens. Bioelectron., 2014, 58:219-225 doi: 10.1016/j.bios.2014.02.061
-
[32]
Yang L, Yang W, Xu D M, et al. Dyes Pigm., 2013, 97:168-174 doi: 10.1016/j.dyepig.2012.12.016
-
[33]
Wang J H, Zhang D, Liu Y Q, et al. Sens. Actuators B, 2014, 191:344-350 doi: 10.1016/j.snb.2013.10.018
-
[34]
Wang C C, Zhang D, Huang X Y, et al. Talanta, 2014, 128:69-74 doi: 10.1016/j.talanta.2014.03.073
-
[35]
Wang M, Wang J G, Xue W J. Dyes Pigm., 2013, 97:475-480 doi: 10.1016/j.dyepig.2013.02.005
-
[36]
Jiang G Q, Cai J, Zhang Y Q, et al. J. Struct. Chem., 2012, 31:385-388
-
[37]
Jiang G Q, Cai J, Zhang Y Q, et al. Acta Crystallogr. Sect. E, 2008, E64:o1455
-
[38]
Meier M, Schubert U S. Chem. Commun., 2005, 36:4610-4612
-
[39]
Choi Y W, Park G J, Na Y J, et al. Sens. Actuators B, 2014, 194:343-352 doi: 10.1016/j.snb.2013.12.114
-
[40]
Job P. Ann. Chim., 1928, 9:113-203
-
[41]
Kim H, Kim K B, Song E J, et al. Chem. Comm., 2013, 36:72-76
-
[42]
Wang Z H, Qin Y X, Wang C, et al. Appl. Surf. Sci., 2012, 258:2017-2021 doi: 10.1016/j.apsusc.2011.05.005
-
[43]
Dong L, Wu C, Zeng X. Sens. Actuators B, 2010, 145:433-437 doi: 10.1016/j.snb.2009.12.057
-
[44]
Zhou Y M, Zhang J L, Zhou H. Spectrochim. Acta Part A, 2013, 106:68-72 doi: 10.1016/j.saa.2012.12.084
-
[1]
-

Figure 2 (a) and (b) Color changes of sensors 1 and 2 (50 μmol·L-1) upon addition of various metal ions (5 equiv) in DMSO/H2O (1: 9, V/V); (c) and (d) UV-Vis absorption spectra of sensors 1 and 2 (10 μmol·L-1) in the presence of 5 equiv of different metal ions in DMSO/H2O (1: 9, V/V)

Figure 3 UV-Vis absorption spectra of sensors 1 (a) or 2 (b) (0.1 mmol·L-1) with gradual addition of Fe3+ (0~1 equiv) in DMSO/H2O (1: 9, V/V) solution
Inset 1: Job plot of sensor 1 or 2 with Fe3+ in DMSO/H2O (1: 9, V/V) solution, the total concentrations of sensors 1 or 2 and Fe3+ were 1 mmol·L-1; Inset 2: Plot of the UV-Vis absorbance at 488 nm, 519 nm as functions of Fe3+ concentration for sensors 1 and 2, respectively

Figure 4 Competitive selectivity of sensors 1 (a) or 2 (b) (0.1 mmol·L-1) towards various metal ions (0.1 mmol·L-1)
Yellow bars represent the absorbance of the sensors in presence of 1 equiv. Fe (Ⅲ) and blue bars represent the absorbance of 1 or 2+Fe (Ⅲ) after the subsequent addition of other metal ions; (λmax=488 and 519 nm for sensors 1 and 2, respectively)

Figure 5 (a) Positive-ion electrospray ionization mass spectrum of sensor 1 (50 μmol·L-1) upon addition of 1 equiv. of Fe (NO3)3 in acetonitrile solution; (b) Positive-ion electrospray ionization mass spectrum of sensor 2 (50 μmol·L-1) upon addition of 1 equiv of Fe (NO3)3 in acetonitrile solution; (c) Crystal structure of the sensor 1-3H++Fe3+ complex

Figure 6 Absorbance at 488 and 519 nm for sensor 1 (a) and sensor 2 (b) as a function of Fe3+ concentration
c1=c2=50 μmol·L-1, cFe3+=0~33.0 μmol·L-1

Figure 8 Determination of Fe3+ in environmental water samples using sensor 1 (a) or 2 (b) as colorimetric sensors
Water samples (from left to right) a: river water, b: tap water, c: spring water, the concentration of Fe (NO3)3 in each artificial Fe (Ⅲ) containing water sample was 0.1 mmol·L-1, and the concentration of the sensor 1 or 2 was 0.1 mmol·L-1
Table 1. Determinatin of Fe3+ in water samples*
Sample Sensor Fe (Ⅲ) added / (mmol·L-1) Fe (Ⅲ) found / (μmol·L-1) Recovery / % R.S.D (n=3) / % River water 1 or 2 0.00 0.00 — — 1 8.00 7.75 96.88 1.81 1 15.00 14.25 95.00 2.47 1 25.00 23.96 95.85 2.86 2 8.00 7.85 98.25 2.01 2 15.00 14.31 95.40 2.31 2 25.00 24.47 97.90 1.57 Tap water 1 or 2 0.00 0.00 — — 1 8.00 7.80 97.50 1.42 1 15.00 14.33 95.53 2.14 1 25.00 23.55 94.21 0.51 2 8.00 7.57 94.63 1.15 2 15.00 13.63 90.86 2.03 2 25.00 21.90 87.61 1.84 Spring water 1 or 2 0.00 0.00 — — 1 8.00 7.78 97.25 1.35 1 15.00 14.47 96.64 1.65 1 25.00 23.63 94.54 0.14 2 8.00 7.94 99.25 2.01 2 15.00 15.12 100.08 1.57 2 25.00 25.14 100.50 1.21 * Sensor 1 or 2, 50 μmol·L-1 in DMSO/H2O (1: 9, V/V) solution.  下载: 导出CSV
-


 扫一扫看文章
计量
- PDF下载量: 7
- 文章访问数: 1328
- HTML全文浏览量: 129
 下载:
下载:
