Figure 1.
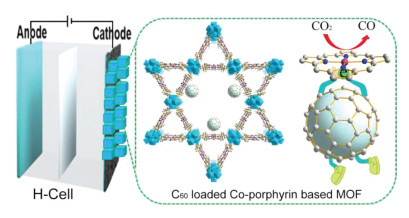
The schematic illustration of fullerenes loaded MOF composites for electroreduction of CO2.
Boosting CO2 electroreduction performance over fullerene-modified MOF-545-Co promoted by π–π interaction
Xue Dong , Zhifeng Xin , Dong He , Jia-Ling Zhang , Ya-Qian Lan , Qian-Feng Zhang , Yifa Chen

In recent years, more and more attention has been attracted to environmental issues all around the world. The waste gas emitted by factories increases the concentration of carbon dioxide, exacerbated the greenhouse effect [1-3]. Many efforts have been devoted to resolve this problem, such as storing CO2 by biological or mineral means, converting CO2 into useful chemicals etc. Among them, reducing CO2 into useful fuels through electrochemical methods is a promising approach. Recently, researchers have developed numerous materials [4-6] that could serve as electrocatalysts for electrocatalytic carbon dioxide reduction reaction (CO2RR) [7-10], such as noble metals [11], metal oxides [12], metal chalcogenides [13-15], metal-free materials [16-19], and porous crystalline materials (e.g., MOFs or COFs) [20-25]. Among these various catalysts, MOFs with sufficient active metal sites, plenty of porosity and efficient mass-transfer ability make them ideal platforms for electrocatalytic CO2RR, while the low electron transfer ability restricts the catalytic application in CO2RR for most of MOFs. In order to further develop the catalytic potential of MOFs, many efforts have been devoted to increase the electron transfer rate in CO2RR process, such as introducing functional ligands or metal clusters with plenty of delocalized electrons, loading conductive polymers in the channels of MOFs [4, 26-29], and so forth. However, the complicated processes of material design and loading methods also limit the wide applications of MOFs in the catalytic CO2RR [30-33].
Fullerenes have been created great interest in material chemistry owing to their unique cage structure and every carbon atom links with three adjacent carbon atoms through sp2-hybridization [36]. For example, the C60 molecule has a symmetric structure with the diameter of 0.71 nm. In the cage structure, π orbital of fullerene is more out of the cage and the electronic structure has naturally focused on the surface. This highly conjugated π-electron system of hollow carbon cage affords it with electron-acceptor capacities [34-36], and the special structure is beneficial for efficient electron transfer in catalytic process [37, 38]. Thus, it would be deduced that the addition of fullerene molecules into MOFs could greatly enhance the electron migration efficiency in the catalytic process [39, 40], and interacted with MOF structure with π-π inter-actions.
Herein, C60 has been introduced into MOFs structure by a one-pot impregnation method. In the structure of C60@MOF-545-Co composite material, the π-electron system of C60 might overlap with π-electron system of porphyrin, which would endow MOFs composites with higher electron transfer ability, CO2 adsorption capability and enhanced catalytic selectivity for CO2RR (Fig. 1). Specifically, C60@MOF-545-Co can selectively convert CO2 to CO with Faradaic efficiency (FECO) of 97.0% at −0.7 V. The FECO can also maintain above 90.0% during the electrolysis process in 10 h and the current density of C60@MOF-545-Co remains almost constant. This work might extend the application scope of MOFs as powerful hybrid materials in efficient CO2 electroreduction.
The detailed synthesis procedures of C60@MOF-545-M and C70@MOF-545-M are list in the following: In a 50 mL Schlenk tube, 50 mg activated MOF-545-Co is added. A solution of C60 (8 mg) in 1 mL carbon bisulfide (CS2) is dropped on the MOF-545-Co powder until the solution just submerges the powder. Subsequently, the Schlenk tube is sonicating in ice bath for 1 h, collect the powder and washed with CS2 until the filter become colorless, after drying under vacuum at 60 ℃ for 8 h, about 54 mg powder is collected. The preparation of C60@MOF-545-Fe or C60@MOF-545-Ni is similar to the procedure C60@MOF-545-Co, except MOF-545-Fe or MOF-545-Ni is used instead of MOF-545-Co, respectively. Simultaneously, C70@MOF-545-Co is also prepared by the similar method using C70 as a doping reagent. The hybrid MOF materials with different loading amounts of C60 (denoted as C60: CoTCPP = 1:2, C60: Co-TCPP = 1:3 and C60: Co-TCPP = 1:6) are obtained by controlling the concentration of C60 in CS2 solution.
A new class of C60-doped MOF-545 with enhanced catalytic efficiency is synthesized by a one-pot immersion method [41, 42]. In the structure of C60@MOF-545-Co, Zr6O8 clusters were linked by Co-TCPP ligand to assemble the porous MOF structure [30, 43]. Powder X-ray diffraction (PXRD) tests confirm that the structure of C60@MOF-545-Co is consistent with MOF-545-Co, indicating that the implantation of C60 have not changed the structure of MOF (Fig. 2a). Nevertheless, the C60 peaks are not observed in the PXRD pattern of C60@MOF-545-M, it probably attributed to the uniform dispersion and low loading amount of C60 in MOF structure, and no corresponding diffraction peak is formed [44]. To investigate the catalytic performance of C60 in MOF with different transition metals, C60 molecule is also introduced into both MOF-545-Fe and MOF-545-Ni by the similar procedures. The PXRD patterns (Fig. S1 in Supporting information) demonstrate that C60@MOF-545-Fe and C60@MOF-545-Ni show the similar phase structure of MOF-545. Scanning electron microscope (SEM) tests show that the as-prepared C60@MOF-545-Co displays rod-like morphology [45]. The smooth surface of the rods implies that C60 is not loaded on the surface of MOF-545-Co. Specifically, the morphology of C60@MOF-545-Co (Fig. 2d) remained unchanged during the loading process of C60 based on MOF-545 (Fig. 2b) and MOF-545-Co (Fig. 2c) [28].
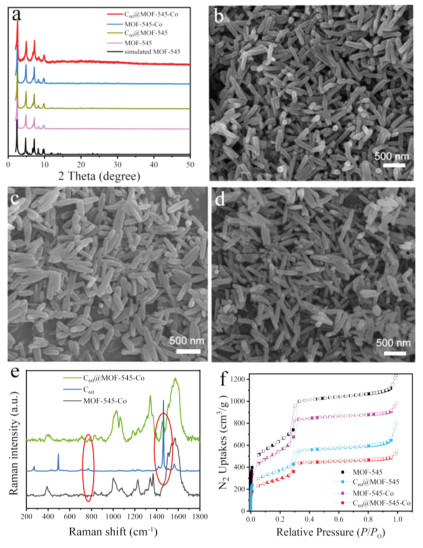
Raman spectroscopy is utilized to determine the presence of C60 in C60@MOF-545-Co structure (Fig. 2e). Raman spectra display the characteristic peaks of C60 corresponding to the typical Ag and Hg vibration modes. For the spectrum of C60, the major bands at 500 and 1471 cm−1 correspond to the Ag vibration modes of C60. Other distinct vibration peaks at 271, 712, 770 and 1569 cm−1 are ascribed to the active Hg vibration modes [46]. Specifically, the Raman spectrum of C60@MOF-545-Co shows obvious peaks at 770 cm−1 and 1467 cm−1, which may be attributed to the Hg and Ag vibration modes of C60, respectively. The above result indicates that C60 is successfully integrated in C60@MOF-545-Co.
In addition, N2 sorption tests are conducted to evaluate the porosity of the obtained materials. The Brunauer-Emmett-Teller surface areas (SBET) of MOF-545, C60@MOF-545, MOF-545-Co and C60@MOF-545-Co are calculated to be 2307 m2/g, 1327 m2/g, 1957 m2/g and 1106 m2/g, respectively (Fig. 2f and Table S1 in Supporting information). The SBET and total pore volume (Vt) of C60@MOF-545-Co is decreased when compared with that of MOF-545-Co owing to the loading of C60 would occupy a part of the pore (Fig. S2 in Supporting information). To further understand the properties of pore structure for the obtained samples, CO2 adsorption measurements are performed. According to the CO2 uptake curves (Fig. S4 in Supporting information), the CO2 adsorption capacities of MOF-545-Co and C60@MOF-545-Co are calculated to be 36 cm3/g and 26 cm3/g at 298 K and 1 atm, respectively. The decrease of CO2 uptake would also be attributed to the loading of C60 that occupies part of the pore. After calculation, C60@MOF-545-Co can absorb about 9 CO2 molecules per unit cell at 1 atm and 298 K, which would be beneficial for efficient electrocatalytic CO2RR. In addition, the adsorption enthalpy of C60@MOF-545-Co and MOF-545-Co (Figs. S3 and S4 in Supporting information) are calculated based on the CO2 adsorption curves obtained at 273 K, 283 K and 298 K. The CO2 adsorption enthalpy of C60@MOF-545-Co (32 kJ/mol) is obviously higher than that of MOF-545-Co (23 kJ/mol). The results indicate that the introduction of C60 is beneficial for the enhanced adsorption of CO2.
The electrocatalytic performance of C60@MOF-545-Co for CO2RR is measured using three-electrode system in an H-type cell containing CO2-saturated 0.5 mol/L KHCO3 (pH 7.2) aqueous solution. Firstly, catalytic selectivity of MOF-545-Co, MOF-545-Fe and MOF-545-Ni is carried out and the corresponding FECO is evaluated over a wide potential range (from −0.4 V to −1.2 V). MOF-545-Co has a higher FECO value (70.2%, −0.9 V) than MOF-545-Fe (53.0%, −0.7 V) and MOF-545-Ni (46.4%, −1.0 V), which is similar to the previous reported result (Fig. S5 in Supporting information) [28]. In addition, we also select MOF-545-Co, MOF-545-Ni and MOF-545-Fe to load C60 and further test their catalytic performances. The result indicates that C60@MOF-545-Co (97.0%, −0.7 V) shows higher FECO value than C60@MOF-545-Fe (68.0%, −0.8 V) and C60@MOF-545-Ni (53.5%, −0.9 V) (Fig. S1 in Supporting information). Therefore, we choose C60 loaded MOF-545-Co as the desired platform for further CO2RR investigation.
To detailly study the electrocatalytic activity of C60@MOF-545-Co for CO2RR, a series of contrast samples (i.e., MOF-545-Co, C60 and C60@MOF-545) are prepared to test their specific electro-catalytic performances for comparation. The catalytic activity of C60@MOF-545-Co is preliminarily evaluated using linear sweep voltammetry (LSV) in 0.5 mol/L KHCO3 electrolyte. LSV curves show that the variation trend of current with the increase of voltage. The largest current density of C60@MOF-545-Co in LSV curve is 37 mA/cm2 at −1.37 V, which is obviously higher than that of contrast samples (Fig. 3a). The current density of C60@MOF-545-Co in CO2-saturated KHCO3 solution is much higher than that in Ar-saturated KHCO3 solution, which indicates that the high current density of C60@MOF-545-Co mainly comes from CO2RR (Fig. 3b) [47]. C60@MOF-545-Co exhibits a smaller onset potential and a larger total current density than MOF-545-Co, C60 and C60@MOF-545, which indicates the high catalytic activity of C60@MOF-545-Co. To study the effect of the C60 introduction on the electron transfer performance, we further test the electronic conductivity of MOF-545-Co, C60@MOF-545-Co (Fig. S6 in Supporting information). The results show that the electronic conductivity C60@MOF-545-Co is only slightly higher than that of MOF-545-Co, which can be concluded that introducing of C60 can improve the electron conductivity of MOF to some extent and can largely improve the electron transfer efficiency from the catalyst surface to the reactant molecules in the electrocatalysis process. The gaseous and liquid products are detected by gas chromatography (GC) and 1H nuclear magnetic resonance (NMR) spectroscopy, respectively (Fig. S7 in Supporting information). The result of NMR exhibits that no liquid product has been detected, and the result of GC shows that CO is the main gas product [28, 48, 49]. Moreover, the FECO of C60@MOF-545-Co can reach up to 97.0% at −0.7 V, which is largely higher than MOF-545-Co (70.2%), C60@MOF-545 (19.4%) and C60 (11.5%) (Fig. 3c and Fig. S7). This can be concluded that the high catalytic selectivity is originated from the combination of C60 molecules and MOF-545-Co. The CO partial current density of C60@MOF-545-Co (12.7 mA/cm2 at −1.1 V) is largely higher than the contrast samples, indicating the better electron transfer ability in the process of CO2RR (Fig. 3d).
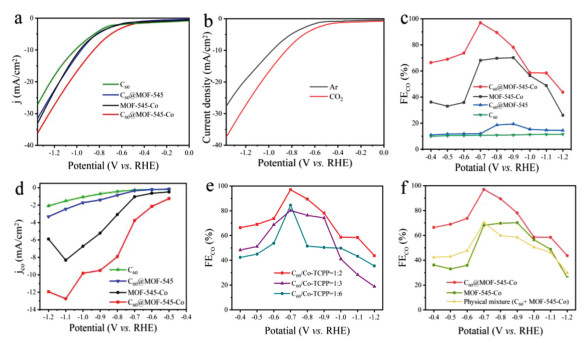
To further study the effect of C60 on the catalytic performance, C60@MOF-545-Co with different C60 loading amounts (e.g., C60: TCPP-Co = 1:2, 1:3 and 1:6, respectively) have been prepared and characterized by PXRD and SEM (Figs. S8 and S9 in Supporting information). The results of PXRD and SEM displayed that loading of C60 and the loading amount have not change the crystal structure and morphology of MOF particles. The loading amount of C60 is calculated from the standard curve of UV absorption spectrum [50, 51]. The detailed steps are listed in the supporting information (Fig. S10 in Supporting information). Fig. 3e shows the FECO of C60@MOF-545-Co (1:2) is higher than that of C60@MOF-545-Co (1:3) and C60@MOF-545-Co (1:6), indicating that the higher loading of C60 is benefit for increasing the catalytic performance for CO2RR. In detail, the FECO values of them are 97.0% (C60: Co-TCPP = 1:2), 84.5% (C60: Co-TCPP = 1:3) and 80.2% (C60: Co-TCPP = 1:6), respectively. This might be concluded that the loading of C60 in MOF channel can enhance the catalytic efficiency and the optimized C60 loading (C60: Co-TCPP = 1:2) with the best performance will serve as be the representative to investigate other properties. To further support the vital role of C60 molecule, we have prepared the physical mixture of MOF-545-Co and C60 (C60+MOF-545-Co with the ratio of C60: Co-TCPP = 1:2) (Fig. 3f) and tested their electrocatalytic performances for CO2RR. The result shows the lower catalytic performance of physical mixture (70.3%, −0.7 V) than that of C60@MOF-545-Co (97.0%, −0.7 V), which can be concluded that C60 can enhance the electron transfer efficiency for CO2RR in the channel of MOF. Furthermore, the corresponding maximum FECO of C60@MOF-545-Co, MOF-545-Co, C60@MOF-545 and C60 is 97.0%, 70.2%, 19.4% and 11.5%, respectively, proving the vital role of C60 in the electrocatalytic CO2RR (Fig. S11 in Supporting information). In electrocatalysis process, electrochemical impedance spectroscopy (EIS) is usually used to study the hindrance received during the transfer of electrons from the catalyst surface to CO2 molecules. Nyquist plots are obtained via EIS. Based on the fitted data via Zview software (Fig. 4a), the charge transfer resistance (Rct) of C60@MOF-545-Co (1.14 Ω) is five times decreased when compared with that of MOF-545-Co (6.50 Ω), proving that the introduction of C60 can largely reduce the charge transfer barrier during the electrolysis process.
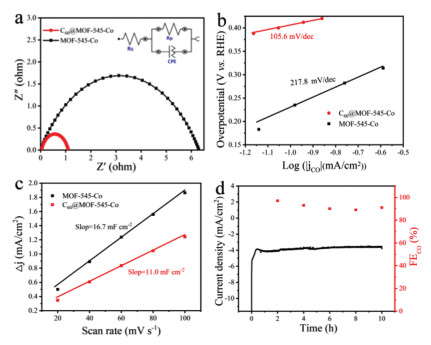
In the electrochemical process, the polarization of the electrode reflects the obstruction of the electrode process. The Tafel slope is usually used to characterize the performance of electrochemical catalysts because it quantifies the amount of additional applied potential required to observe the logarithmic increase in the measured current. Besides, Tafel slope for C60@MOF-545-Co (105.6 mV/dec) is also largely decreased compared to that of MOF-545-Co (217.8 mV/dec), implying the more favorable kinetics of C60@MOF-545-Co for the CO formation (Fig. 4b).
To further investigate the intrinsic activity of C60@MOF-545-Co and MOF-545-Co, cyclic voltammetry (CV) measurements at different scan rates (Fig. S12 in Supporting information) are applied to evaluate their electrochemical active surface area (ECSA) according to the double-layer capacitance (Cdl). The ECSA of C60@MOF-545-Co and MOF-545-Co is calculated to be 275 and 417.5 cm2, respectively, based on the value of double-layer capacitance (Cdl) (Fig. 4c). Besides, the measured ECSA corrected CO partial current density for C60@MOF-545-Co is 2 times increased after the loading of C60 (Fig. S13 in Supporting information), implying that the addition of C60 can largely improve the catalytic activity of MOF-545-Co for CO2RR [52].
The excellent electrocatalytic performance of C60@MOF-545-Co for CO2RR encourages us to evaluate its stability. The durability test of C60@MOF-545-Co is carried out at −0.7 V in CO2-saturated KHCO3 aqueous solution. The FECO can also maintain above 90.0% during the electrolysis process in 10 h and the current density of C60@MOF-545-Co remains almost constant (Fig. 4d). The resulting PXRD pattern shows that C60@MOF-545-Co still maintains the origin structure after electrocatalysis for 10 h. Besides, SEM test demonstrates that the morphology of C60@MOF-545-Co keeps unchanged after the CO2 electrocatalytic reaction. Therefore, C60@MOF-545-Co shows high stability in the process of electrocatalytic reaction (Fig. S14 in Supporting information).
Except for C60, other fullerene like C70 has also been studied to explore the versatility of this strategy. C70 is also one of the most famous members the family of closed-cage molecules [53-55], and there are similar chemical bonds in C60 and C70. In view of the above C60 loaded in the pore channel of MOF-545-Co exhibits superior catalytic properties in CO2RR, C70@MOF-545-Co has been prepared following the similar methods. The PXRD tests confirm that the structure of MOF-545-Co remains unchanged after the loading of C70 (Fig. S16a in Supporting information). The SEM image displays the rod-like morphology (Fig. S15a in Supporting information), which is similar to that of C60@MOF-545-Co. In addition, Raman spectroscopy has been utilized to determine the presence of C70 in the structure of MOF-545-Co and two obvious peaks detected at 258 cm−1 and 768 cm−1 can be ascribed to the A1' and E2' or E1'' vibration modes of C70, respectively (Fig. S15b in Supporting information). Compared with the Raman spectroscopy of MOF-545-Co, the Raman spectroscopy of C70@MOF-545-Co shows not only the character peaks of MOF-545-Co but also the peaks of C70, two obvious peaks at 258 cm−1 and 768 cm−1 correspond to the A1' and E2' or E1'' vibration modes of C70, respectively [56, 57]. To further detect the CO2RR selectivity of C70@MOF-545-Co, the FECO tests are carried out. As shown in (Fig. S16b (Supporting information), the FECO for C70@MOF-545-Co (91.1%, −0.8 V) is lower than C60@MOF-545-Co (97.0%, −0.7 V). As we can see from the LSV comparison curves (Fig. S16c in Supporting information), the total current density of C70@MOF-545-Co (35.6 mA/cm2) is also slightly lower than C60@MOF-545-Co (37 mA/cm2). EIS measurement further validates this fact, because C60@MOF-545-Co (1.14 Ω) has smaller charge transfer resistance than C70@MOF-545-Co (1.21 Ω) (Fig. S16d in Supporting information). According to the above results, C60@MOF-545-Co exhibits better catalytic performance for CO2RR than that of C70@MOF-545-Co.
In summary, fullerene molecules (i.e., C60 and C70) have been successfully introduced into the pore-channels of Co-porphyrin based MOF utilizing direct impregnation method. Thus-obtained hybrid materials present higher electron-transfer ability, CO2 adsorption-enthalpy and enhanced CO2 electroreduction activity owing to the possibly overlapped π-electron systems of fullerene molecules with Co-porphyrin. Notably, the Rct of C60@MOF-545-Co is almost 5 times lower of than that of MOF-545-Co, as well as 1.5 times increased for the CO2 adsorption enthalpy. Specifically, C60@MOF-545-Co can selectively convert CO2 to CO with a high FECO of 97.0% at −0.7 V, which is largely higher than MOF-545-Co (70.2%), C60@MOF-545 (19.4%), C60 (11.5%) and physical mixture (70.3%) and presented as one of the best CO2 electroreduction catalysts reported in H-cell system. This work would shed light on the exploration of the hybridization of fullerenes and MOFs as powerful hybrid materials in efficient CO2 electroreduction.
The authors declare that they have no known competing financial interests or personal relationships that could have appeared to influence the work reported in this paper.
This work was financially supported by the National Natural Science Foundation of China (Nos. 22171139 and 21901122); Natural Science Foundation of Educational Commission of Anhui Province of China (No. KJ2020A0240); the Natural Science Research of Jiangsu Higher Education Institutions of China (No. 19KJB150011) and Project funded by China Postdoctoral Science Foundation (No. 2019M651873).
Supplementary material associated with this article can be found, in the online version, at doi:
D. Shakun, P.U. Clark, F. He, et al., Nature 484 (2012) 49–54. doi: 10.1038/nature10915
J. Qiao, Y. Liu, F. Hong, J. Zhang, Chem. Soc. Rev. 43 (2014) 631–675. doi: 10.1039/C3CS60323G
N. Mac Dowell, P.S. Fennell, N. Shah, G.C. Maitland, Nat. Clim. Change 7 (2017) 243–249. doi: 10.1038/nclimate3231
Z. Xin, Y.R. Wang, Y. Chen, et al., Nano Energy 67 (2020) 104233. doi: 10.1016/j.nanoen.2019.104233
D.L. Meng, M.D. Zhang, D.H. Si, Angew. Chem. Int. Ed. 60 (2021) 25485–25492. doi: 10.1002/anie.202111136
C. Chen, X. Yan, S. Liu, et al., Angew. Chem. In. Ed. 59 (2020) 16459–16464. doi: 10.1002/anie.202006847
D.L.T. Nguyen, Y. Kim, Y.J. Hwang, D.H. Won, Carbon Energy 2 (2020) 72–98. doi: 10.1002/cey2.27
R. Lin, X. Ma, W.C. Cheong, et al., Nano Res. 12 (2019) 2866–2871. doi: 10.1007/s12274-019-2526-1
Y. Zhang, L. Jiao, W. Yang, C. Xie, H.L. Jiang, Angew. Chem. Int. Ed. 60 (2021) 7607–7611. doi: 10.1002/anie.202016219
Y. Hou, Y.B. Huang, Y.L. Liang, et al., CCS Chem. 1 (2019) 384–395. doi: 10.31635/ccschem.019.20190011
D. Chen, Y. Wang, D. Liu, et al., Carbon Energy 2 (2020) 443–451. doi: 10.1002/cey2.38
J.D. Yi, R. Xie, Z.L. Xie, Angew. Chem. Int. Ed. 59 (2020) 23641–23648. doi: 10.1002/anie.202010601
S. Gao, Y. Lin, X. Jiao, et al., Nature 529 (2016) 68–71. doi: 10.1038/nature16455
W. Zhang, Y. Hu, L. Ma, et al., Adv. Sci. 5 (2018) 1700275. doi: 10.1002/advs.201700275
Q. Li, J. Fu, W. Zhu, et al., J. Am. Chem. Soc. 139 (2017) 4290–4293. doi: 10.1021/jacs.7b00261
S. Zhao, D.W. Wang, R. Amal, L. Dai, Adv. Mater. 31 (2019) e1801526. doi: 10.1002/adma.201801526
Z. Sun, T. Ma, H. Tao, Q. Fan, B. Han, Chem 3 (2017) 560–587. doi: 10.1016/j.chempr.2017.09.009
X. Duan, J. Xu, Z. Wei, et al., Adv. Mater. 29 (2017) 1701784. doi: 10.1002/adma.201701784
I.M. Hasan, L. Peng, J. Mao, Carbon Energy 3 (2021) 24–49. doi: 10.1002/cey2.87
D. Yi, D.H. Si, R. Xie, et al., Angew. Chem. Int. Ed. 60 (2021) 17108–17114. doi: 10.1002/anie.202104564
C.W. Kung, C.O. Audu, A.W. Peters, et al., ACS Energy Lett. 2 (2017) 2394–2401. doi: 10.1021/acsenergylett.7b00621
I. Hod, M.D. Sampson, P. Deria, et al., ACS Catal. 5 (2015) 6302–6309. doi: 10.1021/acscatal.5b01767
L. Ye, J. Liu, Y. Gao, et al., J. Mater. Chem. A 4 (2016) 15320–15326. doi: 10.1039/C6TA04801C
Y. Wang, P. Hou, Z. Wang, P. Kang, ChemPhysChem 18 (2017) 3142–3147. doi: 10.1002/cphc.201700716
C. He, Q.J. Wu, M.J. Mao, et al., CCS Chem. 2 (2020) 2368–2380.
S. Dou, J. Song, S. Xi, et al., Angew. Chem. Int. Ed. 58 (2019) 4041–4045. doi: 10.1002/anie.201814711
Z. Xin, J. Liu, X. Wang, et al., ACS Appl. Mater. Interfaces 13 (2021) 54959–54966. doi: 10.1021/acsami.1c15187
Y.R. Wang, Q. Huang, C.T. He, et al., Nat. Commun. 9 (2018) 4466. doi: 10.1038/s41467-018-06938-z
C. He, J. Liang, Y.H. Zou, Natl. Sci. Rev. (2022) nwab157.
G. Paille, M. Gomez-Mingot, C. Roch-Marchal, et al., J. Am. Chem. Soc. 140 (2018) 3613–3618. doi: 10.1021/jacs.7b11788
B. Wang, W. Li, Z. Liu, et al., RSC Adv. 10 (2020) 12129–12134. doi: 10.1039/c9ra10467d
X. Yuan, Q. Mu, S. Xue, et al., J. Energy Chem. 60 (2021) 202–208. doi: 10.1016/j.jechem.2020.12.025
Y.N. Gong, L. Jiao, Y. Qian, et al., Angew. Chem. Int. Ed. 59 (2020) 2705–2709. doi: 10.1002/anie.201914977
L. Song, T. Li, S. Zhang, J. Phys. Chem. C 121 (2016) 293–299.
M. Sathish, K. Miyazawa, Molecules 17 (2012) 3858–3865. doi: 10.3390/molecules17043858
W. Kratchmer, Nature 347 (1990) 354–358. doi: 10.1038/347354a0
Y. Wei, M. Ma, W. Li, et al., Appl. Catal. B: Environ. 238 (2018) 302–308. doi: 10.1016/j.apcatb.2018.07.043
K.A. Affholter, S.J. Henderson, G.D. Wignall, et al., J. Chem. Phys. 99 (1993) 9224–9229. doi: 10.1063/1.465538
C. Li, X. Liu, P. Huo, Y. Yan, et al., Small 17 (2021) e2102539. doi: 10.1002/smll.202102539
X. Kang, Q. Zhu, X. Sun, et al., Chem. Sci. 7 (2016) 266–273. doi: 10.1039/C5SC03291A
S. Hermes, F. Schröder, S. Amirjalayer, R. Schmid, R.A. Fischer, J. Mater. Chem. 16 (2006) 2464–2472. doi: 10.1039/B603664C
S. Hermes, M.K. Schroter, R. Schmid, et al., Angew. Chem. Int. Ed. 44 (2005) 6237–6241. doi: 10.1002/anie.200462515
W. Morris, B. Volosskiy, S. Demir, et al., Inorg. Chem. 51 (2012) 6443–6445. doi: 10.1021/ic300825s
F.J.M. Hoeben, P. Jonkheijm, E.W. Meijer, A.P.H.J. Schenning, ChemInform 105 (2005) 1491–1546. doi: 10.1021/cr030070z
C. Zhang, H. Li, C. Li, et al., Molecules 25 (2019) 168. doi: 10.3390/molecules25010168
K. Vimalanathan, R.G. Shrestha, Z. Zhang, et al., Angew. Chem. Int. Ed. 56 (2017) 8398–8401. doi: 10.1002/anie.201608673
M.D. Zhang, D.H. Si, J.D. Yi, et al., Small 16 (2020) e2005254. doi: 10.1002/smll.202005254
U. Takashi, H. Satoshi, K. Kana, et al., J. Am. Chem. Soc. 130 (2008) 6781–6788. doi: 10.1021/ja800087s
A.M. Limaye, J.S. Zeng, A.P. Willard, K. Manthiram, Nat. Commun. 12 (2021) 1–10. doi: 10.1038/s41467-020-20314-w
J.P. Hare, H.W. Kroto, R. Taylor, Chem. Phys. Lett. 589 (2013) 57–60. doi: 10.1016/j.cplett.2013.08.068
B. Ghanbari, M. Zarepour-jevinani, A.H. Mohammadzadeh, J. Photochem. Photobiol. A 418 (2021) 113414. doi: 10.1016/j.jphotochem.2021.113414
H. Cheng, X. Wu, M. Feng, et al., ACS Catal. 11 (2021) 12673–12681. doi: 10.1021/acscatal.1c02319
P. Bairi, K. Minami, W. Nakanishi, et al., ACS Nano 10 (2016) 6631–6637. doi: 10.1021/acsnano.6b01544
S. Onsori, S. Montazeri, J. Inorg, Organometal. Polym. Mater. 31 (2021) 4222–4235. doi: 10.1007/s10904-021-02060-8
X. Zhang, X. Ai, R. Zhang, et al., Carbon 106 (2016) 202–207.
P. Sharma, R. Singhal, R. Vishnoi, et al., Vacuum 123 (2016) 35–41. doi: 10.1016/j.vacuum.2015.10.006
JB Sundqvist, Diam. Relat. Mater. 73 (2017) 143–147. doi: 10.1016/j.diamond.2016.09.001

Figure 1 The schematic illustration of fullerenes loaded MOF composites for electroreduction of CO2.

Figure 2 Characterization of C60@MOF-545-Co. (a) PXRD patterns of C60@MOF-545-Co, MOF-545-Co, C60@MOF-545, MOF-545 and simulated MOF-545. SEM image of (b) MOF-545, (c) MOF-545-Co and (d) C60@MOF-545-Co. (e) Raman spectra of C60@MOF-545-Co, MOF-545-Co and C60. (f) N2 sorption isotherms of C60@MOF-545-Co, MOF-545-Co, C60@MOF-545 and MOF-545.

Figure 3 Electrocatalytic CO2RR performances: (a) LSV curves of C60@MOF-545-Co and comparison sample. (b) LSV curves of C60@MOF-545-Co in Ar and CO2 saturated 0.5 mol/L KHCO3 aqueous solution. (c) Faradaic efficiencies for CO at different potentials. (d) Partial CO current density. (e) FECO of C60@MOF-545-Co with different C60 loading capacity. (f) FECO of C60@MOF-545-Co, MOF-545-Co and physical mixture (C60+MOF-545-Co).

 扫一扫看文章

扫一扫关注我们
 DownLoad:
 下载:
下载:
