 Figure Scheme1.
Synthetic route for HL
Figure Scheme1.
Synthetic route for HL
Citation:
MAO Pan-Dong, YAN Ling-Ling, WANG Wen-Jing, YANG Qian-Qian, CUI Meng-Qiang, WANG Yuan, WU Wei-Na. Syntheses, Crystal Structures and DNA-Binding Properties of Co (Ⅲ)/Cd (Ⅱ) Complexes with Quinoline Thiosemicarbazone Ligand[J]. Chinese Journal of Inorganic Chemistry,
2016, 32(3): 555-560.
doi:
10.11862/CJIC.2016.064

喹啉缩氨基硫脲Co (Ⅲ)/Cd (Ⅱ) 配合物的合成、结构和DNA结合性质
English
Syntheses, Crystal Structures and DNA-Binding Properties of Co (Ⅲ)/Cd (Ⅱ) Complexes with Quinoline Thiosemicarbazone Ligand
Abstract:
Two complexes [CoL2]Cl·2CH3OH (1) and [CdL2] (2) (HL=(quinolin-8-ylmethylene) thiosemicarbazide) have been synthesized and structurally determined by single-crystal X-ray diffraction. The results show that the metal ion in each complex with a distorted octahedron geometry is surrounded by two anionic thiosemicarbazone ligand with N2S donor set. Complexes 1 and 2 can bind to DNA via electrostatic intercalation and partial intercalation modes, respectively. CCDC: 1436092, 1; 1436093, 2.
-
Key words:
- quinoline
- / thiosemicarbazone
- / complex
- / crystal structure
- / DNA-biding property
-
Thiosemicarbazones (TSCs) and their metal com-plexes, especially the transition metal, have attracted intensity attention in the coordination chemistry because of their high biological and pharmaceutical activities, such as antibacterial, antiviral, antifungal, and antitumor activity[1]. In fact, the mechanism of antitumor action is still controversial in many respects and has been identified including ribonucleotide reductase inhibition, metal dependent radical damage, DNA binding and inhibition of protein synthesis[1-10]. Up to now, a large amount of TSCs metals containing six-member heterocycles have been found to possess considerable antitumor activity[2, 4-10]. However, the studies on the complexes with TSCs bearing cond-ensed heterocycles are relatively few [3, 11-13]. Recently, several Cu (Ⅱ) complexes with quinolin-8-ylmethylene) thiosemicarbazide have been reported to be potential antitumor agents[12-13]. In this paper, the structures and DNA-binding properties of its Co (Ⅲ)/Cd (Ⅱ) complexes have been discussed in detail.
1 Experimental
1.1 Materials and measurements
Solvents and starting materials for syntheses were purchased commercially and used as received. Elemental analyses were carried out on an Elemental Vario EL analyzer. The IR spectra (ν=4 000~400 cm-1) were determined by the KBr pressed disc method on a Bruker V70 FT-IR spectrophotometer. DNA-Binding Properties of both complexes are measured using literature method via absorption and emission spectra[14]. The UV spectra were recorded on a Purkinje General TU-1800 spectrophotometer. Fluorescence spectra were determined on a Varian CARY Eclipse spectrophotometer, in the measurements of emission and excitation spectra the pass width is 5 nm.
1.2 Preparations of the ligand and complexes 1 and 2
The TSC ligand HL (Scheme 1) was produced according to the literature method[13]. The complexes 1 and 2 were generated by reaction of HL (5mmol) with equimolar of CoCl2 or Cd (NO3)2 in CH3OH (10 mL) solution, respectively. Crystals of 1 and 2 suitable for X-ray diffraction analysis were obtained by evaporating the corresponding reaction solutions at room temperature.
Figure Scheme1.
Synthetic route for HL
1: purple block. Anal. Calcd. For C24H26N8O2S2 ClCo (%): C 46.72; H 4.25; N 18.16. Found (%): C 46.62; H 4.44; N 18.03. FT-IR (cm-1): ν(C=N) 1 590, ν(N=C) quinoline 1 482, ν(C-S) 768.
2: yellow plate. Anal. Calcd. for C22H18N8S2Cd (%): C 46.28; H 3.18; N 19.63. Found (%): C 46.44; H 3.29; N 19.48. FT-IR (cm-1): ν(C=N) 1 591, ν(N=C) quinoline 1 437, ν(C-S) 730.
1.3 X-ray crystallography
The X-ray diffraction measurement for complexes 1 (size: 0.10 mm×0.08 mm ×0.08 mm) and 2 (size: 0.15 mm×0.14 mm×0.06 mm) was performed on a Bruker SMART APEX Ⅱ CCD diffractometer equipped with a graphite monochromatized Mo Kα radiation (λ=0.071 073 nm) by using φ-ω scan mode. Semi-empirical absorption correction was applied to the intensity data using the SADABS program[15]. The structures were solved by direct methods and refined by full matrix least-square on F2 using the SHELXTL-97 program[16]. All non-hydrogen atoms were refined anisotropically. All H atoms were positioned geometrically and refined using a riding model. Details of the crystal parameters, data collection and refinements for complexes 1 and 2 are summarized in Table 1.
 Table 1.
Crystal data and structure refinement for complexes 1 and 2
Table 1.
Crystal data and structure refinement for complexes 1 and 2
1 2 Empirical formula C24H26N8O2S2ClCo C22H18N8S2Cd Formula weight 645.66 570.96 T/K 296(2) 296(2) λ/ nm 0.071 073 0.071 073 Crystal system Monoclinic Monoclinic Space group C2/c P2/c a/ nm 1.579(4) 1.745(2) b/ nm 1.156(3) 0.809 4(11) c / nm 1.762(5) 1.581(2) β /(°) 112.55(5) 109.34(2) V/nm 3 2.970(14) 2.107(5) Z 4 4 Dc / (g·cm -3) 1.380 1.800 Absorption coefficient / mm -1 0.844 1.265 F(000) 1 272 1 144 Reflection collected, unique (Rint) 7 337, 2 611 (0.056 5) 10 313, 3 696 (0.063 6) Data, restraints, parameters 2 611, 0, 179 3 696, 0, 298 Goodness-of-fit (GOF) on F2 1.069 1.021 Final R indices [I > 2σ(I)] R1=0.065 8, wR2=0.198 1 R1=0.053 4, wR2=0.100 7 R indices (all data) R1=0.094 8, wR2=0.223 8 R1=0.101 8, wR2=0.120 9 Largest peak and hole / (e·nm-3) 1 088 and-365 1 388 and-827 Table 1. Crystal data and structure refinement for complexes 1 and 2CCDC: 1436092, 1; 1436093, 2.
2 Results and discussion
2.1 Crystal structures description
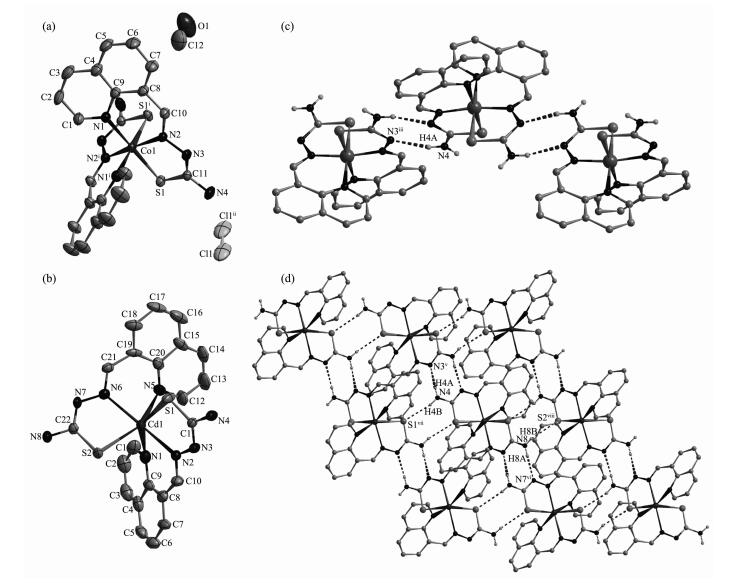
The ORTEP drawing of complexes 1 and 2 is shown in Fig. 1. Selected bond distances and angles are listed in Table 2. Hydrogen bonds information is in Table 3. The lengths of C-S bond are in the range of 0.166 7(7)~0.171 5(6) nm in complexes 1 and 2, showing that the ligand HL has thiolated and deprotonated in both complexes[14].
Figure 1.
ORTEP drawing of 1 (a) and 2 (b) with 30% thermal ellipsoids; (c) Chain-like structure along c axis formed via pairs of N-H…N hydrogen bonds in complex 1; (d) Extended 2D supermolecular structure in complex 2
Table 2.
Selected bond lengths (nm) and angles (°) in complexes 1 and 2
1 Co1-N1 0.199 5(6) Co1-N2 0.188 0(6) Co1-S1 0.220 4(4) N2ⅰ-Co1-N2 171.0(3) N1-Co1-N1ⅰ 90.7(3) N2-Co1-S1 86.2(2) N2ⅰ-Co1-N1 92.5(2) N2-Co1-S1ⅰ 87.6(2) N1-Co1-S1 179.31(15) N2-Co1-N1 93.8(2) N1-Co1-S1ⅰ 88.6(2) S1i-Co1-S1 92.1(2) 2 Cd1-N1 0.244 0(7) Cd1-N2 0.229 8(6) Cd1-S1 0.253 3(3) Cd1-N5 0.241 9(7) Cd1-N6 0.230 7(6) Cd1-S2 0.251 3(3) N2-Cd1-N6 170.1(2) N5-Cd1-N1 85.0(3) N2-Cd1-S1 75.51(16) N2-Cd1-N5 110.4(2) N2-Cd1-S2 101.47(16) N6-Cd1-S1 98.42(16) N6-Cd1-N5 76.2(2) N6-Cd1-S2 75.04(16) N5-Cd1-S1 83.71(19) N2-Cd1-N1 76.8(2) N5-Cd1-S2 143.24(16) N1-Cd1-S1 144.12(16) N6-Cd1-N1 111.7(2) N1-Cd1-S2 84.83(18) S2-Cd1-S1 122.76(12) Symmetry code: ⅰ 1-x, y, 0.5-z Table 2. Selected bond lengths (nm) and angles (°) in complexes 1 and 2
Table 3.
Hydrogen bonds information in complexes 1 and 2
D-H…A d (D-H)/nm d (H…A) /nm d (D…A) / nm ∠DHA/(°) 1 N4—H4B …Cl1 0.086 0.233 0.314 0(9) 157.7 O1—H1A …Cl1ⅰ 0.082 0.249 0.325 1(13) 153.9 N4—H4B …Cl1ⅱ 0.086 0.246 0.326 6(9) 156.2 N4-H4A …N3ⅲ 0.086 0.213 0.297 3(8) 167.5 O1-H1A …Cl1ⅳ 0.082 0.294 0.342 2(15) 119.3 2 N4-H4A …N3ⅴ 0.086 0.226 0.302 3(9) 148.5 N8-H8A …N7ⅵ 0.086 0.224 0.306 0(9) 160.3 N4-H4B …S1ⅶ 0.086 0.266 0.348 3(7) 161 N8—H8B …S2ⅷ 0.086 0.271 0.349 8(7) 153 Symmetry code: ⅰ 1-x, y, 0.5-z; ⅱ 1.5-x, 1.5-y, 1-z; ⅲ-0.5+x, 1.5-y, -0.5+z; ⅳ 1-x, 1-y, 1-z; ⅴ-x, y, 0.5-z; ⅵ 1-x, y, 1.5-z; ⅶ-x, 2-y, 1-z; ⅷ 1-x, 2-y, 1-z Table 3. Hydrogen bonds information in complexes 1 and 2As shown in Fig. 1a, the asymmetric unit of complex 1 contains a half of the molecule with the Co (Ⅲ) ion situated on a two-fold rotational axis. The centre Co (Ⅲ) ion is coordinated by two anionic TSC ligands with N2S donor sets, and thus possesses a distorted octahedron coordination geometry. There exists one free chloride anion (occupying two positions) in the outside of the complex for charge balance, although complex 1 is prepared by the reaction of the TSC ligand HL with CoCl2 in methanol medium. This is a normal phenomenon in the Co (Ⅲ) complexes with TSC ligands reported in literature[14]. The distances of Co-N/S bonds were in the range of 0.188 0(6)~0.220 4(4) nm, which were comparable with those found in the reported complexes with similar donor set. In the crystal, pairs of intermole-cular N-H…N hydrogen bonds link the complex cations into one-dimentional chains along c axis (Fig. 1c). Furthermore, a 3D supermolecular network is formed via the N-H…Cl hydrogen bonds between the chains and free chlorides. The intermolecular O-H…Cl hydrogen bonds between the crystal methanol molecules and chloride anions are also present (Table 3).
The coordination environment of central Cd (Ⅱ) ion in complex 2 (Fig. 1b) is quite similar as that of Co (Ⅲ) ion in complex 1. The distances of Cd-N/S bonds were in the normal range (0.229 8(6)~0.253 3(3) nm). In the crystal of 2, the intermolecular N-H…N hydrogen bonds link the complexes into chains, which were further linked with each other via intermolecular N-H…S hydrogen bonds to form extended 2D super-molecular network, as illustrated in Fig. 1d.
2.2 IR spectra
The infrared spectral bands most useful for determining the mode of coordination of the ligands are the ν(N=C), ν(N=C, pyrazine) and ν(S=C) vibra-tions. Such three bonds of the free TSC ligand is found at 1 594, 1 532 and 816 cm-1, while they shifts to lower frequency in complexes 1 and 2, clearly indicating the coordination of imine nitrogen, quinoline nitrogen and sulfur atoms[14]. It is in accordance with the X-ray diffraction analysis result.
2.3 DNA-binding studies
The application of electronic absorption spectros-copy is one of the most useful techniques in DNA-binding studies. The UV absorption spectra would change in accordance with the environmental condition changes, since the stacking interactions happened between the complexes and DNA[14, 17-18]. As shown in Fig. 2, with increasing DNA concentration, hypochromic (1) or hyperchromic (2) effect was observed, which indicated molecular level interactions between the complexes and DNA. In addition, the lack of the red shift suggests that the major binding modes of both complexes with DNA are not classical intercalative interaction[18]. The intrinsic binding constant (Kb) of 1 was determined to be 8.81×10³ L·mol-1 according to the literature method[14, 17], which is comparable with some Co (Ⅲ) complexes with TSCs ligands[14]. However, the absorption intensities change of 2 is obscure, thus its binding constant cannot be obtained reasonably.
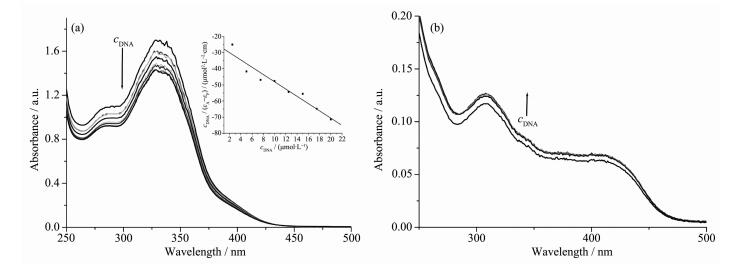 Figure 2.
Electronic spectra of the complexes 1 (a) and 2 (b) in Tris-HCl buffer (pH=7.2) upon addition of CT-DNA
Figure 2.
Electronic spectra of the complexes 1 (a) and 2 (b) in Tris-HCl buffer (pH=7.2) upon addition of CT-DNA
The emission experiment has been widely used to further confirm the interaction between the complexes and CT-DNA. The results of fluorescence titration spectra have also been confirmed to be effective for characterizing the binding mode of the metal complexes to DNA[17-18]. Fig. 3 shows the results of the emission titration curve of the complexes with CT-DNA. An increase in DNA concentration resulted slight increase and decrease in the emission intensity of complexes 1 and 2, respectively. Combining with the electronic absorption spectroscopy titration results and according to the literature, it can be roughly concluded that complexes 1 and 2 bind to DNA via electrostatic intercalation[17] and partial intercalation[18] modes, respectively.
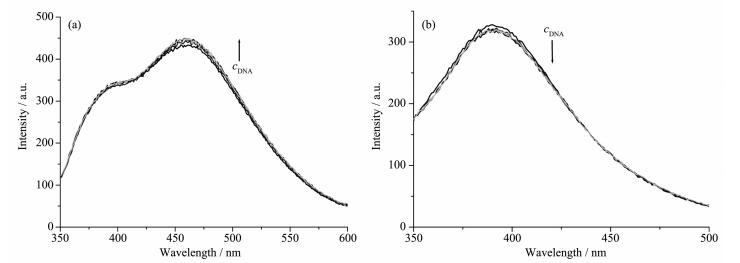 Figure 3.
Emission enhancement spectra of the complexes 1 (a) and 2 (b) in Tris-HCl buffer (pH=7.2) upon addition of CT-DNA
Figure 3.
Emission enhancement spectra of the complexes 1 (a) and 2 (b) in Tris-HCl buffer (pH=7.2) upon addition of CT-DNA
3 Conclusions
In summary, two transition metal complexes [CoL2]Cl·2CH3OH (1) and [CdL2] (2) were synthesized and characterized. The metal ion in each complex with a distorted octahedron geometry is surrounded by two anionic thiosemicarbazone ligand with N2S donor set. Complexes 1 and 2 can bind to DNA via electrostatic intercalation and partial intercalation modes, respectively. This indicates that both complexes have potential pharmaceutical activity.
-
-
[1]
Lobana T S, Sharma R, Bawa G, et al. Coord. Chem. Rev., 2009, 253:977-1055 doi: 10.1016/j.ccr.2008.07.004
-
[2]
Soares M A, Lessa J A, Mendes I C, et al. Bioorg. Med. Chem., 2012, 20:3396-3409 doi: 10.1016/j.bmc.2012.04.027
-
[3]
Huang H, Chen Q, Ku X, et al. J. Med. Chem., 2010, 53: 3048-3064 doi: 10.1021/jm9014394
-
[4]
Qi J, Su L, Gou Y, et al. Eur. J. Med. Chem., 2015, 96:360-368 doi: 10.1016/j.ejmech.2015.04.031
-
[5]
Zeglis B M, Divilov V, Lewis J S. J. Med. Chem., 2011, 54: 2391-2398 doi: 10.1021/jm101532u
-
[6]
Li M X, Zhang L Z, Yang M, et al. Bioorg. Med. Chem. Lett., 2012, 22:2418-2423 doi: 10.1016/j.bmcl.2012.02.024
-
[7]
Li M X, Zhang L Z, Zhang D, et al. Eur. J. Med. Chem., 2011, 46:4383-4390 doi: 10.1016/j.ejmech.2011.07.009
-
[8]
Li M X, Chen C L, Zhang D, et al. Eur. J. Med. Chem., 2010, 45:3169-3177 doi: 10.1016/j.ejmech.2010.04.009
-
[9]
Kalinowski D S, Yu Y, Sharpe P C, et al. J. Med. Chem., 2007, 50:3716-3729 doi: 10.1021/jm070445z
-
[10]
Lovejoy D B, Sharp D M, Seebacher N, et al. J. Med. Chem., 2012, 55:7230-7244 doi: 10.1021/jm300768u
-
[11]
闵睿, 范晓瑞, 周攀, 等.无机化学学报, 2014, 30: 1171-1177 http://www.wjhxxb.cn/wjhxxbcn/ch/reader/view_abstract.aspx?flag=1&file_no=20140805&journal_id=wjhxxbcnMIN Rui, FAN Xiao-Rui, ZHOU Pan, et al. Chinese J. Inorg. Chem., 2014, 30: 1171-1177 http://www.wjhxxb.cn/wjhxxbcn/ch/reader/view_abstract.aspx?flag=1&file_no=20140805&journal_id=wjhxxbcn
-
[12]
Bourosh P N, Revenko M D, Stratulat E F, et al. Russ. J. Inorg. Chem., 2014, 59:545-557 doi: 10.1134/S0036023614060059
-
[13]
Revenko M D, Bourosh P N, Stratulat E F, et al. Russ. J. Inorg. Chem., 2010, 55:1387-1397 doi: 10.1134/S0036023610090093
-
[14]
Ramachandran E, Thomas S P, Poornima P, et al. Eur. J. Med. Chem., 2012, 50:405-415 doi: 10.1016/j.ejmech.2012.02.026
-
[15]
Sheldrick G M. SADABS, University of Göttingen, Germany, 1996.
-
[16]
Sheldrick G M. SHELX-97, Program for the Solution and the Refinement of Crystal Structures, University of Göttingen, Germany, 1997.
-
[17]
曹丰璞, 丁呈华, 柳文敏, 等..无机化学学报, 2011, 27:343-347 http://www.wjhxxb.cn/wjhxxbcn/ch/reader/view_abstract.aspx?flag=1&file_no=20110223&journal_id=wjhxxbcnCAO Feng-Pu, DING Cheng-Hua, LIU Wen-Min, et al. Chinese J. Inorg. Chem., 2011, 27:343-347 http://www.wjhxxb.cn/wjhxxbcn/ch/reader/view_abstract.aspx?flag=1&file_no=20110223&journal_id=wjhxxbcn
-
[18]
Wang Y, Yang Z Y, Chen Z N. Bioorg. Med. Chem. Lett., 2008, 18:298-303 doi: 10.1016/j.bmcl.2007.10.085
-
[1]
-

Figure 1 ORTEP drawing of 1 (a) and 2 (b) with 30% thermal ellipsoids; (c) Chain-like structure along c axis formed via pairs of N-H…N hydrogen bonds in complex 1; (d) Extended 2D supermolecular structure in complex 2
Hydrogen bonds shown in dashed line; H atoms for C-H bonds are ommited for clarity; Symmetry code: ⅰ 1-x, y, 0.5-z; ⅱ 1.5-x, 1.5-y, 1-z; ⅲ-0.5+x, 1.5-y, -0.5+z; ⅴ-x, y, 0.5-z; ⅵ 1-x, y, 1.5-z; ⅶ-x, 2-y, 1-z; ⅷ 1-x, 2-y, 1-z

Figure 2 Electronic spectra of the complexes 1 (a) and 2 (b) in Tris-HCl buffer (pH=7.2) upon addition of CT-DNA
Inset: plots of cDNA/(εA-εF) vs cDNA of the titration of DNA with the complex 1, where εA and εF corresponded to the apparent extinction coefficient and the extinction coefficient for free complex 1, respectively; ccomplex=10 μmol·L-1, cDNA=0~20 μmol·L-1

Figure 3 Emission enhancement spectra of the complexes 1 (a) and 2 (b) in Tris-HCl buffer (pH=7.2) upon addition of CT-DNA
ccomplex=10 μmol·L-1, cDNA=0~10 μmol·L-1
Table 1. Crystal data and structure refinement for complexes 1 and 2
1 2 Empirical formula C24H26N8O2S2ClCo C22H18N8S2Cd Formula weight 645.66 570.96 T/K 296(2) 296(2) λ/ nm 0.071 073 0.071 073 Crystal system Monoclinic Monoclinic Space group C2/c P2/c a/ nm 1.579(4) 1.745(2) b/ nm 1.156(3) 0.809 4(11) c / nm 1.762(5) 1.581(2) β /(°) 112.55(5) 109.34(2) V/nm 3 2.970(14) 2.107(5) Z 4 4 Dc / (g·cm -3) 1.380 1.800 Absorption coefficient / mm -1 0.844 1.265 F(000) 1 272 1 144 Reflection collected, unique (Rint) 7 337, 2 611 (0.056 5) 10 313, 3 696 (0.063 6) Data, restraints, parameters 2 611, 0, 179 3 696, 0, 298 Goodness-of-fit (GOF) on F2 1.069 1.021 Final R indices [I > 2σ(I)] R1=0.065 8, wR2=0.198 1 R1=0.053 4, wR2=0.100 7 R indices (all data) R1=0.094 8, wR2=0.223 8 R1=0.101 8, wR2=0.120 9 Largest peak and hole / (e·nm-3) 1 088 and-365 1 388 and-827  下载: 导出CSV
Table 2. Selected bond lengths (nm) and angles (°) in complexes 1 and 2
1 Co1-N1 0.199 5(6) Co1-N2 0.188 0(6) Co1-S1 0.220 4(4) N2ⅰ-Co1-N2 171.0(3) N1-Co1-N1ⅰ 90.7(3) N2-Co1-S1 86.2(2) N2ⅰ-Co1-N1 92.5(2) N2-Co1-S1ⅰ 87.6(2) N1-Co1-S1 179.31(15) N2-Co1-N1 93.8(2) N1-Co1-S1ⅰ 88.6(2) S1i-Co1-S1 92.1(2) 2 Cd1-N1 0.244 0(7) Cd1-N2 0.229 8(6) Cd1-S1 0.253 3(3) Cd1-N5 0.241 9(7) Cd1-N6 0.230 7(6) Cd1-S2 0.251 3(3) N2-Cd1-N6 170.1(2) N5-Cd1-N1 85.0(3) N2-Cd1-S1 75.51(16) N2-Cd1-N5 110.4(2) N2-Cd1-S2 101.47(16) N6-Cd1-S1 98.42(16) N6-Cd1-N5 76.2(2) N6-Cd1-S2 75.04(16) N5-Cd1-S1 83.71(19) N2-Cd1-N1 76.8(2) N5-Cd1-S2 143.24(16) N1-Cd1-S1 144.12(16) N6-Cd1-N1 111.7(2) N1-Cd1-S2 84.83(18) S2-Cd1-S1 122.76(12) Symmetry code: ⅰ 1-x, y, 0.5-z
下载: 导出CSV
Table 3. Hydrogen bonds information in complexes 1 and 2
D-H…A d (D-H)/nm d (H…A) /nm d (D…A) / nm ∠DHA/(°) 1 N4—H4B …Cl1 0.086 0.233 0.314 0(9) 157.7 O1—H1A …Cl1ⅰ 0.082 0.249 0.325 1(13) 153.9 N4—H4B …Cl1ⅱ 0.086 0.246 0.326 6(9) 156.2 N4-H4A …N3ⅲ 0.086 0.213 0.297 3(8) 167.5 O1-H1A …Cl1ⅳ 0.082 0.294 0.342 2(15) 119.3 2 N4-H4A …N3ⅴ 0.086 0.226 0.302 3(9) 148.5 N8-H8A …N7ⅵ 0.086 0.224 0.306 0(9) 160.3 N4-H4B …S1ⅶ 0.086 0.266 0.348 3(7) 161 N8—H8B …S2ⅷ 0.086 0.271 0.349 8(7) 153 Symmetry code: ⅰ 1-x, y, 0.5-z; ⅱ 1.5-x, 1.5-y, 1-z; ⅲ-0.5+x, 1.5-y, -0.5+z; ⅳ 1-x, 1-y, 1-z; ⅴ-x, y, 0.5-z; ⅵ 1-x, y, 1.5-z; ⅶ-x, 2-y, 1-z; ⅷ 1-x, 2-y, 1-z
下载: 导出CSV
-


 扫一扫看文章
计量
- PDF下载量: 0
- 文章访问数: 949
- HTML全文浏览量: 117
 下载:
下载:
