 Figure 1.
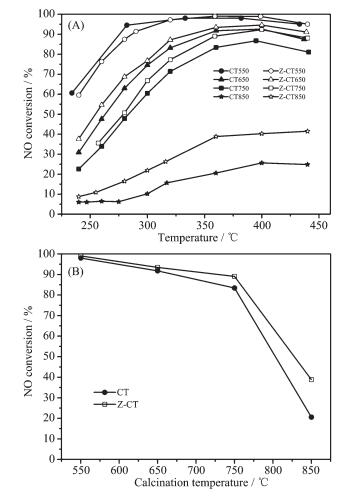
(A) NO conversion as a function of temperature;
(B) NO conversion tested at 360 ℃ as a function of calcination temperature
Figure 1.
(A) NO conversion as a function of temperature;
(B) NO conversion tested at 360 ℃ as a function of calcination temperature
Citation:
XU Bao-Qiang, XU Hai-Di, CAO Yi, LAN Li, YANG Yi, ZHANG Yan-Hua, LI Yuan-Shan, GONG Mao-Chu, CHEN Yao-Qiang. Promotional Effect of Zr on Thermal Stability of CeTiOx Monolith Catalyst for Selective Catalytic Reduction of NOx with Ammonia[J]. Chinese Journal of Inorganic Chemistry,
2016, 32(3): 517-526.
doi:
10.11862/CJIC.2016.039

Zr的添加对提高NH3选择性催化还原NOx整体式催化剂热稳定性的影响
摘要:
采用共沉淀的方法制备了CeTiOx和CeZrTiOx两种用于NH3选择性催化还原NOx的催化剂.两种催化剂在不同的高温条件下进行热老化以考察Zr的添加对CeTiOx催化剂热稳定性的影响.NH3-SCR活性数据显示, 经过650、750和850 ℃的高温老化处理, Zr改性后的催化剂较CeTiOx催化剂具有更好的催化活性和N2选择性.XRD、Raman和H2-TPR结果表明添加Zr可以阻止Ce物种的烧结并且抑制金红石相TiO2的生成.催化剂的SEM图像显示Zr的添加可以抑制颗粒随着焙烧温度升高而产生的聚集长大.XPS的Ce3d光谱表明, 随着老化温度的提升, CeTiOx催化剂表面的Ce3+/Ce4+比相对于CeZrTiOx催化剂下降更加明显.这意味着随着Zr的添加, 更多的晶格缺陷和氧空缺出现在Zr改性催化剂的表面, 这有利于催化性能的提升.另外, NH3-TPD结果表明经过相同的高温老化, 改性的催化剂保持了更多的Brönsted酸性位, 提高了催化活性并抑制了氨的氧化.因此, Zr的添加提高了催化剂的热稳定性能.
English
Promotional Effect of Zr on Thermal Stability of CeTiOx Monolith Catalyst for Selective Catalytic Reduction of NOx with Ammonia
Abstract:
CeTiOx and CeZrTiOx catalysts were prepared by co-precipitation method and used for selective catalytic reduction of NOx by NH3 (NH3-SCR). Thermal aging of the two catalysts was conducted at various temperatures to investigate the effect of Zr on thermal stability of CeTiOx catalyst. The NH3-SCR performance of the catalysts showed that the Zr-modified catalyst exhibited better activity and N2 selectivity than CeTiOx catalyst after high temperature aging at 650, 750 and 850 ℃. The XRD, Raman and H2-TPR results illustrated that the addition of Zr could prevent Ce species from sintering and inhibit the formation of rutile TiO2. The SEM images of the catalysts revealed that the aggregation of the particles with increasing calcination temperature could be inhibited by addition of Zr. From the XPS spectra of Ce3d, the ratio of Ce3+/Ce4+ of CeTiOx decreased more sharply than that of CeZrTiOx with the aging temperature, meaning that more crystal defects and oxygen vacancies were preserved after Zr addition, which led to increased catalytic performance. In addition, NH3-TPD results implied that modified catalyst possessed larger amounts of Brönsted acid sites after calcining at a same temperature, improving the activity and inhibiting the NH3 oxidation. Thus, a conclusion could be drawn that Zr addition improved the thermal stability of the CeTiOx catalyst.
-
Key words:
- cerium titanium mixed oxides
- / zirconium
- / thermal stability
- / selective catalytic reduction
- / NOx
-
NOx is a kind of the main air pollutants which can cause some environmental issues, such as acid rain and photochemical smog[1-2]. NH3-SCR technology is one of the most advanced methods to remove NOx exhausted from automobile at present[3]. The widely used NH3-SCR catalyst is the commercial V2O5-WO3(MoO3)/TiO2, however, the toxicity of V2O5 and the generated high concentration of N2O above 450 ℃ limited the practical applications of the V-based catalysts for diesel vehicles[4]. So it is necessary to develop an environmentally friendly NH3-SCR catalyst to remove NOx.
Recently, CeTiOx has been considered to be a promising catalyst for NH3-SCR with high activity and excellent selectivity to N2[5-6]. Xu et al.[5] revealed that Ce/TiO2 catalysts with more 5% Ce showed excellent NH3-SCR performance in the temperature range of 275~400 ℃. In general, catalytic activity, N2 selectivity and stability of SCR catalyst are important parameters to evaluate its performance. Therefore, a lot of works including doping Cu[7-8], Mn[9-10], W[4] and Co[11] into CeTiOx catalyst was done aiming at further improving its activity and selectivity to N2. On the other side, Diesel Particulate Filters (DPF) used for eliminating particulate matter (PM) is required by the future regulations. The periodic regeneration of the filter may lead to the exhaust temperature up to 850 ℃ and then reduce the thermal stability of the catalysts[12]. However, anatase TiO2 was easy to transfer to rutile TiO2 after high-temperature treatment[13], which results in decreasing the NH3-SCR performance of CeTiOx catalysts after the above high temperature, so the thermal stability of CeTiOx catalyst has become a critical issue to be solved. Zr addition could improve the stability and redox property of Ce-based oxygen storage materials which is widely used in TWC (Three-Way-Catalyst)[14]. It was also reported that Zr based catalysts used for NH3-SCR usually possess good thermal stability[15]. Verdier et al.[12] prepared a series of acidic zirconia materials for NH3-SCR catalysts which showed good thermal stability after harsh aging. Xu et al.[16] compared the thermal stability of Ce/ZrTiSiW with commercial V2O5-based catalyst and Fe-ZSM-5, the results suggested the high tolerance to thermal shock of the zirconia-based catalyst. Other Zr based catalysts, such as CuOx /WOx-ZrO2[17], Cu-Ce-Mn/ZrO2[18], CeZrTiSiW[16, 19] and MnOx-CeO2/WO3-ZrO2[20] also showed good stability.
In this work, CeTiOx and CeZrTiOx catalysts were prepared and their NH3-SCR performances were compared after different calcination temperature. XRD, XPS, H2-TPR, BET and NH3-TPD were used to characterize the effect of Zr addition on the thermal stability of CeTiOx catalyst.
1 Experimental
1.1 Catalyst preparation
CeTiOx and CeZrTiOx catalysts were prepared by the conventional co-precipitation method. Cerium nitrate (AR grade, Jinshan, Chengdu, China), zirconyl nitrate hydrate (AR grade, 99%, Yutai, Shangdong, China) and titanylsulfate (AR grade, Dandong, Liaoning, China) were used as precursors. The precursors mixed in an aqueous solution were then precipitated with an alkaline buffer solution until the pH reached approximately 9. The obtained precipitates were dried at 90 ℃ for 24 h and then calcined at 550 ℃ for 3 h in air. The CeTiOx catalyst, with Ce/Ti mole ratio at 0.2, was denoted as CT. The CeZrTiOx catalyst, with Zr/Ti mole ratio at 0.3 and Ce/Ti mole ratio at 0.2, was denoted as Z-CT.
The well-proportioned slurry obtained from mixing appropriate amount of water and the as-prepared powders were coated on honeycomb cordierites (cylinder, diameter: 11 mm, length: 26 mm, bulk: 2.5 cm3, 62 cell·cm-2, Corning Ltd., USA). Then the monolith catalysts were dried at 90 ℃ for 12 h, followed by calcining at 550 ℃ for 3 h in air. Finally, the monolith catalysts were obtained with the catalyst loading of about 160 g·L-1.
CT and Z-CT catalysts were calcined at 650, 750 and 850 ℃ for 3 h as the thermal aged catalysts to investigate the effect of Zr addition on the thermal stability of CT catalyst. The two series of catalysts treated at different temperatures were noted as CT550, CT650, CT750, CT850, Z-CT550, Z-CT650, Z-CT750 and Z-CT850.
1.2 Catalyst characterization
The surface area, pore size, and pore volume of the catalysts were measured with the Brunauer-Emmett-Teller (BET) method by N2 adsorption at-196 ℃ on a Quantachrome automated surface area and pore size analyzer (Autosorb SI). The samples were pretreated at 300 ℃ for 3 h prior to the measurement.
Powder X-ray diffraction (XRD) experiments were performed on a Rigaku D/max-RA diffractometer using Cu Kα (λ= 0.154 06 nm) radiation. The tube voltage and current were 40 kV and 100 mA, respectively. The XRD powder diffractogram was recorded at 0.03°·s-1 intervals in the range of 20°~80°. The crystalline phases were identified using reference data from the International Center Diffraction Data (ICDD).
X-ray photoelectron spectroscopy (XPS) data were obtained by a British Kratos XSAM-800 electron spectrometer using 13 kV high voltage, 20 mA electron current and Mg Kα radiation. The C1s peak (284.8 eV) was used for the calibration of the binding energy values. The pressure in the analytical chamber was about 1×10⁻⁹ Pa.
Temperature-programmed desorption experiments of NH3 (NH3-TPD) were carried out on a fixed bed quartz reactor. A sample mass of 100 mg and a gas flow rate of 30 mL·min-1 were used. The experiment included four stages: (1) degasification of the sample in Ar at 450 ℃ for 1 h, (2) adsorption of 2% NH3 at 80 ℃ for 1 h, (3) isothermal desorption in Ar at 80 ℃ until no NH3 was detected, and (4) temperature programmed desorption in Ar (TPD stage) at 8 ℃·min-1 up to 600 ℃. The detector was a thermal conductivity detector.
Temperature-programmed reduction with H2 (H2-TPR) experiments were carried out on a self-assembled experimental equipment with a thermal conductivity detector. All samples (100 mg) were pretreated in a quartz tubular micro-reactor in a flow of pure N2 at 450 ℃ for 1 h, and then cooled to room temperature. The reduction was carried out in a flow of 5% H2-95% N2 from room temperature to 900 ℃ with a heating rate of 8 ℃·min-1.
1.3 Catalytic activity tests
The catalytic activity measurement of the prepared monolithic catalysts was carried out in a fixed-bed quartz flow reactor. The concentrations of simulated gases were as follows: 0.1% NO, 0.1% NH3, 5% O2, balanced with N2. The volume of the catalyst used for activity test was 2.5 mL and the total flow rate was 1 250 mL·min-1, yielding the GHSV of 30 000 h-1. The original and effluent NO concentrations at different temperatures were continually detected by an IR detector (ANTARIS IGS Analyzer, Thermo scientific). The data were collected after the reaction was stabilized for 30 min at each temperature.
The NOx conversions and N2 selectivity (SN2) were calculated as follows:
φ denoted the volume concentration of the gases
2 Results and discussion
2.1 SCR performance
Activities of CT and Z-CT catalysts calcined at different temperatures were carried out to compare their SCR performance. It was shown in Fig. 1(A) that the fresh catalysts calcined at 550 ℃ performed excellent NOx conversion in a wide temperature range. The activity of the two catalysts declined to different extents after higher temperature calcination. To get a clear knowledge of the decrease of the activity with the change of calcination temperature, NO conversion tested at 360 ℃ as a function of calcination temperature was drawn in Fig. 1(B). It showed that there was hardly any difference between the activities of CT and Z-CT catalysts after calcination at 550 ℃. While Z-CT performed better NOx conversion than the catalyst without Zr addition after aging at 650, 750 and 850 ℃. Moreover, it was distinct that the catalytic activity of CT dropped more sharply than that of Z-CT catalyst with increasing calcined temperature. In a short word, Z-CT catalysts could keep higher NH3-SCR activity compared with CT catalysts after thermal aging at different temperature, indicating the addition of Zr improve the thermal stability of the CT catalyst.
Figure 1.
(A) NO conversion as a function of temperature;
(B) NO conversion tested at 360 ℃ as a function of calcination temperature
Moreover, N2O, as one of the greenhouse gases, can absorbed infrared radiation with 270-time higher intensity than carbon dioxide (CO2)[1]. So N2 selectivity was an important factor to evaluate NH3-SCR performance of CT and Z-CT catalysts. N2 selectivity of the two catalysts calcined at different temperatures was shown in Fig. 2. All the catalysts had nearly 100% N2 selectivity and the Z-CT throughout performed slightly better than CT catalyst, especially N2 selectivity of Z-CT550 and Z-CT650 catalysts was obviously higher than that of CT550 and CT650 catalysts above 350 ℃. The results implied that Zr addition promoted not only the NH3-SCR activity but also the N2 selectivity of CT catalysts.
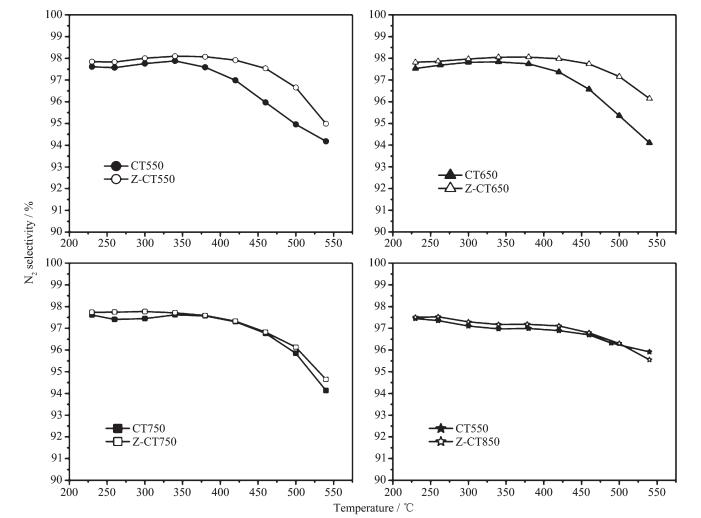 Figure 2.
N2 selectivity of the catalysts
Figure 2.
N2 selectivity of the catalysts
2.2 XRD and Raman
To clarify the process of phase transition of CT and Z-CT catalysts with increasing calcination temperature, XRD measurement was performed and the results were shown in Fig. 3. No distinct diffraction peaks could be seen over CT550 and Z-CT550 catalysts from the patterns, suggesting that the amorphous metal oxides may be obtained after calcining at 550 ℃. After thermal aging at 650, cerium oxide phase and anatase TiO2 phase were observed in the XRD patterns of CT, while no obvious crystallization happened over Z-CT catalyst. It indicated that adding Zr to CT could inhibit the formation of TiO2 and CeO2 crystallites.
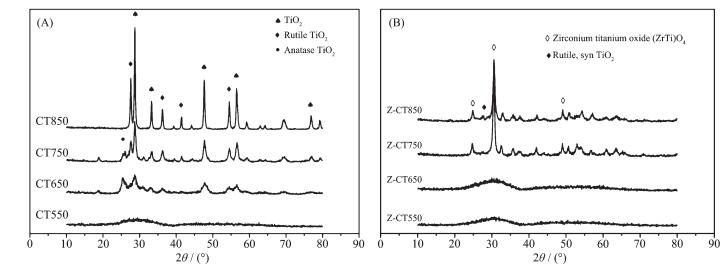 Figure 3.
XRD patterns for CT (A) and Z-CT (B) catalysts
Figure 3.
XRD patterns for CT (A) and Z-CT (B) catalysts
It should be noted that rutile TiO2 was observed in the profiles of CT750; in contrast, no rutile TiO2 could be observed over Z-CT, suggesting that formation of rutile TiO2 was inhibited by introduction of Zr. It is well known that the transition from anatase to rutile TiO2 would lead to the decrease of specific surface area and oxygen vacancies[22], which would result in the decrease of the catalytic activity. Thus, the NH3-SCR activity of Z-CT catalyst was better than that of CT catalyst after calcined at above 650 ℃. Moreover, a new phase of ZrTiO4 solid solution was detected from Z-TC catalyst after calcining at 750 ℃, which could be the reason that no rutile TiO2 was detected in the catalyst with Zr addition.
The phases of TiO2 and CeO2 was absolutely crystallized after calcination at 850 ℃, thus the SCR activity of CT was rapidly declined. ZrTiO4 was still the main diffraction phase from XRD curve of Z-CT850 catalyst, and only small amount of rutile TiO2 was observed compared with CT catalyst. Thus, it could be concluded that addition of Zr into CT catalyst inhibited the TiO2 phase transition from anatase to rutile.
Furthermore, there were no XRD peaks attributed to CeO2 species for Z-CT at any calcined temperature; while cubic CeO2 could be obviously detected over CT catalysts beside CT550, moreover, the grain size of CeO2 was gradually increased with rising the thermal aging temperature of CT. The result showed that the Zr addition could prevent the Ce species from sintering and hold the lattice defects over Z-CT catalysts under high-temperature thermal aged. It is known that the amorphous state of the active component is more active than its crystalline form, because the former could create much larger amount of crystal defects and oxygen vacancies on the surface of catalyst and then improve the catalytic activity[2]. It summarized briefly that the introduction of Zr into CT catalyst can inhibit the phase change from anatase TiO2 to rutile TiO2 and the sintering of active amorphous CeO2 in the process of high-temperature thermal aging, which result in the Z-CT catalyst had better activity than CT catalysts after high temperature calcination.
As a potential complementary characterization of XRD, Raman spectroscope was employed to detect the surface information of both CT and Z-CT catalysts thermally aged at different temperatures. Fig. 4(A) showed the corresponding results of Raman spectroscope from 100 to 750 cm-1 over CT catalyst. The peaks located at 142, 194 and 642 cm-1 were attributed to anatase TiO2, while peaks located at 233, 443 and 610 cm-1 were the typical Raman bands due to rutile TiO2. It was obvious that the anatase TiO2 was totally transformed into rutile TiO2 when the aging temperature rose from 750 to 850 ℃. The F2g mode of cubic fluorite CeO2 phase located at 465 cm-1 appeared and became sharper with temperature rising, which was in line with the XRD results of CT.
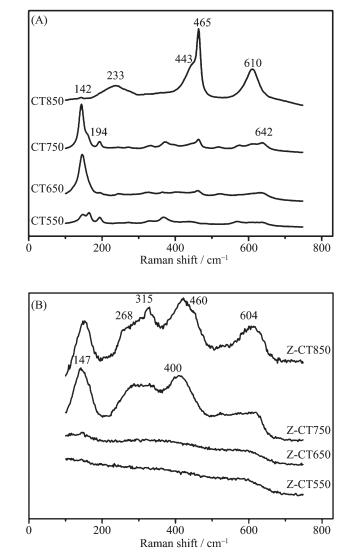 Figure 4.
Raman spectra for CT (A) and Z-CT (B) catalysts
Figure 4.
Raman spectra for CT (A) and Z-CT (B) catalysts
Fig. 4(B) showed the Raman profiles of Z-CT catalyst caicined at different temperatures. The peaks located at 147, 268, 315, 460 and 604 cm-1 were attributed to tetragonal ZrO2 and the peaks located at 147 and 400 cm-1 were attributed to the anatase TiO2. No Raman bands appeared over Z-CT550 and Z-CT650, meaning that the catalysts were in the amorphous state. After Z-CT was calcined at 750 and 850 ℃, peaks belonging to ZrO2 and anatase TiO2 were observed. But the wave numbers were slightly different compared with the pure ZrO2 and anatase TiO2. This might be caused by the formation of ZrTiO4 solid solution, leading to the change of the electronic environment.
Combined with the results of XRD and Raman, a conclusion could be drawn that the addition of Zr stabilized the structure of CT catalyst.
2.3 SEM
The SEM images of the catalysts were shown in Fig. 5 at 100 K magnification. Catalysts calcined at 550 and 650 ℃ seemed to be flocculent and the average sizes of the particles were too fuzziness to statistics. It was obvious that the particle sizes grew with increasing calcination temperature, so it was available to calculate the particle sizes after calcining at 750 and 850 ℃. The average particle sizes of CT750 and CT850 catalysts were about 23 and 45 nm respectively, while the data of Z-CT calcined at the same temperatures were about 19 and 37 nm severally. It was distinctly presented that Zr addition inhibited the aggregation of the particles, and then enhanced the structure stability of CT catalyst.
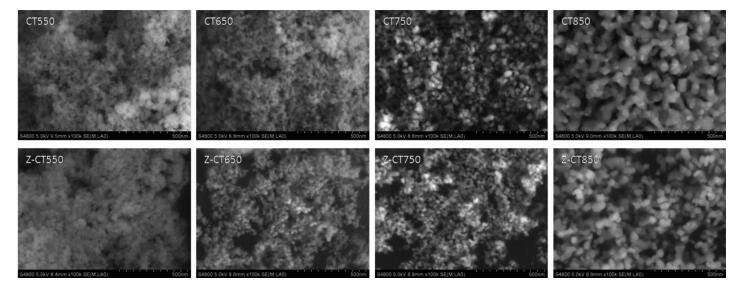 Figure 5.
SEM images of the catalysts
Figure 5.
SEM images of the catalysts
2.4 H2-TPR
Fig. 6(A) showed the H2-TPR profiles of the CT catalysts with different calcination temperatures. Two H2 reduction peaks at 579 and 642 ℃ attributed to the surface and bulk Ce species respectively, were observed over CT550 catalyst[23]. With increasing calcination temperature, a reduction peak of bulk CeO2 at over 800 ℃ was gently emerged and shifted to higher temperature, which was account of the grain growth of CeO2 with aging temperature rising confirmed by XRD and Raman. The peak at about 600 ℃ was attributed to the reduction of oxygen linked to surface ceria. After the catalyst was calcined at 850 ℃, the two peaks at 542 and 674 ℃ were very weak. In fact, the actual catalytic activity was controlled by the rates of redox cycles. The rate of cerium oxidation was fast, while the reduction of ceria was generally sluggish[24]. The fact that Z-CT was less reducible at low temperature was in line with its poor NH3-SCR performance. Nearly all the H2 consumption happened at temperature higher than 800 ℃, meaning that Ce species were in the crystalline state, which was in accordance with the XRD results.
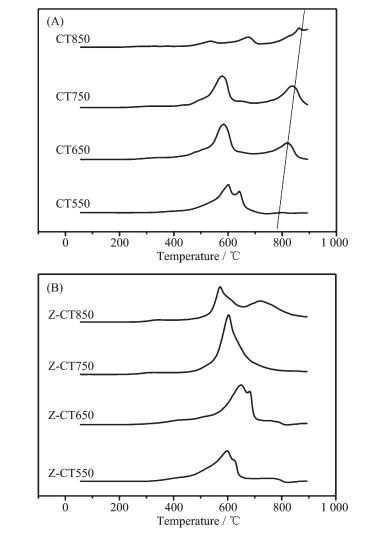 Figure 6.
H2-TPR profiles of CT (A) and Z-CT (B) catalysts calcined at different temperatures
Figure 6.
H2-TPR profiles of CT (A) and Z-CT (B) catalysts calcined at different temperatures
Compared with CT catalyst after thermal aging, no H2 consumption belonging to bulk CeO2 was detected after Zr addition. The peak at about 717 ℃ on profile of Z-CT850 could be attributed to the reduction of zirconia. The results meant that Zr prevented the Ce species from sintering, which was in line with the result of XRD. Moreover, the H2 consumption of Z-CT was higher than CT, meaning that Zr modified sample showed better reducibility and thus improved the NH3-SCR activity.
2.5 XPS
The Ce3d XPS spectra for CT and Z-CT catalysts were presented in Fig. 7. The XPS peaks denoted as u1 and v1 represented Ce3+, while those denoted as u, u2, u3, v, v2, and v3 could be assigned to Ce4+. It is known that oxidation-reduction cycle occurs between Ce (Ⅲ) and Ce (Ⅳ), while generally most Ce in the catalyst is in the state of Ce (Ⅳ)[25]. But Ce3+ could create a charge imbalance, the vacancies and unsaturated chemical bonds on the surface of the catalyst, which will lead to an increase of chemisorbed oxygen on the surface of the catalyst[26-27]. Therefore, the value of Ce3+/Ce4+, can reflect the redox properties or even the catalytic activity of the catalyst in some extent. The ratio of Ce3+/Ce4+ was a calculation of total area of u1 and v1 attributed to Ce3+ divided by the total area of the six peaks assigned to Ce4+. Values of Ce3+/Ce4+ of different catalysts were listed in Table 1. The values of Ce3+/Ce4+ were always lower than 1 from Table 1, indicating Ce4+ was the main valence state of Ce in the two series of catalysts.
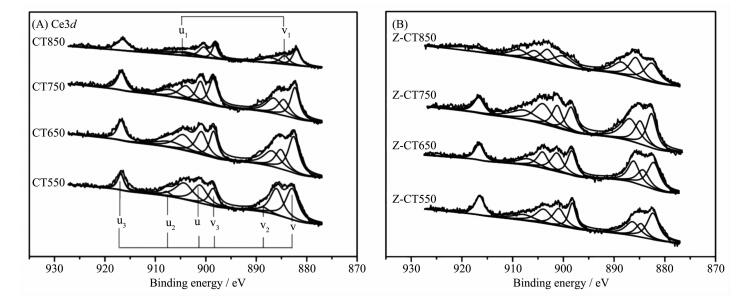 Figure 7.
Ce3d XPS for (A) CT and (B) Z-CT catalysts
Figure 7.
Ce3d XPS for (A) CT and (B) Z-CT catalysts
 Table 1.
Ratio of Ce3+/Ce4+ of the catalysts calcined at different temperatures
Table 1.
Ratio of Ce3+/Ce4+ of the catalysts calcined at different temperatures
Sample Ratio of Ce3+/Ce4+ 550 ℃ 650 ℃ 750 ℃ 850 ℃ CT 62.3% 34.1% 31.1% 24.6% Z-CT 62.4% 42.0% 38.2% 35.6% Ce3+/Ce4+ of CT550 catalyst were as same as that of Z-CT550 catalyst; however, the values of two catalyst were both gradually decreased with rising the calcination temperature, while Ce3+/Ce4+ of Z-CT catalysts was always evidently higher than that of CT catalysts. More amount of Ce3+ represented higher oxygen storage capacity and redox properties of the catalyst[25], which was in accordance with the result of H2-TPR and crucial to the SCR reaction. Furthermore, it was reported that the presence of Ce3+ could create the surface defects and the number of surface defects would be decreased with the growth of the ceria particles[28]. From XRD and XPS results, it could be seen that rising aging temperature could be beneficial to the crystallization of ceria nanoparticles and harmful to the maintenance of ceria defects and Ce3+.
Combined with the above analysis, Z-CT catalyst possessed larger amount of Ce3+/Ce4+ than those of CT catalysts, except the catalysts calcined 550 ℃, so higher oxygen storage capacity and redox properties, as well as more surface defects co-contributed to higher NH3-SCR activities of Z-CT catalysts.
2.6 NH3-TPD
To investigate the effect of calcination temperature on the changes of the surface acid amount and the distribution of acidic sites of CT and Z-CT catalysts, temperature-programmed desorption of NH3 experiments were performed. As shown in Fig. 8, a similar broad NH3 desorption peak was observed both in CT550 and Z-CT550 catalysts, indicating that there was little difference of the acid amount and acidic sites between the two catalysts. The intensities of NH3 desorption peaks were obviously dropped when the calcination temperature rose, but Z-CT catalysts kept higher peak intensity than CT catalysts at the same calcined temperature. The above phenomena illustrated that Z-CT catalysts had higher surface acid and more acidic sites than CT catalysts even if suffered high-temperature thermal aging. Accordingly, more NH3 adsorption on Z-CT catalysts than CT catalysts make contribution to maintain higher SCR activity and N2 selectivity[4, 29] of Z-CT catalysts.
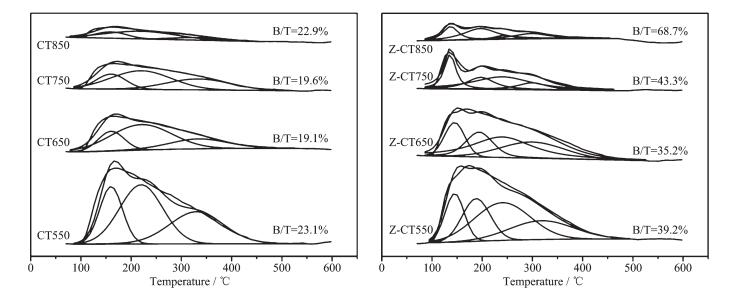 Figure 8.
NH3-TPD profiles for the catalysts
Figure 8.
NH3-TPD profiles for the catalysts
As was known that NH3 adsorbed on the surface of catalyst in two states: (a) ammonia adsorbed as ammonium ions, over Brönsted acidic-OH surface hydroxyl groups; and (b) molecularly adsorbed ammonia, through a Lewis-type interaction on coordinatively unsaturated cations[30]. It was well known that ammonia adsorbed on Brönsted acid sites desorbed at lower temperatures than that on Lewis acid sites[30-31]. For CeTiOx catalyst, NH3 desorption peaks located at 80~200 ℃ were attributed to Brönsted acid sites and the Lewis acid sites were at 230~350 ℃[32]. As was shown in Fig. 8(B), peaks located at about 140 and 190 ℃ were belonged to Brönsted acid sites and peaks located at 245 and 306 ℃ were belonged to Lewis acid sites. For CT catalyst, peak located at about 152 ℃ was belonged to Brönsted acid sites. Peak areas of Brönsted acid sites and total acid sites and ratios of B/T for the catalysts were shown in Table 2. It was obvious that the Brönsted acidity on CT surface decreased more sharply than that of Z-CT after thermal aging. There was an interesting fact that pure TiO2 only showed Lewis acidity and poor catalytic activity for SCR. However, when sulfated, strong Brönsted acidity was formed[33] and SCR activity was strongly enhanced[34]. This meant that Brönsted acidity played an important role in the SCR reaction. Moreover, it had been reported that the introduction of Brönsted acid sites weakened the strong oxidation of ammonia but enhanced the ammonia adsorption capacity of catalyst. Therefore, the N2 selectivity and activity of catalysts were improved[35]. The enhancement of NH3-SCR performance after Zr addition was attributed to the fact that Zr improved the thermal stability of Brönsted acidity and therefore improved the activity and N2 selectivity.
Table 2.
Peak areas of Ba and Tb sites and ratios of B/T for the catalysts
Area of B sites Area of T sites B/T CT Z-CT CT Z-CT CT Z-CT 550 255.4 414.79 1 101.9 1 059.9 23.1% 39.2% 650 100.4 284.9 526.5 809.2 19.1% 35.2% 750 86.38 197.5 440.3 455.8 19.6% 43.3% 850 38.1 154.8 166.3 225.2 22.9% 68.7% a B denoted the Brönsted acid sites; b T denoted total acid sites 3 Conclusions
Effect of Zr on the thermal stability of Ce-Ti monolith NH3-SCR catalyst was investigated in this study. Catalytic activity results showed that Z-CT performed better than CT after high temperature treatment at 650, 750 and 850 ℃. The introduction of Zr into CT catalysts could prevent the Ce species from sintering and inhibit the phase transformation TiO2 from anatase to rutile in the process of high-temperature thermal aging, suggesting the structural properties of CT catalysts were stabilized by the addition of Zr. More amount of Ce3+/Ce4+ indicated higher redox properties and more surface defects over Z-CT catalysts than CT catalysts, suggesting the redox properties of CT catalysts were stabilized by the addition of Zr. In addition, Zr modified catalysts possessed more Brönsted acidic sites than CT catalysts, suggesting the surface acidic properties of CT catalysts were stabilized by the addition of Zr. Therefore, it could be concluded that the addition of Zr promoted the thermal stability of CT catalysts.
-
-
[1]
Skalska K, Miller J S, Ledakowicz S. Sci. Total Environ., 2010, 408:3976-3989 doi: 10.1016/j.scitotenv.2010.06.001
-
[2]
Li J, Chang H, Ma L, et al. Catal. Today, 2011, 175:147-156 doi: 10.1016/j.cattod.2011.03.034
-
[3]
Liu Z, Ihl Woo S. Catal. Rev., 2006, 48:43-89 doi: 10.1080/01614940500439891
-
[4]
Shan W, Liu F, He H, et al. Appl. Catal. B: Environ., 2012, 115:100-106 http://www.sciencedirect.com/science/article/pii/S0926337311005893
-
[5]
Xu W, Yu Y, Zhang C, et al. Catal. Commun., 2008, 9:1453-1457 doi: 10.1016/j.catcom.2007.12.012
-
[6]
Gao X, Jiang Y, Zhong Y, et al. J. Hazard. Mater., 2010, 174: 734-739 doi: 10.1016/j.jhazmat.2009.09.112
-
[7]
Du X, Gao X, Cui L, et al. Appl. Surf. Sci., 2013, 270:370-376 doi: 10.1016/j.apsusc.2013.01.032
-
[8]
Gao X, Du X, Cui L, et al. Catal. Commun., 2010, 12:255-258 doi: 10.1016/j.catcom.2010.09.029
-
[9]
Liu Z, Zhu J, Li J, et al. ACS Appl. Mater. Interfaces, 2014, 6: 14500-14508 doi: 10.1021/am5038164
-
[10]
吴大旺, 张秋林, 林涛, 等.无机化学学报, 2011, 27(1):53-60 http://www.wjhxxb.cn/wjhxxbcn/ch/reader/view_abstract.aspx?flag=1&file_no=20110110&journal_id=wjhxxbcnWU Da-Wang, ZHANG Qiu-Lin, LIN Tao, et al. Chinese J. Inorg. Chem., 2011, 27(1):53-60 http://www.wjhxxb.cn/wjhxxbcn/ch/reader/view_abstract.aspx?flag=1&file_no=20110110&journal_id=wjhxxbcn
-
[11]
Shang D, Zhong Q, Cai W. Appl. Surf. Sci., 2015, 325:211-216 doi: 10.1016/j.apsusc.2014.11.056
-
[12]
Verdier S, Rohart E, Bradshaw H, et al. SAE Paper, 2008-01-1011
-
[13]
Yang Z, Zhang N, Cao Y, et al. Catal. Sci. Technol., 2014, 4: 3032 doi: 10.1039/C4CY00424H
-
[14]
Kašpar P F J, Graziani M. Catal. Today, 1999, 50:285-298 doi: 10.1016/S0920-5861(98)00510-0
-
[15]
Reddy B M, Khan A. Catal. Rev., 2007, 47:257-296 http://www.sciencedirect.com/science/article/pii/S1381116906013100
-
[16]
Xu H, Wang Y, Cao Y. et al. Chem. Eng. J., 2014, 240:62-73 doi: 10.1016/j.cej.2013.11.053
-
[17]
Si Z, Weng D, Wu X, et al. J. Catal., 2010, 271:43-51 doi: 10.1016/j.jcat.2010.01.025
-
[18]
Lu H, Zhou Y, Han W, et al. Appl. Catal. A: Gen., 2013, 464:101-108 http://www.sciencedirect.com/science/article/pii/S0926860X13003189
-
[19]
Marcotte N, Coq B, Savill-Jovitt C, et al. Appl. Catal. B: Environ., 2011, 105:373-376 doi: 10.1016/j.apcatb.2011.04.022
-
[20]
徐海迪, 房志涛, 曹毅, 等.催化学报, 2012, 33(12):1927-1937 http://www.cnki.com.cn/Article/CJFDTotal-CHUA201212012.htmXU Hai-Di, FANG Zhi-Tao, CAO Yi, et al. Chinse J. Catal., 2012, 33(12):1927-1937 http://www.cnki.com.cn/Article/CJFDTotal-CHUA201212012.htm
-
[21]
Machida M, Kurogi D, Kijima T. Chem. Mater., 2000, 12: 3165-3170 doi: 10.1021/cm000219c
-
[22]
Carp O. Prog. Solid State Chem., 2004, 32:33-177 doi: 10.1016/j.progsolidstchem.2004.08.001
-
[23]
Lee S M, Hong S C. Appl. Catal. B: Environ., 2015, 163:30-39 doi: 10.1016/j.apcatb.2014.07.043
-
[24]
Liu X, Zhou K, Wang L, et al. J. Am. Chem. Soc., 2009, 131:3140-3141 doi: 10.1021/ja808433d
-
[25]
Du X, Gao X, Qu R, et al. ChemCatChem, 2012, 4:2075-2081 doi: 10.1002/cctc.201200316
-
[26]
Jiang Y, Xing Z, Wang X, et al. Fuel, 2015, 151:124-129 doi: 10.1016/j.fuel.2015.01.061
-
[27]
Yang S, Zhu W, Jiang Z, et al. Appl. Surf. Sci., 2006, 252: 8499-8505 doi: 10.1016/j.apsusc.2005.11.067
-
[28]
Dutta S P P, Seehra M S, Shi Y, et al. Chem. Mater., 2006, 18:5144-5146 doi: 10.1021/cm061580n
-
[29]
Chen J P, Yang R T. Appl. Catal. A: Gen., 1992, 80:135-148 doi: 10.1016/0926-860X(92)85113-P
-
[30]
Busca G, Lietti L, Ramis G, et al. Appl. Catal. B: Gen., 1998, 18:1-36 doi: 10.1016/S0926-3373(98)00040-X
-
[31]
Amoresa J M G, Escribanoa V S, Ramisb G, et al. Appl. Catal. B, 1997, 13:45-58 doi: 10.1016/S0926-3373(96)00092-6
-
[32]
Lee S M, Lee H H, Hong S C. Appl. Catal. A: Gen., 2014, 470:189-198 doi: 10.1016/j.apcata.2013.10.057
-
[33]
Ramis G, Busca G, Lorenzelli V, et al. Appl. Catal., 1990, 64:243-257 doi: 10.1016/S0166-9834(00)81564-X
-
[34]
Chen J P, Yang R T. J. Catal., 1993, 139:277-288 doi: 10.1006/jcat.1993.1023
-
[35]
Si Z, Weng D, Wu X, et al. Catal. Commun., 2010, 11:1045-1048 doi: 10.1016/j.catcom.2010.05.011
-
[1]
-

Figure 1 (A) NO conversion as a function of temperature; (B) NO conversion tested at 360 ℃ as a function of calcination temperature
Reaction conditions: φ(NO)=φ(NH3)=0.1%, φ(O2)=5%, balance N2, GHSV=30 000 h-1

Figure 2 N2 selectivity of the catalysts
Reaction conditions: φ(NO)=φ(NH3)=0.1%, φ(O2)=5%, balance N2, GHSV=30 000 h-1

Figure 6 H2-TPR profiles of CT (A) and Z-CT (B) catalysts calcined at different temperatures

Figure 8 NH3-TPD profiles for the catalysts
B denoted the Brönsted acid sites and T denoted total acid sites
Table 1. Ratio of Ce3+/Ce4+ of the catalysts calcined at different temperatures
Sample Ratio of Ce3+/Ce4+ 550 ℃ 650 ℃ 750 ℃ 850 ℃ CT 62.3% 34.1% 31.1% 24.6% Z-CT 62.4% 42.0% 38.2% 35.6%  下载: 导出CSV
Table 2. Peak areas of Ba and Tb sites and ratios of B/T for the catalysts
Area of B sites Area of T sites B/T CT Z-CT CT Z-CT CT Z-CT 550 255.4 414.79 1 101.9 1 059.9 23.1% 39.2% 650 100.4 284.9 526.5 809.2 19.1% 35.2% 750 86.38 197.5 440.3 455.8 19.6% 43.3% 850 38.1 154.8 166.3 225.2 22.9% 68.7% a B denoted the Brönsted acid sites; b T denoted total acid sites
下载: 导出CSV
-


 扫一扫看文章
计量
- PDF下载量: 0
- 文章访问数: 1232
- HTML全文浏览量: 201
 下载:
下载:
