
Scheme 1.
Illustration of the CQDs extraction from peach leaves waste and their use in biological imaging.
Green process of biomass waste derived fluorescent carbon quantum dots for biological imaging in vitro and in vivo
Haitao Ren , Yue Yuan , Abdelkader Labidi , Qibing Dong , Ke Zhang , Eric Lichtfouse , Ahmed A. Allam , Jamaan S. Ajarem , Chuanyi Wang

Various organic dyes, e.g., porphyrins, boron-dipyrromethene, indocyanines, rhodamines and phthalocyanines [1] and semiconductor quantum dots (SCQDs) such as CdSe, ZnS, ZnSe, CdS, PbS [2] have been used as fluorescent probes in vitro and in vivo biological imaging studies. Although those dyes and SCQDs have specific chemical structures with excellent photoluminescence (PL) properties, they may not be suitable for being utilized in real-time long-term imaging or cell multiplication due to security issues [3]. Their main limitations are the low photo-bleaching thresholds, potential toxicity, poor solubility, high costs and small Stokes shift [4]. In this regard, CQDs emerged as an alternative to fluorescence probes for biological imaging applications owing to their unique PL, low-toxicity, biocompatibility and environmentally-friendly properties [5]. However, as shown in Table S1 (Supporting information), previously the biological imaging of most reported CQDs was mainly used in vitro cell cultures. Compared with intracellular imaging, observing in vivo fluorescence imaging of CQDs is more significant.
CQDs as a new type of carbon nanomaterial have been intensively used in bio-imaging, sensing, anti-counterfeiting, optoelectronic devices, phototherapy, drug release and photo-catalysis [6,7]. The production of CQDs is done by top-down and bottom-up methods [8]. Top-down methods break down macroscopic carbon precursors such as graphite, carbon nanotubes, carbon black, candle soot, and activated carbon, into small-sized CQDs by chemical treatment or physical cutting [9]. Bottom-up methods produce CQDs from small organic compounds through thermal decomposition, template-based routes, solvothermal/hydrothermal treatment, and ultrasonic/microwave irradiation [10]. Unfortunately, most of these strategies use expensive or toxic precursors, sophisticated equipment, harsh reaction conditions, complicated purification processes, useless by-products, and strong acids or alkali, resulting in manufacturing difficulties and the increase of the production cost. Therefore, there is a need for safer, efficient and cost-effective methods to produce CQDs, such as biomass conversion.
Waste biomass is regarded to be low-value or useless and is often discarded, resulting in environmental pollution. About 4.3 billion tons of waste biomass are produced annually in China due to inefficient disposal [11,12]. Waste biomass should therefore be converted into value-added material such as carbon nanomaterials, thus reducing CO2 emissions and environmental issues [13,14]. Biomasses, such as food waste, vegetables, fruits and plant residues, have been recently used as a carbon source for the production of carbon nanomaterials [15,16]. Peach leaves are a common biomass waste left in the field after harvesting. For instance, China is one of the major agroforestry nations in the world, with an annual production of 2 million tons of peach leaves waste. Thus, the recycling of such waste is a major problem for local farmers. The peach leaf is a renewable and sustainable carbon-rich raw material that is mainly composed of soluble carbohydrates, crude protein, crude fiber and crude fat [12,17]. If this resource can be recycled and effectively used, it may alleviate environmental pollution and create more value-added products. However, few reports have studied the use of peach leaves waste as a precursor for the production of CQDs. Peach leaves waste has great potential for the large-scale and low-cost production of CQDs because they can not only supply abundant carbon sources but also minimize the use of toxic and expensive chemicals.
In this work, we developed a green, facile and low-cost strategy to extract the value-added CQDs from peach leaves waste for the first time, via a simple one-step hydrothermal process (Scheme 1). With this process, the CQDs with graphite-like structure, fine size of 1.9 nm, abundant surface functional groups, good hydrophilicity, high fluorescence stability and fluorescence quantum yield (QY) of 7.71% without any passivation are extracted. To our interest, the CQDs are applicable in cell imaging (in vitro) and zebrafish imaging (in vivo), demonstrating their ultra-low toxicity in high of the obtained CQDs and remarkable biological imaging performance.
Compared with previously reported methods, as shown in Table S1, our extraction strategy is greener, safer, simpler and more inexpensive, endowing their easier application to the large-scale extraction of fluorescent CQDs, due to the process of using peach leaves waste as a carbon source, only using water as a solvent, without adding any chemical reagents, and avoiding complicated purification processes (e.g., high-speed centrifugal, long-term dialysis). Furthermore, compared with other reported CQDs, the obtained CQDs are comparable to them in property and biological imaging. Even at a higher CQDs concentration (500 µg/mL), the organism can still maintain more than 90% activity both in vitro and in vivo, and present bright fluorescence.
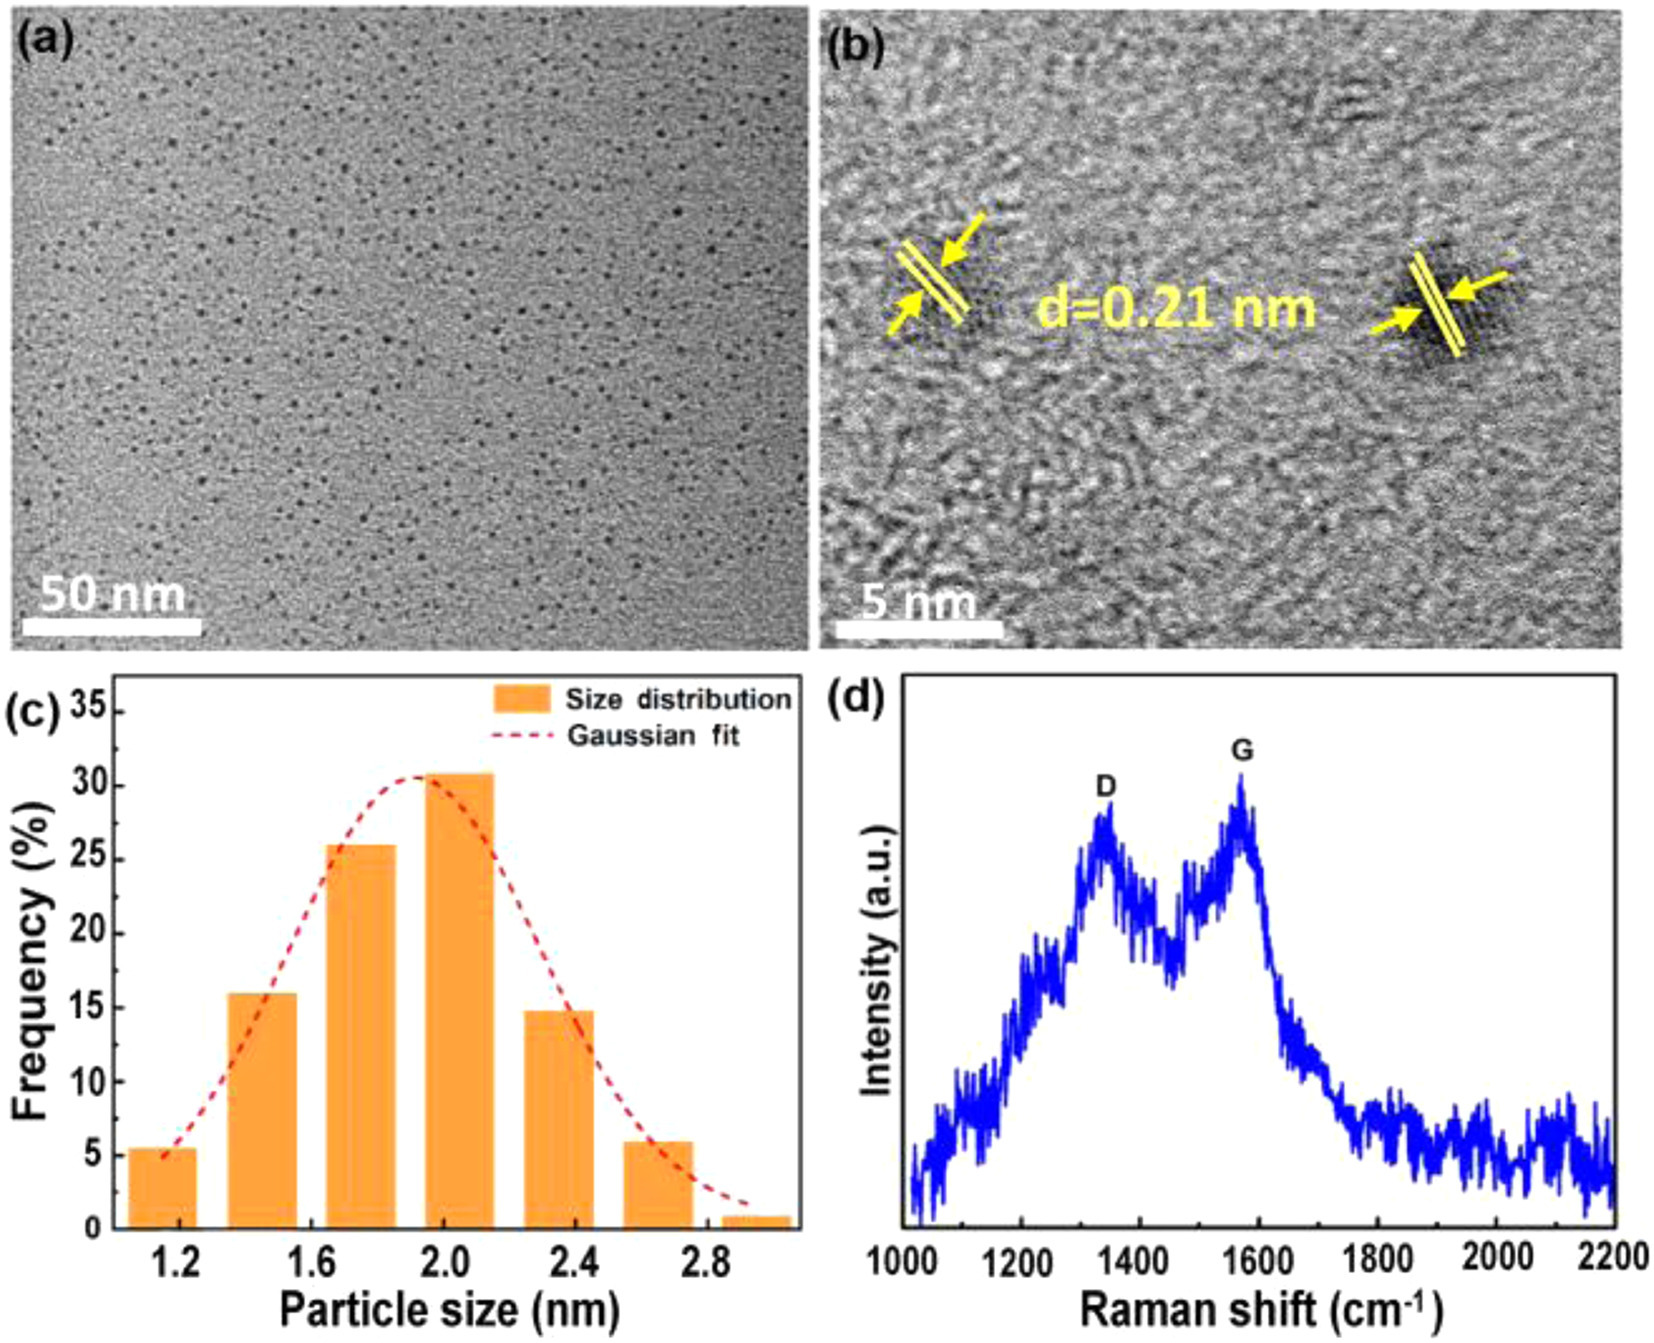
The microstructure of CQDs extracted from peach leaves waste was characterized by transmission electron microscopy (TEM) and Raman. The TEM image presented in Fig. 1a displays that CQDs are fully dispersed in a quasi-spherical shape without any agglomeration. The high-resolution TEM (HRTEM) image in Fig. 1b shows that the CQDs are highly crystallized with a lattice distance of 0.21 nm which corresponds to the (100) planes of graphite [18]. The corresponding size distribution histogram (Fig. 1c) was obtained by measuring 400 nanoparticles, indicating that the CQDs have a narrow size distribution in the range of 1.1–3.0 nm with an average size of 1.9 nm. Raman spectrum of CQDs exposed in Fig. 1d displays two distinct peaks at 1356 cm-1 and 1582 cm-1. These peaks correspond to the disordered (D) graphitic band and graphitic (G) band of sp2 carbon, respectively [19,20]. The ratio of D and G band intensities (ID/IG) is equal to 0.86, indicating the relatively low degree of graphitization due to the defects in the sp2 carbon sites of CQDs arising from the functional groups on the surface [21]. Overall, these results prove that the graphite-like structure of these CQDs can be synthesized from peach leaves waste by applying the hydrothermal process.
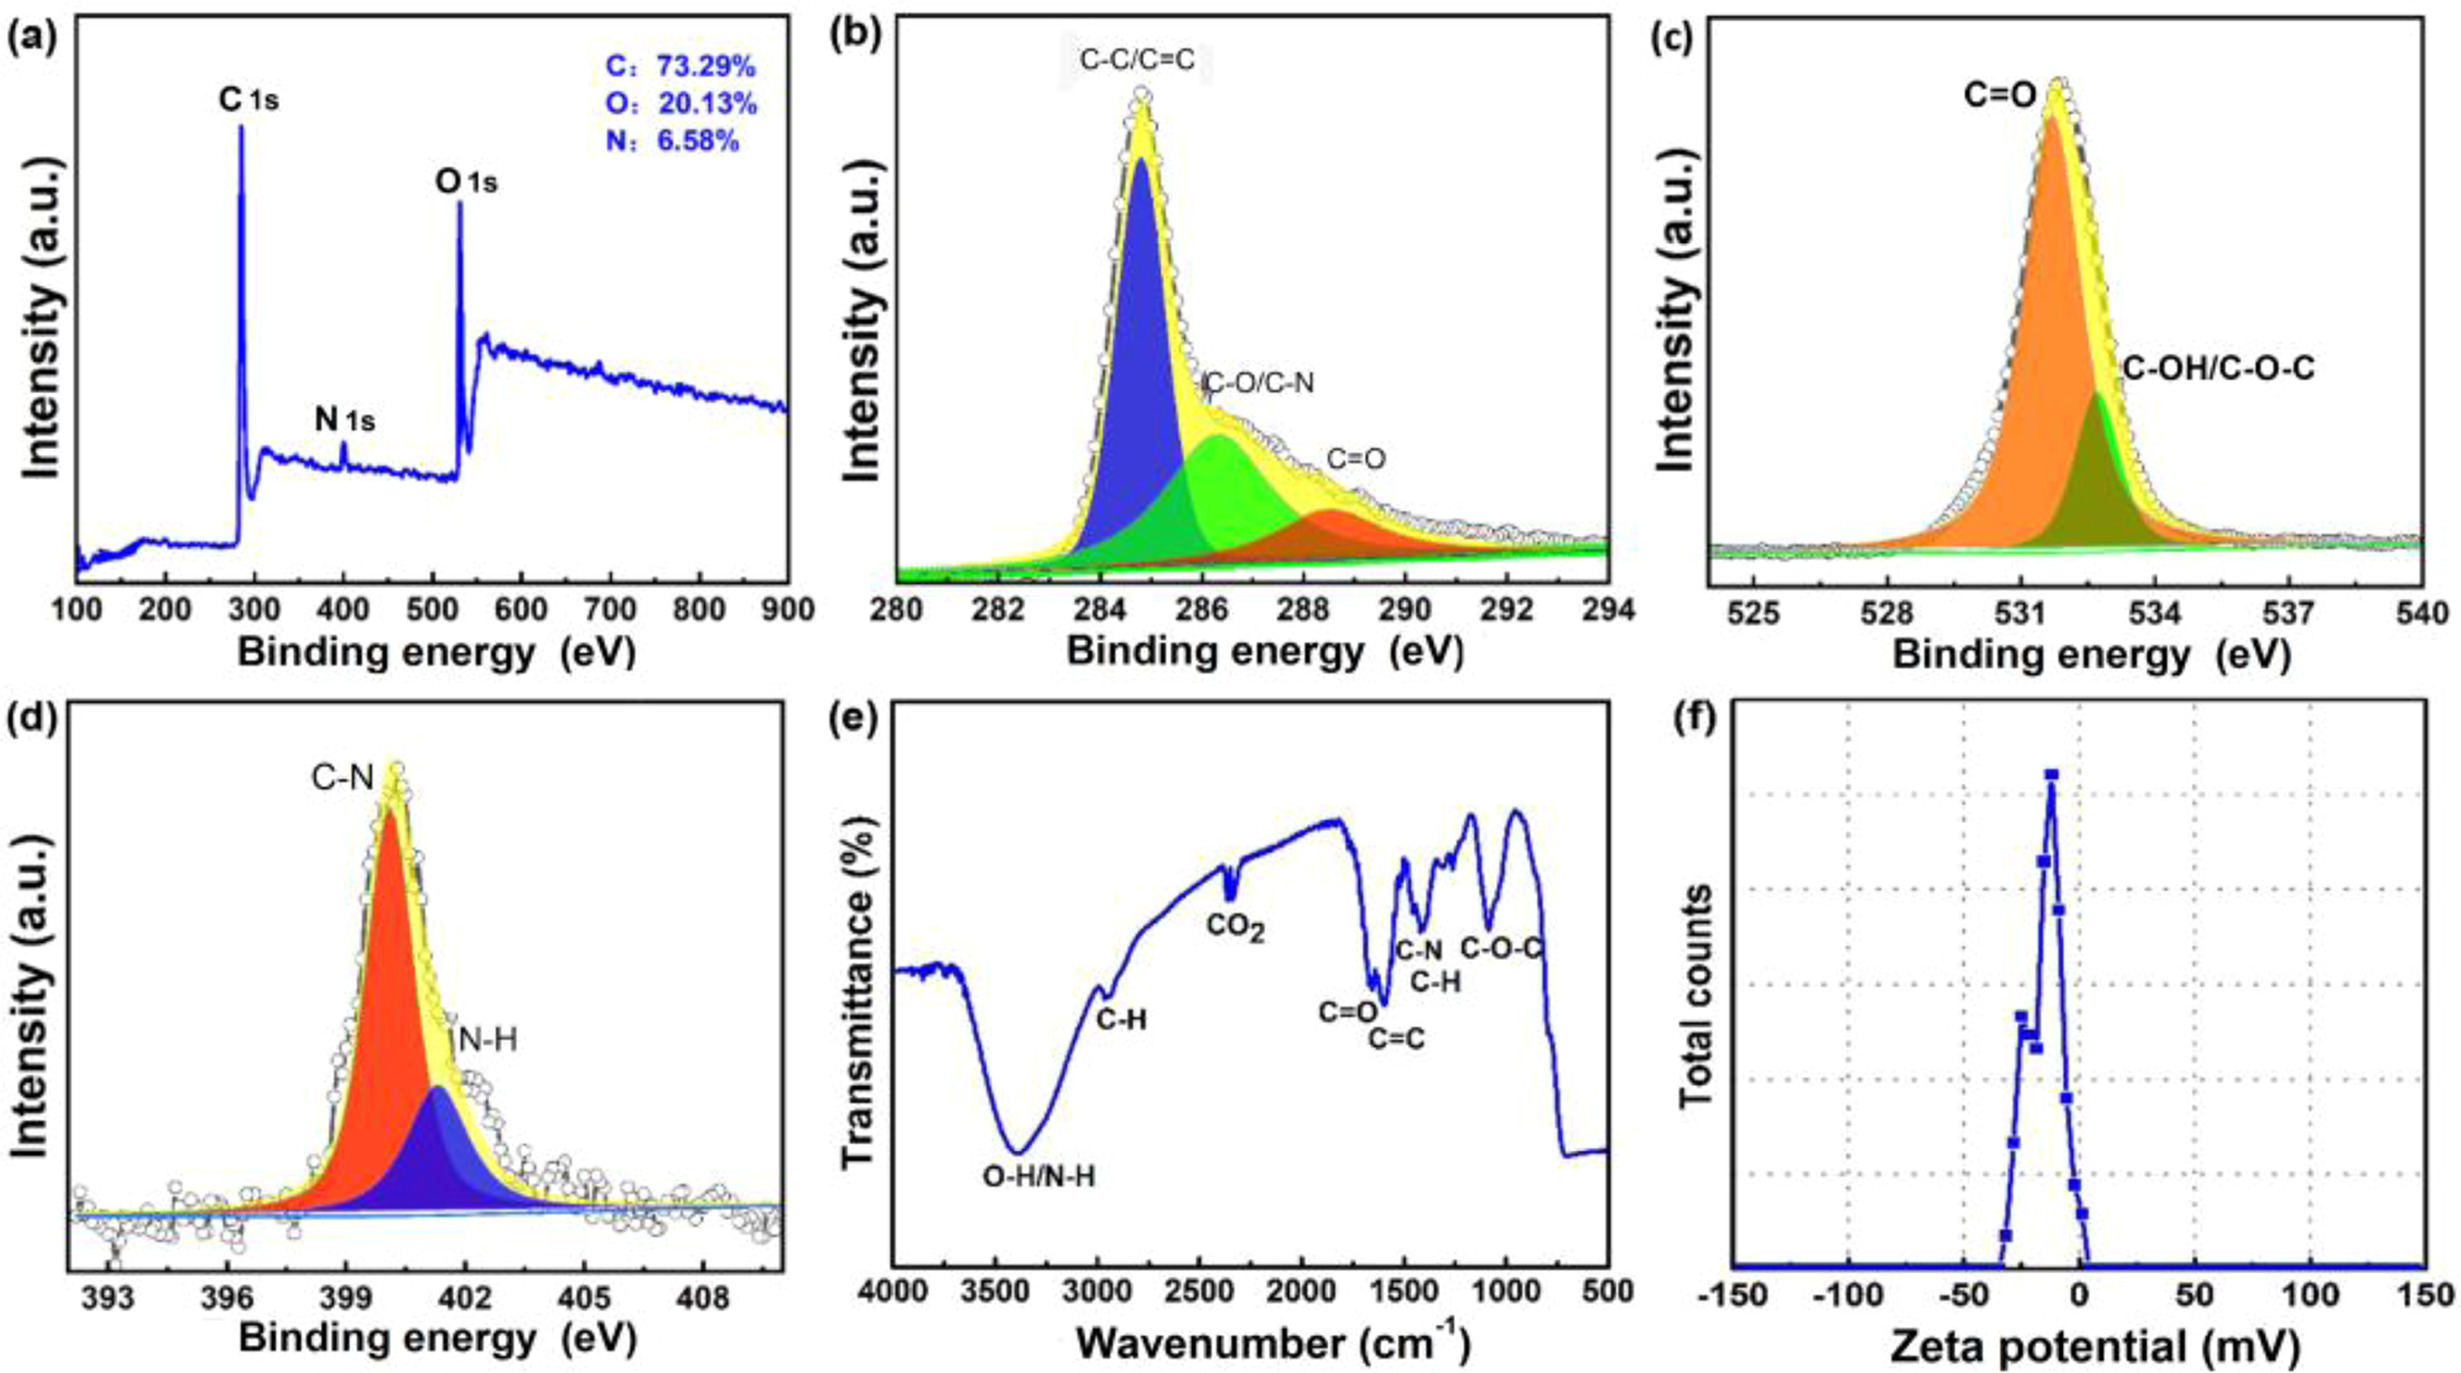
The surface functional groups, chemical compositions and elemental states of CQDs were examined by X-ray photoelectron spectroscopy (XPS), Fourier transform infrared (FTIR) and zeta potential. The XPS spectrum (Fig. 2a) of CQDs displays the existence of C, O and N in the CQDs, with corresponding contents of 73.29%, 20.13%, and 6.58%, respectively. The high-resolution XPS spectrum of C 1s in Fig. 2b shows three peaks at 284.8, 286.3 and 288.2 eV, which are attributed to C–C/C=C, C–N/C–O and C=O, respectively [21,22]. The high-resolution XPS spectrum of O 1s in Fig. 2c contains two peaks at 531.5 and 532.6 eV, which can be assigned to C=O and C–O–C/C–OH/, respectively [22,23]. The high-resolution XPS spectrum of N 1s shown in Fig. 2d displays two peaks at 399.8 and 401.1 eV, which are ascribed to N–C and N–H, respectively [22,23]. This result was confirmed by the FTIR spectrum of CQDs presented in Fig. 2e. The latter shows the characteristic absorption peaks of O–H/N–H at 3221 cm-1, C–H at 2864 cm-1, C=O at 1665 cm-1, C=C at 1462 cm-1, C–N at 1398 cm-1, and C–O–C at 1089 cm-1 [24]. The zeta potential of CQDs suspended in water is −17.3 mV at pH 6.0 (Fig. 2f), indicating that the CQDs are negatively charged due to the existence of O- and N-related functional groups on its surface. These results demonstrate the existence of N and O-containing functional groups on the surface of CQDs which improves their hydrophilicity and stability in aqueous systems within the practical application in biological imaging.
The optical properties of CQDs were explored by UV–vis absorption and photoluminescence spectroscopy. The UV–vis absorption spectrum of CQDs in aqueous solutions is shown in Fig. 3a. The CQDs have strong absorption in the UV region, which is consistent with the range of the excitation wavelength of CQDs. It exhibits an intensive peak, at 255 nm, and a shoulder peak at 325 nm. These two peaks are attributed to the π–π* transition of C=C bands and n–π* transition of C=O and C–N bands, respectively [25]. The maximum emission intensity is observed at around 440 nm under the excitation wavelength of 360 nm (Fig. 3a). The CQDs are completely scattered in the water and present bright blue fluorescence under 365 nm UV irradiation (Fig. 3a, inset). These water-soluble fluorescent CQDs help the application of biological imaging.
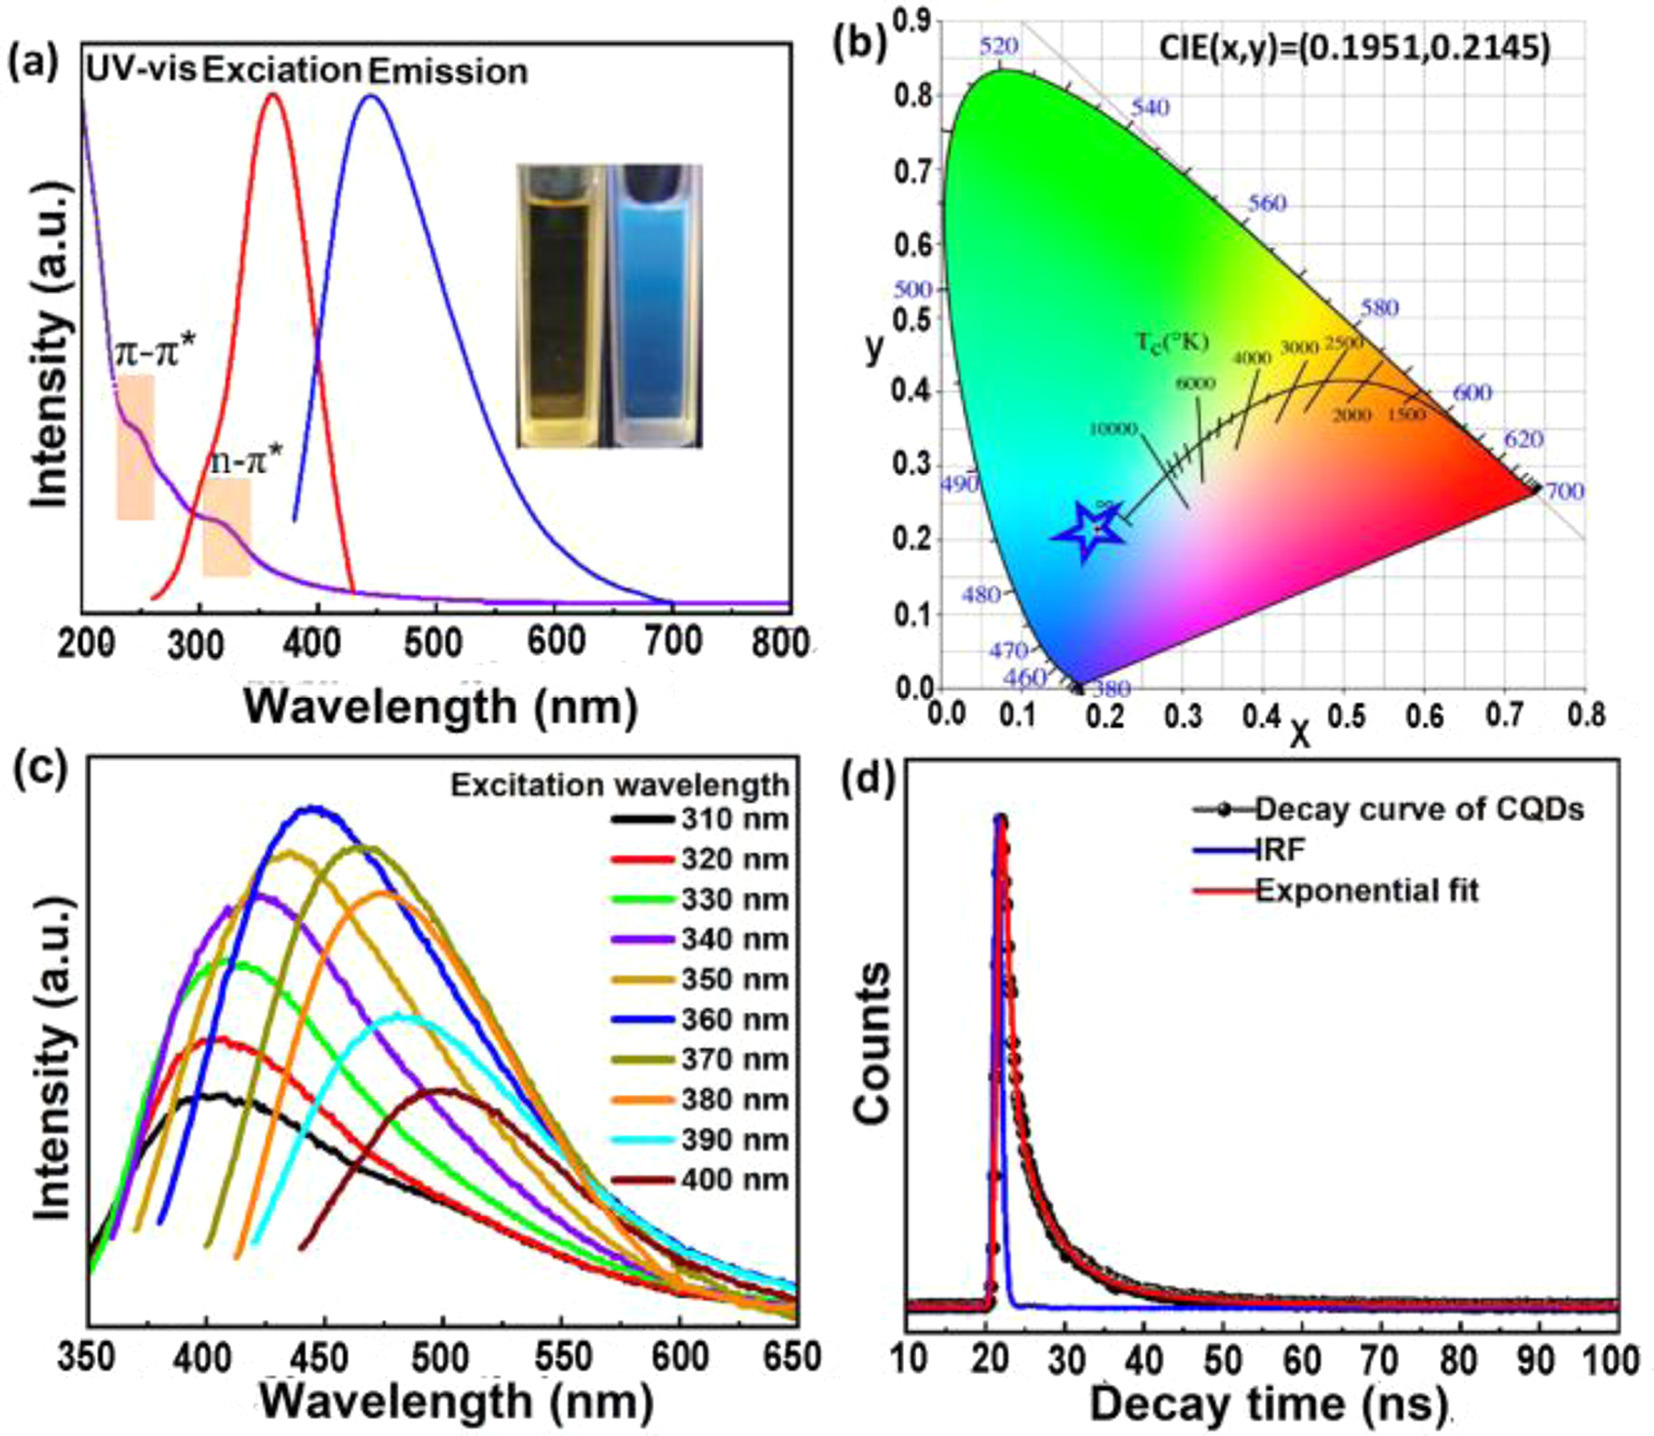
The blue fluorescence of CQDs was further confirmed by the Commission Internationale d'Eclairage (CIE) coordinates at (0.1951, 0.2145) obtained from the emission data at 360 nm excitation (Fig. 3b). The CQDs exhibit excitation-dependent PL properties (Fig. 3c). When the excitation wavelength is tuned from 310 nm to 360 nm, the PL intensity of CQDs increases gradually. The optimal PL peak is centered at 440 nm for 360 nm excitation. This peak decreases with the increase of the excitation wavelength from 360 nm to 400 nm. The normalized PL spectra of CQDs (Fig. S1 in Supporting information) clearly exhibit redshift by increasing the excitation wavelength (310–400 nm). These findings reveal that the PL of CQDs is the excitation-wavelength dependence of the emission wavelength on intensity. The CQDs characteristic excitation-dependent PL property helps to achieve biological imaging in different color channels.
The fluorescence QY of the CQDs, about 7.71%, was measured using quinine sulfate as a reference (Fig. S2 in Supporting information). This value is relatively higher, compared with that of other biomass-derived CQDs [26-29]. Owing to its excitation-dependent property, the lifetime decay curve was also computed by applying the fitting formula (Eq. 1) [30] written below to acquire the three-exponential fitting curve of CQDs (Fig. 3d).
|
|
(1) |
where τ is time; B1, B2, B3 and B4 are the fractional intensities; τ1, τ2, τ3 and τ4 are PL lifetimes, the parameters gained from iterative re-convolution of the decay with the instrument response function (IRF).
The observed lifetimes of CQDs were τ1 = 0.72 ns (23.39%), τ2 = 4.14 ns (49.95%) and τ3 = 13.48 ns (26.66%). Previous reports pointed out that the short-lived component τ1, as well as the long-lived components τ2 and τ3, were associated with the core states and surface states of CQDs, respectively [31]. According to previous reports [32], the long lifetime of CQDs in our study demonstrates that the PL results mainly from the surface functional groups. The average lifetime was equal to 5.96 ns, revealing that CQDs can be appropriately used in optronic and biological applications. Furthermore, except that the excitation-dependent down-converted PL characteristic, the CQDs also exhibit an up-converted PL property. Fig. S3 (Supporting information) shows the up-converted PL spectra of CQDs excited by long wavelengths ranging from 600 nm to 900 nm with the emission located in the range from 350 nm to 600 nm. The up-converted emission of CQDs may be attributed to the multi-photon active process, in which the synchronous absorption of two or more photons leads to a shorter emission wavelength [33]. The results indicate that the CQDs may supply potential applications in energy conversion, bioscience, and optoelectronic device.
To investigate the effect of concentration on PL intensity, the PL spectra of CQDs at different concentrations were measured. As shown in Fig. S4 (Supporting information), the CQDs displayed concentration-dependent PL property with the maximum PL intensity at 1.2 mg/mL. Moreover, the PL stability of the as-extracted CQDs under various pH systems, different ionic strengths and several UV irradiation durations were evaluated. As shown in Figs. S5a–d (Supporting information), the pH values affected considerably the PL intensity. The pH value was adjusted by adding NaOH or HCl. The CQDs exhibit stable PL intensity at pH 4.0–11.0. Then, the PL intensity reduces at lower pH (pH < 4.0) and higher pH (pH > 11.0), which may be due to aggregation of CQDs originated from enhanced non-covalent bond interactions under extreme pH conditions, such as hydrogen bonding between hydroxyl, carboxyl and amino [24,34]. Thus, the excellent properties of pH 4.0–11.0 environment make CQDs ideal candidates in bio-applications as most biological activities happen in this pH range. In addition, CQDs solution had a good photostability since their PL intensities did not significantly change under continuous excitation at 365 nm with a UV lamp for 3.0 h, as indicated in Figs. S5b–e (Supporting information). Moreover, PL intensity was not modified in the concentration of NaCl up to 1.0 mol/L (Figs. S5c–f in Supporting information), which demonstrates that the ionic strength did not affect the PL intensity of CQDs. All these observations reveal that as-extracted CQDs had stable PL over a wide pH range and hard environmental conditions, which makes CQDs of great potential to be used in fluorescence imaging.
Through the detailed analysis above, we found that the peach leaves waste-derived CQDs exhibit fine particle size, good hydrophilicity, and stable fluorescent performance. These findings suggest that the CQDs may be promising for fluorescence imaging, which we will evaluate the biological imaging potential of CQDs in vitro and in vivo. For bio-application of peach leaves waste-derived CQDs, the MTT approach was used to analyze the vitro cytotoxicity of CQDs using A549 (human lung adenocarcinoma) cells (Fig. 4a). A549 cells were selected as a model, since lung cancer is the second-most prevalent type of cancer in the world [35]. Results show that, after 24 h of culturing different concentrations of CQDs and A549 cells, the cell viability does not decrease significantly with the increasing concentrations of CQDs. Even if diluted to 500 µg/mL, the cell survival rate remains above 90%. This finding proves that the CQDs possess ultra-low cytotoxicity and can be used in bio-applications including bio-imaging.
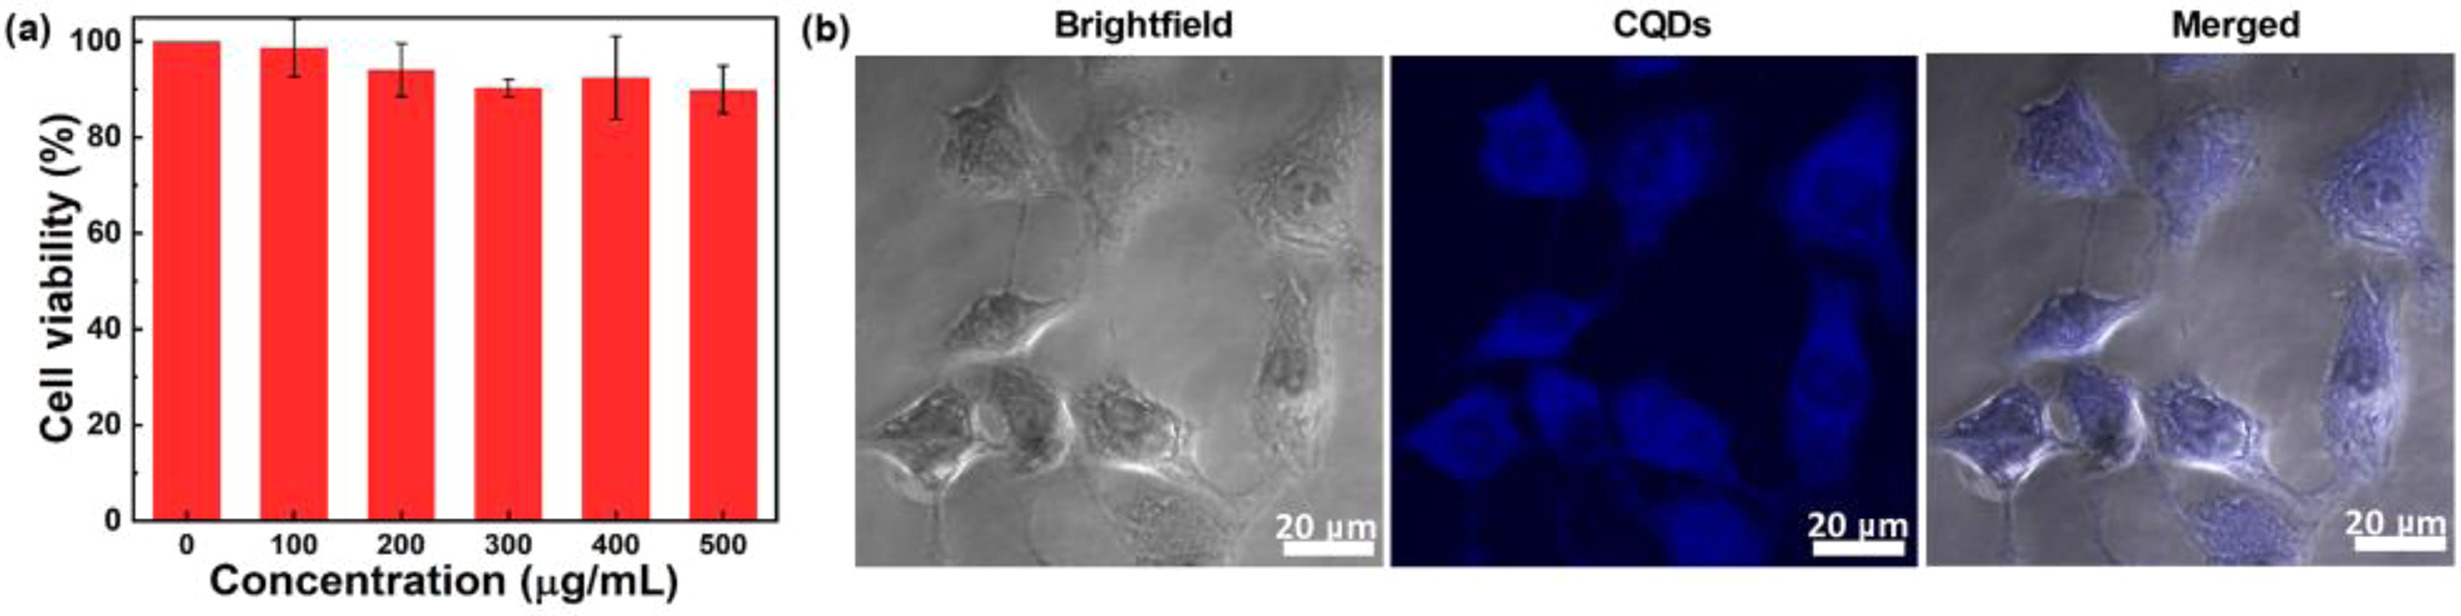
A549 cells were incubated with 400 µg/mL of CQDs for 24 h then they were imaged by a confocal microscope (Fig. 4b). Results show that the confocal image exhibits bright blue fluorescence in the A549 cells. Obviously, the fluorescence is primarily situated in the cytoplasmic region, which means that the CQDs can enter the cell through the cell membrane. In addition, the shape of the A549 cells treated with high concentration CQDs does not change considerably, endorsing the bio-compatibility of CQDs. These results indicate that hydrophilic CQDs derived from peach leaves waste can be used as excellent cell imaging reagents. Compared with intracellular imaging, observing in vivo fluorescence imaging of CQDs is more significant [36], which we will investigate the potential of CQDs in vivo imaging.
The gene sequence of zebrafish is highly homologous to human and it is widely used in drug delivery and bio-compatibility research [37]. Thus, zebrafish was utilized as a model system to further evaluate the potential of CQDs in vivo imaging. The CQDs can quickly enter the pores of the chorion after simple immersion, because the size of CQDs (1.9 nm) is smaller than that of the nanoscale pores of the zebrafish chorion (0.17 µm2). In the experiment, we observed that when the incubation concentration of CQDs reached 500 µg/mL, zebrafish larvae began to appear abnormal growth of spinal cord flexure. As revealed in Fig. S6 (Supporting information), when zebrafish larvae were exposed to CQDs even up to 500 µg/mL for 3.0 days at 28 ℃, the viability of zebrafish larvae increased up to 90%, which indicates the excellent bio-compatibility and ultra-low toxicity of the extracted CQDs.
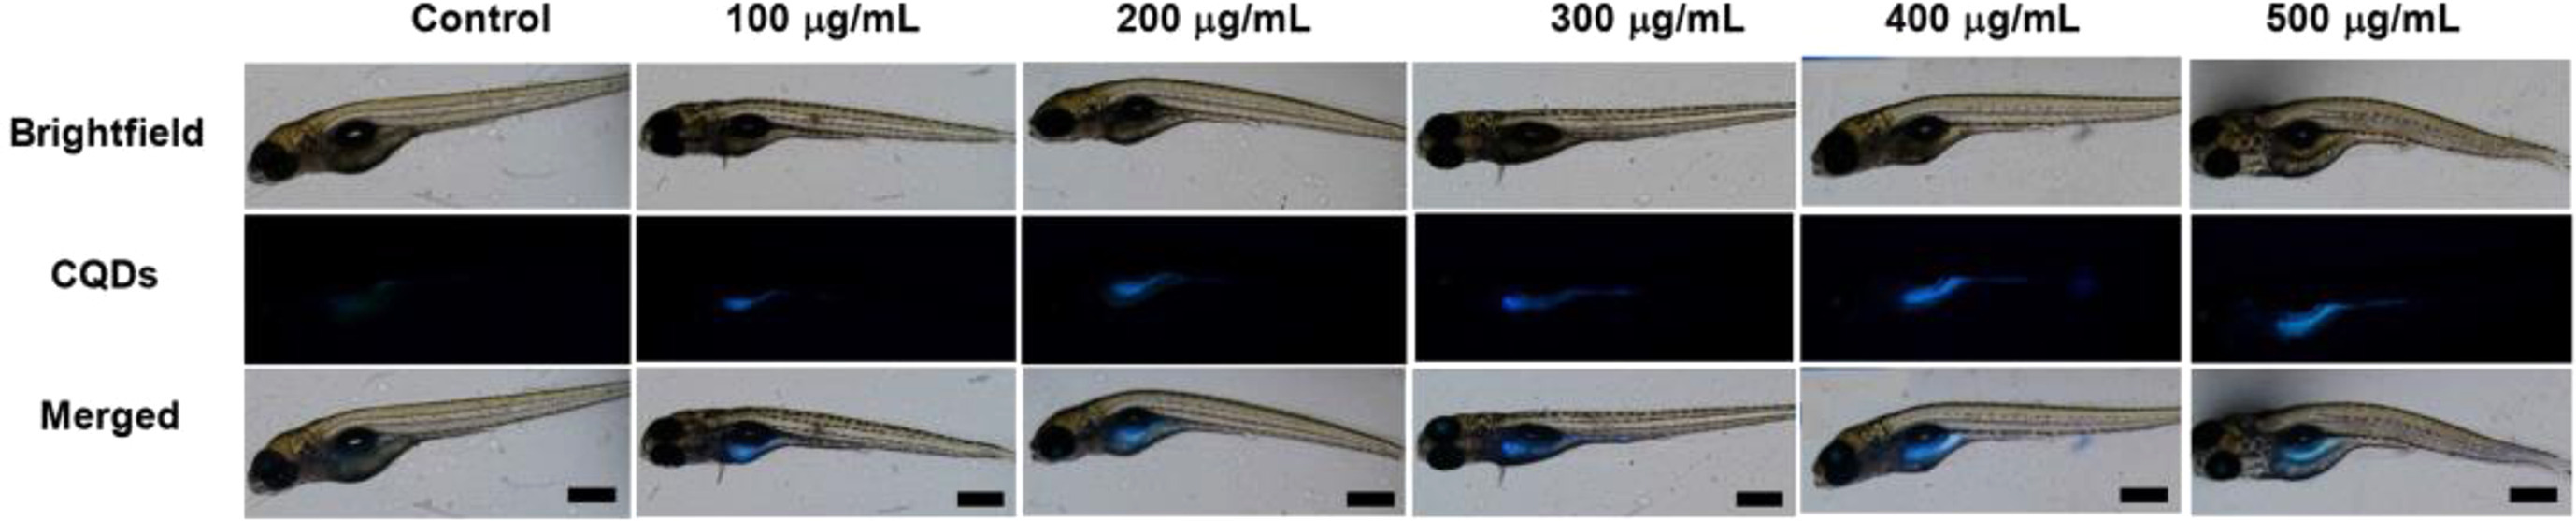
Fig. 5 shows that zebrafish larvae treated with different concentrations of CQDs exhibit blue fluorescence signal, the fluorescent intensity in the zebrafish larva rise with the increase of CQDs' concentration. In particular, the yolk sac shows the strongest blue fluorescence signal, compared to other tissues, which predominantly accumulated in the intestine and allow the CQDs to enter the digestive system to be metabolizable. In addition, CQDs could accumulate selectively in the eyes, which proves that the CQDs, having wonderful histocompatibility, can enter the eyes through the blood-ocular barrier. These results demonstrate that the CQDs are considered a potential fluorescent probe in biological imaging and other correlative biomedical applications. The biological imaging results demonstrated that the extracted CQDs had ultra-low toxicity and remarkable biocompatibility, which can be attributed to our extraction process is very green, no any chemical reagents are added, and natural biomass waste is used as the precursor.
Finally, Table S2 (Supporting information) compares the properties of biomass waste derived CQDs to SCQDs and organic dyes [2,4]. It reveals that biomass waste-derived CQDs can be efficiently employed in bio-compatibility, toxicity, synthesis, fluorescence, environmental aspects, hydrophilicity, and cost. Besides, CQDs have been considered as a potential solution to the challenges that SCQDs and organic dyes have encountered because they are more biocompatible, ultra-low toxicity, and could be extracted from abundant and nontoxic biomass raw materials. Overall, these results confirm that biomass waste-derived CQDs could be considered as a potential replacement for organic dyes and SCQDs in vitro and in vivo biological imaging.
In summary, value-added fluorescent CQDs were successfully extracted from peach leaves waste, sustainable and low-cost natural waste biomass, by adopting a low-cost, green, and simple one-step hydrothermal process using only water as a solvent and without adding any chemical reagents. The obtained CQDs with excellent PL property, fine size, high hydrophilicity, low cost, ultra-low cytotoxicity, and good biocompatibility. They can be considered as a potential candidate for biological imaging reagents, as verified by the in vitro (cell culture) and in vivo (zebrafish) model systems. This work not only provides a meaningful solution to the end-up environmental issues of biomass waste by converting it into value-added CQDs, but also can supply insights for developing safer and cheaper CQD-based biological imaging agents in vitro and in vivo.
Compared with blue light emissive CQDs, long-wavelength emissive, especially near-infrared CQDs, are more beneficial in biological imaging because of their deeper tissue penetration power. The effect of surface functionalization on the optical properties of biomass waste derived CQDs will be the focus of our future study to achieve near-infrared light emission with higher QY.
The authors declare that they have no known competing fifinancial interests or personal relationships that could have appeared to influence the work reported in this paper.
This work was supported by the National Natural Science Foundation of China (Nos. 21976116 and 52161145409), the Shaanxi Science and Technology Program (No. 2020KWZ-005), SAFEA of China ("Belt and Road" Innovative Exchange Foreign Expert Project, No. DL2021041001L). The authors acknowledge Researchers Supporting Project number (No. RSP-2021/149), King Saud University, Riyadh, Saudi Arabia.
Supplementary material associated with this article can be found, in the online version, at doi:
L. Đorđević, F. Arcudi, M. Cacioppo, et al., Nat. Nanotech. 17 (2022) 112–130. doi: 10.1038/s41565-021-01051-7
T.C. Wareing, P. Gentile, A.N. Phan, et al., ACS Nano 15 (2021) 15471–15501. doi: 10.1021/acsnano.1c03886
K. Qian, H. Guo, G. Chen, C. Ma, B. Xing, Sci. Rep. 8 (2018) 7991. doi: 10.1038/s41598-018-26167-0
A.M. Wagner, J.M. Knipe, G. Orive, et al., Acta Biomater. 94 (2019) 44–63. doi: 10.1016/j.actbio.2019.05.022
L.J. Desmond, A.N. Phan, P. Gentile, et al., Environ. Sci. Nano 8 (2021) 848–862. doi: 10.1039/D1EN00017A
B. Wang, S. Lu, Matter 5 (2022) 110–149. doi: 10.1016/j.matt.2021.10.016
X. Li, Y. Chen, Y. Tao, et al., Chem. Catal. 2 (2022) 1315–1345. doi: 10.1016/j.checat.2022.04.007
S. Li, L. Li, H. Tu, et al., Mater. Today 51 (2021) 188–207. doi: 10.1016/j.mattod.2021.07.028
R. Wang, K.Q. Lu, Z.R. Tang, et al., Mater. Chem. A 5 (2017) 3717–3734. doi: 10.1039/C6TA08660H
W. Chen, J. Shen, Z. Wang, et al., Chem. Sci. 12 (2021) 11722–11729. doi: 10.1039/D1SC02837E
J. Bettles, D.S. Battisti, S.C. Cook-Patton, et al., For. Policy Econ. 130 (2021) 102538. doi: 10.1016/j.forpol.2021.102538
P. Vasiliki, H.S. Aravani, Z. Yang, G. Liu, W. Wang, Renew. Sustain. Energy Rev. 154 (2022) 111821–111836. doi: 10.1016/j.rser.2021.111821
J. Gupta, M. Kumari, A. Mishra, et al., Chemosphere 287 (2022) 132321. doi: 10.1016/j.chemosphere.2021.132321
X. He, N. Zheng, R. Hu, Z. Hu, J.C. Yu, Adv. Funct. Mater. 31 (2021) 2006505. doi: 10.1002/adfm.202006505
S. Perumal, R. Atchudan, T.N.J.I. Edison, Y.R. Lee, J. Environ. Chem. Eng. 9 (2021) 105802–105816. doi: 10.1016/j.jece.2021.105802
S.A. Shaik, S. Sengupta, R.S. Varma, et al., ACS Sustain. Chem. Eng. 9 (2021) 3–49. doi: 10.1021/acssuschemeng.0c04727
F.O. Jimoh, A.A. Adedapo, A.J. Afolayan, et al., Food Chem. Toxicol. 48 (2010) 964–971. doi: 10.1016/j.fct.2010.01.007
S. Zhao, X. Song, X. Chai, et al., J. Clean. Prod. 263 (2020) 121561. doi: 10.1016/j.jclepro.2020.121561
L. Yang, Q. Zhang, Y. Han, et al., Nanoscale 13 (2021) 13057–13064. doi: 10.1039/D1NR02432A
R. Atchudan, T.N.J.I. Edison, D. Chakradhar, et al., Sens. Actuators B 246 (2017) 497–509. doi: 10.1016/j.snb.2017.02.119
R. Atchudan, T.N.J.I. Edison, S. Perumal, et al., J. Photoch. Photob. A: Chem. 327 (2019) 99–107.
J. Yue, Q. Mei, P. Wang, et al., ACS Appl. Mater. Interfaces 14 (2022) 17119–17127. doi: 10.1021/acsami.2c01857
Q. Zhang, R. Wang, B. Feng, X. Zhong, K. Ostrikov, Nat. Commun. 12 (2021) 6856–6868. doi: 10.1038/s41467-021-27071-4
L. Lin, Y. Yin, Z. Li, et al., Chem. Eng. Res. Des. 178 (2022) 395–404. doi: 10.1016/j.cherd.2021.12.037
J. Tang, J. Zhang, W. Zhang, et al., J. Mater. Sci. Technol. 83 (2021) 58–65. doi: 10.1016/j.jmst.2020.11.072
S. Liu, J. Tian, L. Wang, et al., Adv. Mater. 24 (2012) 2037–2041. doi: 10.1002/adma.201200164
D. Rodríguez-Padrón, M. Algarra, L.A.C. Tarelho, et al., ACS Sustain. Chem. Eng. 6 (2018) 7200–7205. doi: 10.1021/acssuschemeng.7b03848
S.L. D'souza, S.S. Chettiar, J.R. Koduru, et al., Optik 158 (2018) 893–900 (Stuttg). doi: 10.1016/j.ijleo.2017.12.200
S. Jing, Y. Zhao, R.C. Sun, et al., ACS Sustain. Chem. Eng. 7 (2019) 7833–7843. doi: 10.1021/acssuschemeng.9b00027
L. Yang, B. Fu, X. Li, et al., J. Mater. Chem. C 9 (2021) 1983–1991. doi: 10.1039/D0TC05103A
Z. Liu, H. Zou, N. Wang, et al., Sci. China Chem. 61 (2018) 490–496. doi: 10.1007/s11426-017-9172-0
H.A. Nguyen, I. Srivastava, D. Pan, et al., ACS Nano 14 (2020) 6127–6137. doi: 10.1021/acsnano.0c01924
Q. Liang, W. Ma, Y. Shi, et al., Carbon 60 (2013) 421–428. doi: 10.1016/j.carbon.2013.04.055
Q. Wang, H. Zhang, D. Yu, W. Qin, X. Wu, Carbon 198 (2022) 162–170. doi: 10.1016/j.carbon.2022.07.036
A. Sachdev, P. Gopinath, Analyst 140 (2015) 4260–4269. doi: 10.1039/C5AN00454C
H. Li, X. Yan, D. Kong, et al., Nanoscale Horiz. 5 (2020) 218–234. doi: 10.1039/C9NH00476A
C. Duan, M. Won, P. Verwilst, et al., Anal. Chem. 91 (2019) 4172–4178. doi: 10.1021/acs.analchem.9b00224

Scheme 1 Illustration of the CQDs extraction from peach leaves waste and their use in biological imaging.

Figure 1 (a) TEM and (b) HRTEM micrograph images, (c) size distribution histogram and (d) Raman spectrum of CQDs.

Figure 2 (a) XPS survey spectrum, (b) C 1s spectrum, (c) O 1s spectrum, (d) N 1s spectrum, (e) FTIR spectrum and (f) zeta potential curve of CQDs.

Figure 3 (a) UV–vis absorption, PL excitation and emission spectra of CQDs in aqueous solutions (λex = 360 nm and λem = 440 nm); (inset) appearance of CQDs under daylight and 365 nm UV light illumination. (b) CIE coordinates of CQDs. (c) Excitation-emission PL spectra of CQDs. (d) Time-resolved decay and fitting curves of CQDs.

Figure 4 (a) Cell viability of A549 cells after 24 h incubation with various concentrations of CQDs. (b) Confocal fluorescence images of A549 cells after culture with 400 µg/mL CQDs.

 扫一扫看文章

扫一扫关注我们
 DownLoad:
 下载:
下载:
