
Scheme 1.
Synthetic route of M@MLC from LDPE and its application for CAP degradation.
Graphene from microwave-initiated upcycling of waste polyethylene for electrocatalytic reduction of chloramphenicol
Qiang Cao , Xue-Feng Cheng , Jia Wang , Chang Zhou , Liu-Jun Yang , Guan Wang , Dong-Yun Chen , Jing-Hui He , Jian-Mei Lu

Approximately 360 million tons of plastics are produced globally each year, and typically less than 20% is recycled, resulting in huge global waste and environmental pollution [1–3]. Waste polyolefins, accounting for over 50% of all plastic wastes, are considered as a valuable and largely untapped resource [4–6]. Researcher have reported various methods to convert those polyolefins mainly composed of carbon and hydrogen elements into gaseous fuels and high value carbon materials [7]. Wang [8] and Williams [9–11] studied the effects of temperature, steam and catalyst on selectivity of H2 and quality of carbon nanotube (CNT) in a two-step pyrolysis-gasification reactor. Ruan and coworkers reported catalytic microwave-assisted pyrolysis of polyolefins into gasoline-range hydrocarbons [12]. Edwards reported a one-step microwave-initiated process for the catalytic deconstruction of waste plastics into H2 and CNTs [4]. We recently reported for upcycling of waste polyolefins into carbon nanofibers for sodium-ion battery using a ceramic MAX phase Ti3AlC2 as an excellent microwave-susceptor and catalyst (microwave cataceptor) [5]. Microwave initiated cataceptor-catalytic deconstruction of polyolefin waste is an fast, less CO2 releasement and economical method for plastic treatment due to its selectively and rapidly heating [13]. Microwave initiated upcycling polyolefin plastic waste into carbon materials is an efficient and energy saving strategy to turn waste into treasures [4]. Since carbon materials are widely used as cheap and robust electrode in industrial electrocatalysis [14–19], it is attractive to upcycling polyolefin wastes into value-added, highly conductive carbon materials for electrocatalysis by microwave-initiated cataceptor-catalytic could realize the treatment of waste water with waste plastic.
Chloramphenicol (CAP) is a halogenated antibiotic that has been extensively used over the past few decades but is carcinogenic and genotoxic for humans [20–25], and its abuse has led to the pollution in water [17,26–30]. Electrocatalytic dehalogenation (EDH) is an effective technology to reduce the pollutions of halogenated antibiotic by cracking strong carbon-chlorine (C—Cl) bonds using electrons as green reductants [27,31–34]. The cathode materials play an important role in the electrochemical reduction process [31]. Carbon materials supported metal is an ideal cathode for CAP electrocatalytic reduction. Noble metal palladium (Pd) and platinum (Pt) modified electrodes showed good activities for EDH due to the property to retain atomic H* [21,31–34]. However, it is valuable to design cheap and stable cathode materials without noble metal catalysts for the efficient CAP removal.
Herein, plastic waste was microwave-initiated catalytically degraded for electrocatalytic water pollution treatment. MAX-Ti3AlC2 supported Fe catalyst (Fe@MAX) was prepared by facile dropwise adding Fe3+ solution into MAX suspension and employed as microwave cataceptor to upcycle polyolefin plastic waste plastic into value-added graphene for chloramphenicol removal for the first time (Scheme 1). Plastic is deconstructed to hydrogen and few layered graphene with few defects in 5 min. Graphene and MAX supported Fe catalyst (Fe@MLC) could completely (99.2%) degrade chloramphenicol within 90 min and retained robust removal efficiency of 96.5% in 120 min after 10 cycles. Moreover, the electrochemical active surface area (ECSA) of Fe@MLC was 2.7 times higher than that of commercial Pt/C. The good electrical conductivity of graphene upcycled from plastic waste promotes the electron transfer in chloramphenicol electrocatalytic reduction. Our results realize the first application of polyolefin waste for electrocatalytic reduction of chloramphenicol, providing a direction of unexpensive catalyst design from plastic waste for waste-water treatment.
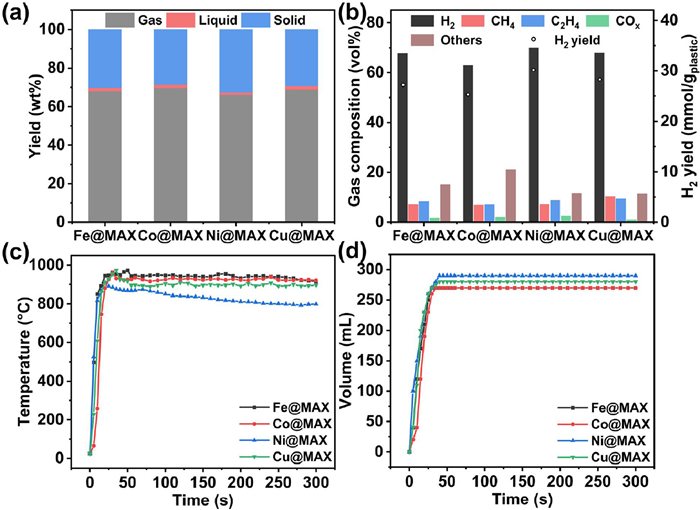
The one-step microwave-initiated M@MAX catalyzed upcycling process rapidly deconstructs LDPE into H2 fuel and graphitic carbon materials (Scheme 1). Under 1000 W, catalyzed by MAX supported Fe catalyst (Fe@MAX), LDPE turned into solid products with yield of 30.2 wt% (Fig. 1a) and gaseous products with H2 selectivity of 67.7 vol% (Fig. 1b). MAX supported Co catalyst (Co@MAX), MAX supported Ni catalyst (Ni@MAX), and MAX supported Cu catalyst (Cu@MAX) showed H2 selectivity of 62.9 vol%, 69.9 vol% and 67.9 vol% (Fig. 1b), respectively. The slightly lower H2 selectivity compared to our reported MAX (Ti3AlC2, 75.0 vol%) was probably because the introduced metals had lower catalytic performance than Ti [5]. However, Fe@MAX, Co@MAX, Ni@MAX and Cu@MAX showed similar solid yields (30.2 wt%, 28.6 wt%, 32.5 wt% and 29.4 wt%, Fig. 1a), which mainly due to the major composition of M@MAX was MAX. Catalyzed by Fe@MAX, Co@MAX, Ni@MAX and Cu@MAX, temperature could reach more than 800 ℃ in 30 s (Fig. 1c), and volume could reach highest in 40 s (Fig. 1d), which illustrates the four M@MAXs showed high microwave adsorption. The liquid composition from LDPE deconstruction catalyzed by M@MAX was characterized by GC–MS (Fig. S1 in Supporting information). The liquid composition could be separated into three groups similar to our previous work [5]. However, liquid products were less than 5 wt%, thus, the analysis on liquid products was not the research focus in the work. The actual loading amount of metal in M@MAX was less than 0.5 wt% (Table S1 in Supporting information). And the molality of metal in M@MLC was less than 60 µmol/g (Table S1).
In Powder X-Ray Diffraction (PXRD) patterns of carbon and MAX supported metal catalyst (M@MLC) (Fig. 2a and Fig. S2 in Supporting information), the diffraction peaks at 21.5° and 23.9° corresponding to (110) and (200) reflection planes of LDPE disappeared after microwave treatment, indicating the fully decomposition of LDPE [4]. Furthermore, a broad peak (002) appeared at approximately 26.0°, reflecting the formation of graphitic carbons [9]. Similar to our previous report [5], Ti3AlC2 was decomposed to TiC ((PDF #65-8804) and titanium-aluminum alloy (TiAl, PDF #65-8565) after microwave treatment (Fig. 2a). In a more precise description, M@MLC is a designed complex with metals loading on carbon and TixAlyCz. In ATR-FTIR spectra (Fig. 2b), the three sets of peaks (2914.3 and 2848.7 cm−1, 1471.6 and 1462.0 cm−1, as well as 731.0 and 717.4 cm−1) assigned to the C—C and C—H absorption of LDPE faded [4,5,35], further confirming the complete conversion of LDPE.
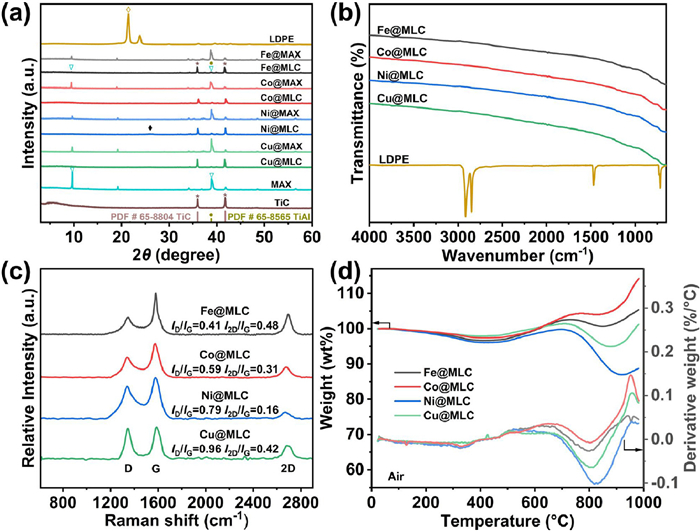
Raman spectroscopy reflects the surface defects and graphitization degree of carbon and MAX supported metal catalyst (M@MLC) (Fig. 2c). All the four catalysts showed three characteristic peaks, the D band at ~1350 cm−1, the G band at ~1580 cm−1 and the 2D band at ~2680 cm−1 [8,9,11,36–38]. The low ID/IG ratios indicates they showed high degree of graphitization and few structural defects. And the I2D/IG values reflect the purity of carbon materials. Fe@MLC showed a high I2D/IG of 0.48, suggesting the high purity of graphitic carbon phase. The compositions of decomposed carbon materials were discussed in detail through temperature programmed oxidation analysis (TPO, Fig. 2d) and morphology characterizations (Fig. 3).
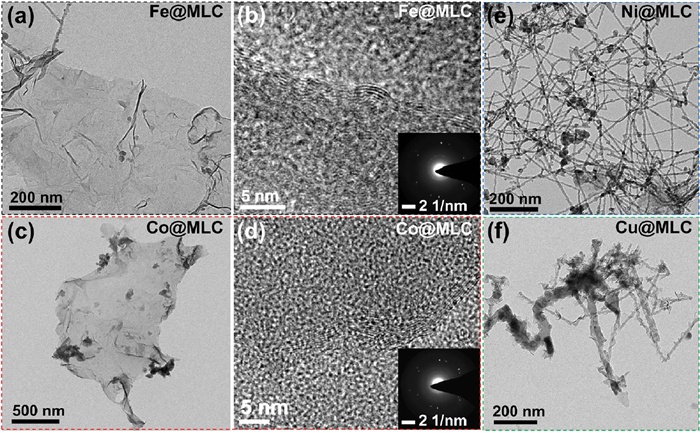
The morphology of decomposed carbon materials was characterized by scanning electron microscopy (SEM), transmission electron microscopy (TEM) and atomic force microscopy (AFM). The carbon phase in Fe@MLC showed a large area layered structure and a bit of filamentous carbon in TEM images (Fig. 3a). The layered structure was proved to be graphene (400 nm-1.2 µm) with some wrinkles. From the folded edge in high resolution transmission electron microscope (HRTEM) image (Fig. 3b), the graphene was found to be multi-layered (5 layers). Graphene showed the thickness of about 4 nm in AFM image (Fig. S3a in Supporting information), higher than theoretical value of 5 layered graphene around 1.7 nm. The actual measured thickness is often larger than the theoretical thickness of graphite monolayer (0.34 nm) due to the influence of the substrate and the presence of adsorbent on the surface [39]. Selected area electron diffraction (SAED, inset picture in Fig. 3b) pattern further proved the typical hexagonal crystalline nature of graphene [40–43]. Co@MLC also showed multi-layer graphene (700 nm-1.8 µm) and filamentous morphology (Figs. 3c and d, Fig. S3b in Supporting information). Ni@MLC showed a massive amount of filamentous carbon nanofibers (diameter of 20–30 nm with length about 1 µm, Fig. 3e and Fig. S3c in Supporting information). Cu@MLC also showed a massive amount of filamentous carbon nanofibers (diameter of 20–50 nm with length about 800 nm, Fig. 3f and Fig. S3d in Supporting information). The differences of carbon morphologies are mainly affected by different carbon solubilities, which are mainly influenced by temperature and the interaction between metal and support [44–48]. Carbon solubilities affect the carbon availability, nucleation and growth of carbon materials, which determining the type of carbon grown [49]. In addition, temperature influences the diffusion coefficient and solubility of carbon in metal-based catalysts. At a certain temperature, the carbon solubility for metals satisfies the trend of Fe > Co > Ni > Cu [49,50]. Additionally, different M@MAX catalysts have different microwave adsorption abilities, resulting in different reaction temperatures. Therefore, Fe/Co/Ni/Cu@MAX lead to different hydrogen selectivities and carbon morphologies.
Different kinds of carbon phase show its characteristic peaks at different temperatures in temperature programmed oxidation analysis (TPO, Fig. 2d) [4,9,51–53]. Graphitic carbons (CNFs and graphene) exhibit oxidation mass loss peak at higher temperature than amorphous carbons. The higher the temperature of the oxidation peak, the more stable the carbon phase. Graphene and MAX supported Fe catalyst (Fe@MLC) showed a strong peak around 800 ℃ in derivative thermogravimetry (DTG) curves, associated with high graphitic graphene. Characteristic peak assigned to filamentous carbon was too small to be covered by the strong peak belonged to graphene. And the peaks attributed to amorphous carbon (about 500 ℃) were negligible. Therefore, graphene accounts for the majority of carbon phase in Fe@MLC. However, due to the mass addition of MAX in air at higher than 200 ℃ [5], it is difficult to quantify the amount of graphene. Similarly, graphene also accounts for most of carbon phase in Co@MLC. For Ni@MLC and Cu@MLC, strong characteristic peaks attributed to CNFs were located at 830 ℃ and 815 ℃, respectively, indicating CNFs account for the majority of carbon phase in Ni@MLC and Cu@MLC.
Considering that carbon materials [54–56] and TixAlyCz [5] have outstanding electric conductivity. And the modification by non-noble metal could regulate the catalytic performance in electrocatalysis. We study the CAP electrocatalytic degradation performance of M@MLC.
Firstly, we screened different reaction conditions. We studied the effect of different metals on electrocatalytic dehalogenation (EDH) of chloramphenicol (CAP) (Fig. 4a). Graphene and MAX supported Fe catalyst (Fe@MLC) showed the best performance among the four M@MLC catalysts. Fe@MLC could degrade 94.8% of CAP in 60 min and completely degrade (99.2%) in 90 min at −1.2 V (vs. reversible hydrogen electrode, RHE). Co@MLC could remove 94.0% of CAP in 90 min and 99.2% in 120 min. Ni@MLC and Cu@MLC could degrade 90.7% and 92.0% in 150 min. The better performance of Fe@MLC probably due to the more amount of reductive H* produced by Fe and the existence of massive high conductive graphene which results from Fe selectivity catalyzed LDPE deconstruction [20,40].
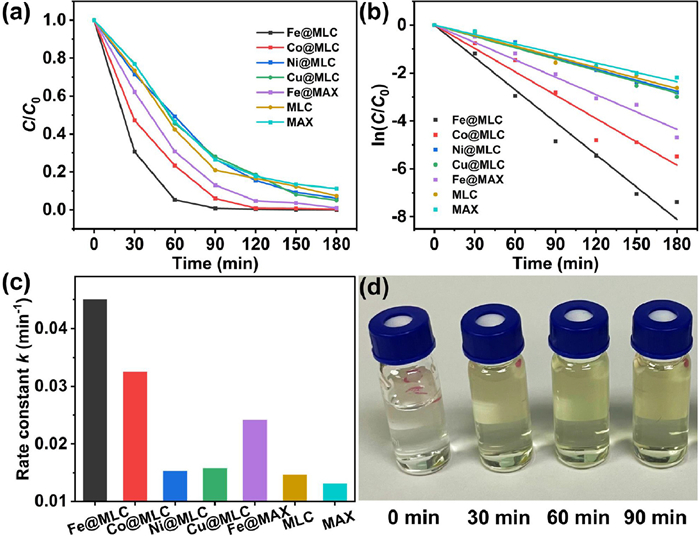
The removal efficiency of chloramphenicol (CAP) follows a pseudo-first order kinetic model (Fig. 4b), which can be expressed as Ln(C/C0) = -kt + b, where k is the reaction rate constant (min−1), b is a constant, t is the reaction time (t), and C and C0 are the concentrations of CAP at times of t = t and t = 0, respectively. The observed rate constant of Fe@MLC reached 0.045 min−1, higher than 0.032, 0.015 and 0.016 min−1 for Co@MLC, Ni@MLC and Cu@MLC, respectively (Fig. 4c, Fig. S4 and Table S2 in Supporting information). The results indicate that Fe@MLC electrode shows a much higher electrocatalytic activity compared to other electrodes for CAP dechlorination. The photo of electrolyte after CAP degradation catalyzed by Fe@MLC at −1.2 V (vs. RHE), 25 ℃ and initial pH 6.30 were shown in Fig. 4d.
In order to study the effects of metal atoms and carbon materials in M@MLC, we carried out the chloramphenicol degradation experiments on different M@MLCs. The rate constants follow the trends of Fe@MLC > Co@MLC > Ni@MLC > Cu@MLC > MLC. Fe@MLC showed the best performance among four M@MLC catalysts, and all M@MLCs performed better than pure MLC with no extra metals, which demonstrates the enhancement of metal atoms in chloramphenicol degradation. Additionally, we also investigated performances of MAX supported Fe catalyst (Fe@MAX) and MAX catalyst. The rate constant of MAX (0.013 min−1) is lower than that of Fe@MAX (0.024 min−1, Fig. 4c, Fig. S4 and Table S2), further proving the effect of metal atom. Compared with Fe@MAX, Fe@MLC contains carbon materials derived from LDPE decomposition, and the rate constant (0.045 min−1) is higher than that of Fe@MAX (0.024 min−1), demonstrating the derived carbon materials promote the chloramphenicol degradation. Therefore, the chloramphenicol degradation is synergistically promoted by both metal atoms and carbon materials, which influence the production of reductive H* or electron transfer [20,40].
To study the effect of voltage, the experiments were catalyzed by Fe@MLC under application voltages of −0.3, −0.6, −0.9, −1.2 and −1.4 V (vs. RHE) (Fig. 5a, Fig. S4 and Table S2). The reduction of chloramphenicol (CAP) was fastest at −1.2 V, reaching 99.2% in 90 min, with k of 0.045 min−1 (Fig. 5b). The reasons could be presumed as follows: Lower than −1.2 V, the electron transfer is restricted and higher than −1.2 V, the hydrogen evolution reaction (HER) as a competitive reaction is dominant [57]. Therefore, −1.2 V (vs. RHE) was selected as optimal voltage for subsequent experiments.
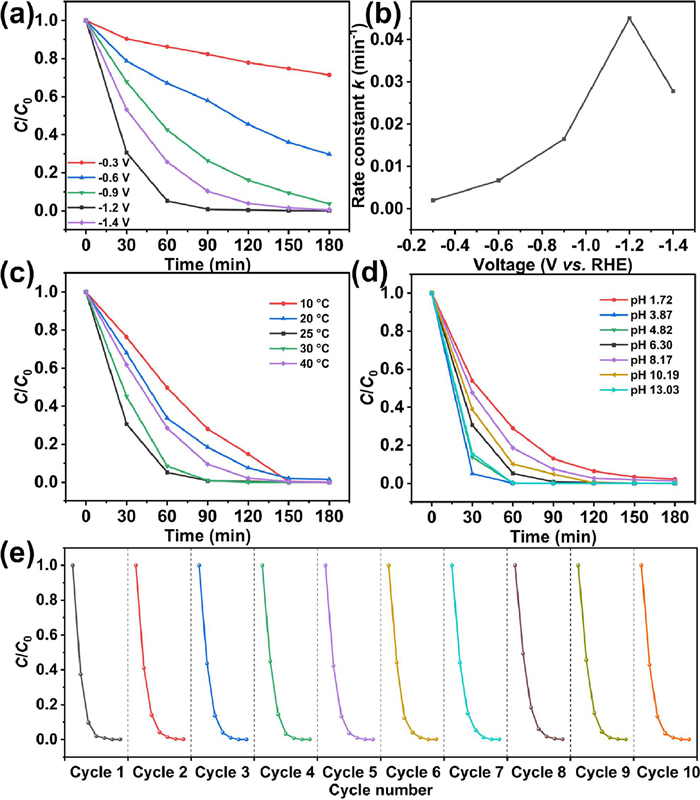
To study the effect of temperature, the experiments were conducted at constant temperatures varying from 10 ℃ to 40 ℃ (Fig. 5c, Fig. S5 and Table S2 in Supporting information). The performance follows the Sabatier principle (Fig. S5c). The rate constant was highest (0.055 min−1) at 30 ℃. Fe@MLC degraded 91.5% of CAP in 60 min and 99.0% in 90 min at 30 ℃. Higher temperatures probably promote the competitive HER reaction and the lower temperatures restrict the electron transfer. Subsequent experiments were conducted at 25 ℃.
To study the effect of pH, we adjusted the initial pH of the electrolyte from 1.72 to 13.03 with 1 mol/L sulfuric acid or 1 mol/L sodium hydroxide (Fig. 5d, Fig. S5 and Table S2). At pH 3.87, the rate constant reached highest 0.11 min−1 at pH 3.87, which ranks ahead of other reported works (Table S3 in Supporting information) including commercial Pd/C [20] and commercial Pt/C [21] electrodes, and Fe@MLC completely degrade chloramphenicol (CAP) (99.9%) in 60 min. In addition, at pH 13.03, the rate constant reached 0.10 and Fe@MLC completely degrade CAP (99.9%) in 60 min. Therefore, Fe@MLC could efficiently degrade CAP in a wide range of pH.
The reusability is an important factor of catalyst for electrocatalytic dehalogenation (EDH). We tested the reusability of Fe@MLC for ten cycles (Fig. 5e and Fig. S6a in Supporting information). After every cycle, new electrolytes and CAP solution were replaced. Fe@MLC electrode showed stable performance among the ten cycles. Even after the tenth cycle, Fe@MLC electrode could still remove 57.0% of CAP in 30 min, and 96.5% in 120 min and showed the rate constant of 0.048 min−1 (0.049 min−1 in the first cycle). All performances prove Fe@MLC is an efficient and stable catalyst for EDH of CAP.
CV tests were employed to investigate the feasibility for the dechlorination of chloramphenicol (CAP) (Fig. 6). Without CAP addition as blank control, a peak current of −4.94 µA appeared at the potential of 0.09 V (vs. RHE) on the Fe@MLC electrode. By contrast, after the addition of 50 mg/L CAP, the peak moved to 0.13 V (vs. RHE) and a new peak appeared at −0.17 V (vs. RHE) (Fig. 6a). The new reduction peak at −0.17 V (vs. RHE) could be attributed to the electron transfer from cathodes to CAP since they did not appear in the absence of CAP.
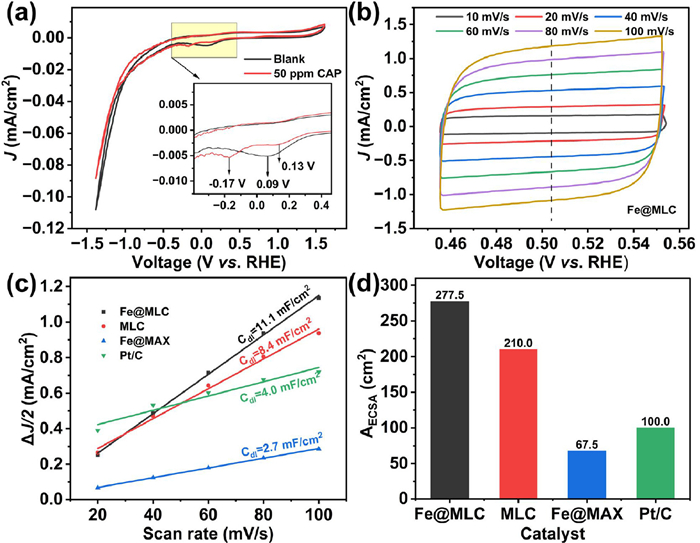
The electrochemical active surface area (ECSA), an important electrochemical property of an electrode, is proportional to the number of active sites of the electrocatalyst, and evaluates the activity of electrode materials [20,21,58,59]. Therefore, the ECSA of commercial Pt/C, Fe@MLC, MLC and Fe@MAX were tested by cyclic voltammetry (Fig. 6b and Fig. S7 in Supporting information). Calculated from the ratio of current density and voltage sweep rate (Fig. 6c), the ECSA of Fe@MLC is 277.5 cm2, which is approximately 2.7 times of commercial Pt/C electrode, 4.1 times of Fe@MAX and 1.3 times of MLC (Fig. 6d and Table S4 in Supporting information). The above electrochemical characterization prove that Fe@MLC has more active sites than commercial Pt/C, Fe@MAX and MLC, which means faster and more electron transfer on Fe@MLC. Faradic efficiency (FE) is an efficient parameter to evaluate the performance of catalyst in electrocatalytic system (described in Supporting information). In the electrocatalytic system, there are three pairs of redox reactions involving hydrogen evolution reaction, nitro reduction and hydrodechlorination (describe later) [60]. Assuming that all degraded chloramphenicol (CAP) molecules were converted to CAP-224, FE values of Fe@MLC, Co@MLC, Ni@MLC and Cu@MLC at 90 min were 8.5%, 9.1%, 7.2%, 7.4%, respectively.
Generally, the electrocatalytic dehalogenation reduction process follows two proposed mechanisms involving direct electron transfer and indirect reduction via atomic H* [32,34,61,62]. To identify the role of H* for CAP dechlorination at Fe@MLC electrode, tertiary butanol (t-BuOH) was added as H* scavenger (Fig. 7a) [40,63]. However, even with the addition of 20 mmol/L t-BuOH, the degradation efficiency was almost unchanged. When adding 200 mmol/L t-BuOH, Fe@MLC could still remove 83.6% of CAP in 60 min, with rate constant remained 0.043 min−1 (Fig. S8 and Table S2 in Supporting information). Therefore, atomic H* plays a relatively minor role in CAP decholorination catalyzed by Fe@MLC.
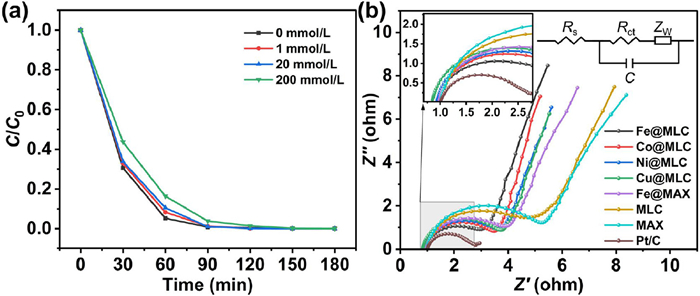
To further support the direct mechanism, we measured electrochemical impedance spectroscopy (EIS) of electrodes. In EIS, the arc radius of the EIS Nyquist circle corresponds to the electron transfer resistance (Rct) [64–66]. Fe@MLC showed the lowest Rct among electrodes except for Pt/C, which explained why Fe@MLC outperformed other electrodes (Fig. 7b and Table S5 in Supporting information). Therefore, the primary dechlorination of chloramphenicol (CAP) at Fe@MLC electrode is achieved by the direct mechanism. All these mechanism characterizations prove Fe@MLC is an ideal electrode to reduce CAP on the cathode surface via direct mechanism.
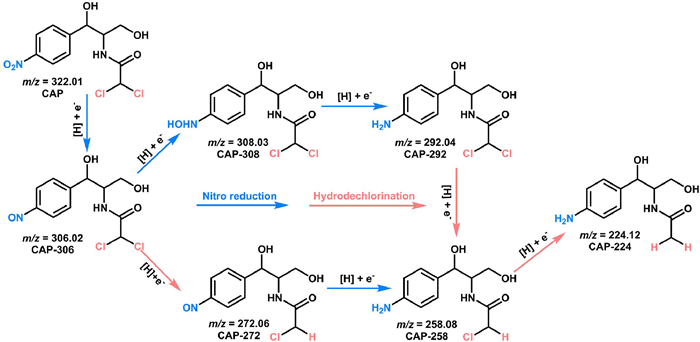
We identified the intermediate products by LC-MS to speculate the reaction pathway of chloramphenicol (CAP) degradation on Fe@MLC (Fig. 8 and Fig. S9 in Supporting information). Under the synergistic effect of electron transfer and reductive H*, it showed two possible reaction pathways: nitro reduction and hydrodechlorination. With the reaction proceeded, high toxic CAP was converted to less toxic products, including CAP-306, CAP-308, CAP-292, CAP-272, CAP-258 and CAP-224 [17,21]. Impressively, CAP-224 (N-[1-(4-aminophenyl)−1,3-dihydroxypropan-2-yl]acetamide) is a not harmful aromatic amine according to ECOSAR program [21,67].
In this work, we illustrated a strategy that treatment of waste water with waste plastic. We synthesized efficient electrochemical catalysts M@MLC for chloramphenicol (CAP) degradation from microwave-initiated M@MAX catalyzed LDPE decomposition. Highly graphitic graphene was acquired from LDPE decomposition in 5 min catalyzed by MAX supported Fe catalyst (Fe@MAX). High removal efficiency (99.2% in 90 min) and electrochemical active surface area (ECSA, 2.7 times of Pt/C) are reached catalyzed by graphene and MAX supported Fe catalyst (Fe@MLC) for electrocatalytic dehalogenation of CAP. Fe@MLC retained robust removal efficiency of 96.5% in 120 min and a high-rate constant k of 0.048 min−1 after 10 cycles. Fe@MLC could completely (99.9%) degrade CAP at pH 3.87 within 60 min with k of 0.11 min−1 outperforming other works. The electrocatalytic dehalogenation of CAP catalyzed by M@MLC mainly proceeds by the direct electron transfer mechanism. The M@MLC catalysts from plastic waste broadens the field of catalysts for chloramphenicol degradation and avoid the use of noble metals in waste water treatment. This work may attract widespread research interest to broaden the new application of plastic waste-upcycled resources and reveals the potential of treating waste with waste.
The authors declare that they have no known competing financial interests or personal relationships that could have appeared to influence the work reported in this paper.
We gratefully acknowledge the financial support provided by the National Key R & D Program of China (Nos. 2020YFC1808401 and 2020YFC1808403), National Natural Science Foundation of China (Nos. 22078213, 21938006 and 51973148), Basic Research Project of Cutting-Edge Technology in Jiangsu Province (No. BK20202012), Prospective Application Research Project of Suzhou (No. SYC2022042), Water Research and Technology Project of Suzhou (No. 2022006), and the Priority Academic Program Development of Jiangsu Higher Education Institutions (PAPD).
Supplementary material associated with this article can be found, in the online version, at doi:
A.J. Martín, C. Mondelli, S.D. Jaydev, J. Pérez-Ramírez, Chem 7 (2021) 1487–1533. doi: 10.1016/j.chempr.2020.12.006
X. Zhao, M. Korey, K. Li, et al., Chem. Eng. J. 428 (2022) 131928. doi: 10.1016/j.cej.2021.131928
H. Bai, P. He, L. Hao, et al., Chem. Eng. J. 456 (2023) 140994. doi: 10.1016/j.cej.2022.140994
X.Y. Jie, W.S. Li, D. Slocombe, et al., Nat. Catal. 3 (2020) 902–912. doi: 10.1038/s41929-020-00518-5
Q. Cao, H.C. Dai, J.H. He, et al., Appl. Catal. B 318 (2022) 121828. doi: 10.1016/j.apcatb.2022.121828
Y. Zhang, Z. Fu, W. Wang, et al., ACS Sustain. Chem. Eng. 10 (2021) 91–103.
J. Gong, X. Chen, T. Tang, Prog. Polym. Sci. 94 (2019) 1–32. doi: 10.1016/j.progpolymsci.2019.04.001
D.D. Yao, H. Li, Y.J. Dai, C.H. Wang, Chem. Eng. J. 408 (2021) 127268. doi: 10.1016/j.cej.2020.127268
D.D. Yao, H.P. Yang, Q. Hu, et al., Appl. Catal. B 280 (2021) 119413. doi: 10.1016/j.apcatb.2020.119413
D.D. Yao, H.P. Yang, H.P. Chen, P.T. Williams, Appl. Catal. B 239 (2018) 565–577. doi: 10.1016/j.apcatb.2018.07.075
D.D. Yao, Y.S. Zhang, P.T. Williams, H.P. Yang, H.P. Chen, Appl. Catal. B 221 (2018) 584–597. doi: 10.1016/j.apcatb.2017.09.035
K. Ding, S.S. Liu, Y. Huang, et al., Energy Convers. Manage. 196 (2019) 1316–1325. doi: 10.1016/j.enconman.2019.07.001
I. Vollmer, M.J.F. Jenks, M.C.P. Roelands, et al., Angew. Chem. Int. Ed. 59 (2020) 15402–15423. doi: 10.1002/anie.201915651
G. Gan, S. Fan, X. Li, et al., ACS Catal. 11 (2021) 14284–14292. doi: 10.1021/acscatal.1c03701
R. Mao, X. Zhao, H. Lan, H. Liu, J. Qu, Water Res. 77 (2015) 1–12. doi: 10.1016/j.watres.2015.03.002
C. Shi, S. Yu, C. Li, Chem. Eng. J. 441 (2022) 136052. doi: 10.1016/j.cej.2022.136052
X. Song, D. Huang, L. Zhang, et al., Electrochim. Acta 330 (2020) 135187. doi: 10.1016/j.electacta.2019.135187
C. Zheng, X. Zhang, Z. Zhou, Z. Hu, eScience 2 (2022) 219–226. doi: 10.1016/j.esci.2022.02.009
W. Utetiwabo, L. Yang, M.K. Tufail, et al., Chin. Chem. Lett. 31 (2020) 1474–1489. doi: 10.1016/j.cclet.2020.01.003
Y. Min, X. Zhou, J.J. Chen, et al., Nat. Commun. 12 (2021) 303. doi: 10.1038/s41467-020-20619-w
L.X. Li, G.C. Zhang, W.J. Sun, et al., Chem. Eng. J. 433 (2022) 134415. doi: 10.1016/j.cej.2021.134415
Y. Yang, L. Xu, J. Wang, Chem. Eng. J. 425 (2021) 131497. doi: 10.1016/j.cej.2021.131497
M. Herraiz-Carbone, S. Cotillas, E. Lacasa, et al., Sci. Total Environ. 725 (2020) 138430. doi: 10.1016/j.scitotenv.2020.138430
D. Kong, B. Liang, H. Yun, et al., Water Res. 72 (2015) 281–292. doi: 10.1016/j.watres.2015.01.025
N. Guo, Y. Wang, L. Yan, et al., Water Res. 117 (2017) 95–101. doi: 10.1016/j.watres.2017.03.058
W. Zheng, C.S. Tsang, L.Y. So, et al., Appl. Catal. B 256 (2019) 117824. doi: 10.1016/j.apcatb.2019.117824
Y. Xue, Z. Wang, R. Bush, et al., Chem. Eng. J. 415 (2021) 129041. doi: 10.1016/j.cej.2021.129041
H. Xu, Y. Sheng, Chem. Eng. J. 414 (2021) 128823. doi: 10.1016/j.cej.2021.128823
X. Song, H. Zhang, Z. Bian, H. Wang, J. Hazard. Mater. 412 (2021) 125162. doi: 10.1016/j.jhazmat.2021.125162
J. Chen, Y. Xia, Q. Dai, Electrochim. Acta 165 (2015) 277–287. doi: 10.1016/j.electacta.2015.02.029
S. Qin, C. Lei, X. Wang, W. Chen, B. Huang, Cell Rep. Phys. Sci. 3 (2022) 100713. doi: 10.1016/j.xcrp.2021.100713
Y.H. Luo, Y. Cai, X. Long, et al., Environ. Sci. Technol. 56 (2022) 4447–4456. doi: 10.1021/acs.est.1c08347
G. Gan, S. Fan, X. Li, et al., Chem. Eng. J. 434 (2022) 134547. doi: 10.1016/j.cej.2022.134547
W. Yu, H. Jiang, J. Fang, S. Song, Environ. Sci. Technol. 55 (2021) 10087–10096. doi: 10.1021/acs.est.1c01922
J.V. Gulmine, P.R. Janissek, H.M. Heise, L. Akcelrud, Polym. Test. 21 (2002) 557–563. doi: 10.1016/S0142-9418(01)00124-6
L. Qian, Y. Xie, M. Zou, J. Zhang, J. Am. Chem. Soc. 143 (2021) 18805–18819. doi: 10.1021/jacs.1c08554
D.X. Luong, K.V. Bets, W.A. Algozeeb, et al., Nature 577 (2020) 647–651. doi: 10.1038/s41586-020-1938-0
Z. Sun, Z. Yan, J. Yao, et al., Nature 468 (2010) 549–552. doi: 10.1038/nature09579
Y. Yao, L. Ren, S. Gao, S. Li, J. Mater. Sci. Technol. 33 (2017) 815–820. doi: 10.1016/j.jmst.2016.07.020
R. Mao, N. Li, H. Lan, et al., Environ. Sci. Technol. 50 (2016) 3829–3837. doi: 10.1021/acs.est.5b05006
M.K. Bayazit, L. Xiong, C. Jiang, et al., ACS Appl. Mater. Interfaces 13 (2021) 28600–28609. doi: 10.1021/acsami.1c03906
P. Gong, C. Tang, B. Wang, et al., ACS Cent. Sci. 8 (2022) 394–401. doi: 10.1021/acscentsci.1c01578
K.M. Wyss, W. Chen, J.L. Beckham, P.E. Savas, J.M. Tour, ACS Nano 16 (2022) 7804–7815. doi: 10.1021/acsnano.2c00379
J.C. Acomb, C.F. Wu, P.T. Williams, Appl. Catal. B 180 (2016) 497–510. doi: 10.1016/j.apcatb.2015.06.054
J. Wu, W. Chen, L. Chen, X. Jiang, J. Hazard. Mater. 424 (2022) 127648. doi: 10.1016/j.jhazmat.2021.127648
S. Sharma, G. Kalita, R. Hirano, et al., Carbon 72 (2014) 66–73. doi: 10.1016/j.carbon.2014.01.051
J. Choi, I. Yang, S.S. Kim, S.Y. Cho, S. Lee, Macromol. Rapid Commun. 43 (2022) e2100467. doi: 10.1002/marc.202100467
J. Gong, J. Liu, X. Wen, et al., Ind. Eng. Chem. Res. 53 (2014) 4173–4181. doi: 10.1021/ie4043246
W.W. Liu, A. Aziz, S.P. Chai, A.R. Mohamed, U. Hashim, J. Nanomater. 2013 (2013) 1–8.
M.S. Yoo, H.C. Lee, S. Lee, et al., Adv. Mater. 29 (2017) 1700753. doi: 10.1002/adma.201700753
A.A. Aboul-Enein, A.E. Awadallah, Fuller. Nanotub. Carbon Nanostruct. 26 (2018) 591–605. doi: 10.1080/1536383X.2018.1476344
S. Zhao, C. Wang, B. Bai, H. Jin, W. Wei, J. Hazard. Mater. 421 (2022) 126763. doi: 10.1016/j.jhazmat.2021.126763
J. Huang, A. Veksha, W.P. Chan, A. Giannis, G. Lisak, Renew. Sustain. Energy Rev. 154 (2022) 111866. doi: 10.1016/j.rser.2021.111866
F. Zhang, Y.H. Li, J.Y. Li, Z.R. Tang, Y.J. Xu, Environ. Pollut. 253 (2019) 365–376. doi: 10.1016/j.envpol.2019.06.089
Y.H. Li, Z.R. Tang, Y.J. Xu, Chin. J. Catal. 43 (2022) 708–730. doi: 10.1016/S1872-2067(21)63871-8
C. Han, Y.H. Li, M.Y. Qi, et al., Sol. RRL 4 (2020) 1900577. doi: 10.1002/solr.201900577
G. Gan, X. Li, L. Wang, et al., ACS Catal. 9 (2019) 10931–10939. doi: 10.1021/acscatal.9b02853
J. Zhou, Z. Lou, Z. Wang, et al., Chem. Eng. J. 414 (2021) 128758. doi: 10.1016/j.cej.2021.128758
Y. Shen, Y. Tong, J. Xu, et al., Appl. Catal. B 264 (2020) 118505. doi: 10.1016/j.apcatb.2019.118505
Z. Lou, C. Yu, X. Wen, et al., Appl. Catal. B 317 (2022) 121730. doi: 10.1016/j.apcatb.2022.121730
Y. Mo, J. Xu, L. Zhu, Environ. Sci. Technol. 56 (2022) 5808–5819. doi: 10.1021/acs.est.2c00284
D. Huang, D.J. Kim, K. Rigby, et al., Environ. Sci. Technol. 55 (2021) 13306–13316.
J. Zhou, Z. Lou, K. Yang, et al., Appl. Catal. B 244 (2019) 215–224. doi: 10.1016/j.apcatb.2018.11.052
W. Sugimoto, H. Iwata, K. Yokoshima, Y. Murakami, Y. Takasu, J. Phys. Chem. B 109 (2005) 7330–7338. doi: 10.1021/jp044252o
B. Duan, X. Gao, X. Yao, et al., Nano Energy 27 (2016) 482–491. doi: 10.1016/j.nanoen.2016.07.034
A. Li, X. Zhao, Y. Hou, et al., Appl. Catal. B 111-112 (2012) 628–635.
C. Zhang, F. Li, R. Wen, et al., Water Res. 182 (2020) 115975. doi: 10.1016/j.watres.2020.115975

Figure 1 LDPE decomposition results catalyzed by M@MAX. (a) gas composition and (b) gas/liquid/solid yields. (c) Temperature and (d) gas volume verse time.

Figure 2 Characterization of M@MLC. (a) PXRD patterns, (b) ATR-FTIR spectra, (c) Raman spectra, (d) TPO and DTG curves.

Figure 3 Morphology characterization on the solid product M@MLC. (a) TEM image, (b) HRTEM image and SAED pattern of Fe@MLC. (c) TEM image, (d) HRTEM image and SAED pattern of Co@MLC. TEM images of (e) Ni@MLC and (f) Cu@MLC.

Figure 4 (a) Degradation efficiency, (b) pseudo-first order kinetic curves and (c) rate constants catalyzed by different M@MLCs at −1.2 V (vs. RHE), 25 ℃ and initial pH 6.30; (d) Photo of electrolyte after CAP degradation catalyzed by Fe@MLC at −1.2 V (vs. RHE), 25 ℃ and initial pH 6.30.

Figure 5 CAP degradation performance at different conditions. Effects of (a) applied potentials, (b) rate constants verse voltage, (c) temperatures and (d) pH values on degradation of CAP catalyzed by Fe@MLC; (e) Cycling performance of Fe@MLC.

Figure 6 (a) Cyclic voltammetry curves of Fe@MLC in 0.5 mol/L Na2SO4 solution (blank) and 50 mg/L CAP solution. (b) CV curves of Fe@MLC at different scan rates. (c) Plots of the current density versus the scan rate and (d) AECSA for Fe@MLC, MLC, Fe@MAX and Pt/C.

Figure 7 (a) Degradation of CAP on Fe@MLC under different t-BuOH concentrations. (b) Nyquist diagrams obtained at different catalyst electrodes. Inset is the equivalent electrical circuit used to fit the EIS data.

 扫一扫看文章

扫一扫关注我们
 DownLoad:

 下载:
下载:

 下载:
下载: