Table 1.
Phase-field simulation parameters.
Citation:
Yajie Li, Liting Sha, Geng Zhang, Bin Chen, Wei Zhao, Yiping Wang, Siqi Shi. Phase-field simulation tending to depict practical electrodeposition process in lithium-based batteries[J]. Chinese Chemical Letters,
2023, 34(2): 107993.
doi:
10.1016/j.cclet.2022.107993

Phase-field simulation tending to depict practical electrodeposition process in lithium-based batteries
English
Phase-field simulation tending to depict practical electrodeposition process in lithium-based batteries
Abstract:
Lithium dendrite growth due to uneven electrodeposition usually leads to the potential hazard of internal short circuit and shorter lifetime of lithium-based batteries. Extensive efforts have been devoted to explore the effects of single or two factors on dendrite growth, involving the diffusion coefficient, exchange current density, electrolyte concentration, temperature, and applied voltage. However, these factors interrelate during battery operation, signifying that a understanding of how they jointly influence the electrodeposition is of paramount importance for the effective suppression of dendrites. Here, we incorporate the dependent relationships among key factors into the phase-field model to capture their synergistic effects on electrodeposition. All the simulations are implemented in our self-written MATLAB code under a unified modeling framework. Following this, five groups of experimentally common dendrite patterns are reproduced and the corresponding electrodeposition driving forces are identified. Unexpectedly, we find that with the decrease of the ratio of exchange current density (or applied voltage) to diffusion coefficient, the electrodeposition morphology changes from needle-like dendrites to columnar dendrites and to uniform deposition. The present phase-field simulation tends to depict the practical electrodeposition process, providing important insights into synergistic regulation to suppress dendrite growth.
-
Key words:
- Lithium-based batteries
- / Dendrite growth
- / Phase-field model
- / Parametric study
- / Synergistic effects
-
Lithium-based batteries have been vigorously developed, with wide applications ranging from portable electronic devices to electric vehicles, which brings forward higher requests for their safety performances. The main safety challenge about lithium-based batteries stems from the dendrite growth during non-uniform electrodeposition, which may penetrate through the separator/solid electrolyte cause short circuit and even thermal runaway [1]. Extensive experimental efforts have been made to achieve smoother electrodeposition surfaces, including modification of the electrode [2-4], electrolyte [5-7], separator [8], regulation of temperature/pressure [9, 10], etc. Since the lithium-ion/potential distributions and dendrite microstructural evolution inside batteries can hardly be accurately observed in real-time by experiments, the fundamental mechanism of electrodeposition is still far from fully understood, which requires comprehensive insights from theoretical and computational methods.
The electrochemical phase-field model, combining the Butler-Volmer kinetics, is a powerful tool to simulate the electrodeposition process due to its advantage in tracking interfacial morphology [11-13]. By using electrochemical phase-field model, Wang and Lin [14, 15] explored the dendrite morphology of zinc/uranium and found that dendrite growth is inhibited with the increase of diffusion coefficient (Dl). Liu et al. [16, 17] found that lower exchange current density (jr, 0) is beneficial for homogeneous Li deposition. Wang, Xu and Gao [14, 18, 19] found that diluted electrolyte is one of the underlying driving forces for non-uniform Li electrodeposition. Hong and Yan [20, 21] proved that both internal heat and the ambient temperature (T) can suppress Li dendrite growth. Shibuta, Chen and Jing [22-24] found that the dendrite growth rate increases with applied electric potential (Φapply). These studies have provided abundant mechanisms of electrodeposition and proposed many dendrite suppression strategies. Nevertheless, most of the factors are studied individually, while in fact, they are dynamically interrelated during battery operation [25]. Besides, they are not conducted under one unified modeling framework hence the roles of factors are lack of comparability. For example, the change of electrolyte concentration (Cl) will synchronously affect Dl and jr, 0. Therefore, a more comprehensive view of their jointly influence on electrodeposition is strongly needed. Herein, we incorporate the dependent relationships among key factors (Dr, 0, C and Φapply) into the electrochemical phase-field model to capture their synergistic effects on electrodeposition.
In this study, an electrochemical phase-field model is used to simulate lithium electrodeposition in Li|Li+, Am−, OS half-cells, where Li is the electrode, LimA is the electrolyte, and OS is the organic solvent. Let the molar concentrations of Li, Li+, Am−, the electrode bulk phase and electrolyte bulk phase be CLi, C+, C-, Cs and Cl, respectively. We define the phase-field variable as ξ = CLi/Cs (ξ = 1 denotes electrode, ξ = 0 denotes electrolyte, 0 < ξ < 1 denotes interface) and a series of dimensionless concentrations as c+ = C+/C- = C-/Cl. The free energy density of the system can be expressed as (Eqs. 1–5):
(1) where

(2) (3) (4) (5) where R is the gas constant; T is the temperature, z+ and z− are the valence of Li+ and Am−,


The reaction current density of the system is given by the Butler-Volmer equation (Eq. 6):
(6) where α is the charge transfer coefficient, and η is the activation overpotential. The evolution of phase-field variable ξ is described as (Eq. 7):
(7) where Lσ is the interfacial mobility, and Lη is the kinetic coefficient. Taking the electromigration, ion diffusion, and electrochemical reactions into account, the evolution equation of lithium ion concentration is given as (Eq. 8):
(8) where

(9) where

The numerical solutions of Eqs. 7–9 are obtained by using finite difference method on MATLAB. A two-dimensional mesh of 200 × 200 is used, with grid spacing 0.8 µm. The corresponding parameters are listed in Table 1.
Table 1
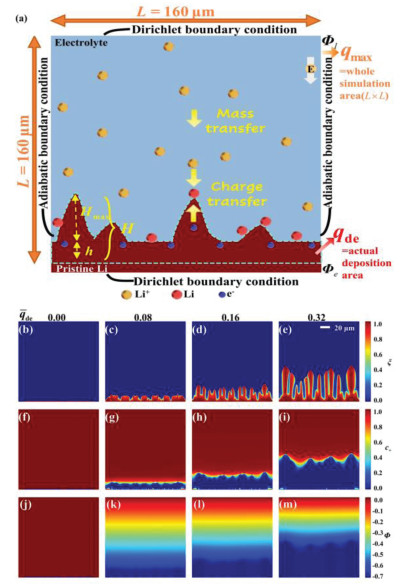
The schematic of the two-dimensional electrodeposition process in half-cell system is shown in Fig. 1a. The electric potential at the top and bottom boundaries are set as Φl and Φe. The Dirichlet boundary conditions are applied to the top and bottom boundaries, the Adiabatic boundary conditions are applied to the left and right boundaries. In this paper, the scaled amount of electrodeposition qde is used to depict the lithium deposition at different stages (Eq. 10):
(10) here, qmax is the maximum deposition in the simulated region (area of the whole simulation zone, calculated by 160 × 160 µm2), qde is the real-time amount of deposition, which is equal to the actual deposition area (red region) in two-dimensional simulation. The maximum protruding dendrite height Hmax = H − h with H being the total height of electrodeposition, and h being the average thickness of uniform deposition [28]. Space utilization Us = qde/(H × L) is used to quantify the dendrite morphology with L = 160 µm being the width of simulation area [29]. The deposition morphologies are classified into three categories according to Us: needle-like dendrites (Us ≤ 50%), columnar dendrites (50% < Us < 90%), and uniform deposition (Us ≥ 90%).
Figure 1
 Figure 1. Schematic and validation of the electrochemical phase-field model. (a) Electrodeposition process in half-cell system. Simulated results: (b–e) Phase-field variable, (f–i) Li+ concentration, and (j–m) electric potential.
First, the electrochemical phase-field model is tested and compared with previous studies. The electric potential at the top and bottom boundaries are set as 0 V and –0.700 V, respectively. In addition to Table 1, Cl is set to 1 mol/L, T is set to 298 K. Under these standard conditions, jr, 0, Dl and σl are calculated to be 19.2 A/m2, 2.895 × 10⁻¹⁰ m2/s, and 1.18 S/m, respectively [27, 30]. In this paper, j0 =19.2 A/m2 and D0 = 2.895 × 10⁻¹⁰ m2/s are selected as reference parameters for jr, 0 and Dl. Lη = 0.0017 s−1 is calculated through

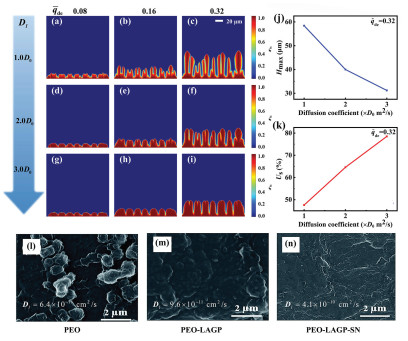
The ion diffusion coefficient in electrolyte Dl is an important kinetic parameter during the mass transfer process. When Dl increases from 1.0D0 to 3.0D0 (Figs. 2a-i), the Li deposition morphology changes from needle-like dendrites with larger aspect ratio (Figs. 2a–c) to columnar dendrites with smaller aspect ratio (Figs. 2g–i), the maximum dendrite height Hmax decreases from 58.4 µm to 31.2 µm (Fig. 2j), and the space utilization Us increases from 47.6% to 78.5% (Fig. 2k). With the consumption of lithium ions during electrodeposition reaction, the ion concentration gradients at the electrode/electrolyte interface are enlarged. For the electrolyte with smaller diffusion coefficient, the replenishment of consumed ions is slower, and the ion concentration gradient at the interface is larger (Fig. S1 in Supporting information), hence the dendrite growth is relatively severer. Besides, the lack of lithium ions under smaller Dl also amplifies the "tip effect", and causes an electric field from the valley region towards the dendrite tip in the horizontal direction (Fig. S2c in Supporting information), and thus promotes unevendeposition. This trend is in accordance with many experiment results [33-35]. For example, Peng et al. [35] investigated the electrodeposition morphology under various electrolytes with increasing diffusion coefficients, e.g., polyethylene oxide (PEO), PEO-Lithium germanium aluminium phosphate (LAGP) and PEO-LAGP-succinonitrile (SN) (Figs. 2l–n). With the increase of Dl, the deposition morphology changes from uneven and severe dendrites to relatively homogeneous deposition.
Figure 2
 Figure 2. Effect of diffusion coefficient on lithium electrodeposition: (a–c) 1.0D0, (d–f) 2.0D0, (g–i) 3.0D0, (j) maximum dendrite growth height Hmax, (k) space utilization Us versus diffusion coefficients when qde, and (l–n) SEM images of Li deposition morphology under various electrolytes with increasing diffusion coefficients. Reprinted with permission [35]. Copyright 2019, Royal Society of Chemistry.
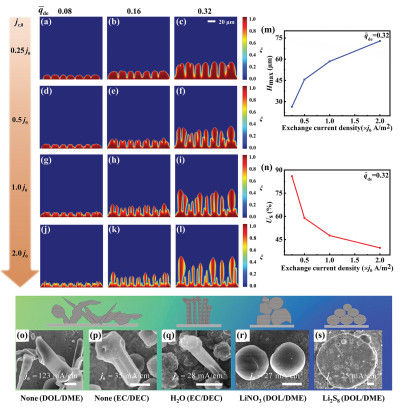
Exchange current density jr, 0 is the decisive factor during charge transfer process. Lithium electrodeposition under various jr, 0 (0.25j0, 0.5j0, 1.0j0 and 2.0j0) is presented in Figs. 3a–l. All snapshots are also captured with fixed qde (0.08, 0.16, and 0.32). With the increase of jr, 0, the lithium deposition morphology changes from columnar dendrites (Figs. 3a–c) to needle-like dendrites (Figs. 3j–l), Hmax increases from 26.4 µm to 72.8 µm, and Us decreases from 86% to 39.6% (Figs. 3m and n). Normally, lithium ions are preferentially deposited around the dendrite tips due to stronger electrical field and shorter distance from the bulk electrolyte than valleys [36]. Under higher jr, 0, the electrodeposition rate is faster, and the consumed Li+ near valleys could be hardly replenished immediately, which will amplify the "tip effect". Moreover, during the nucleation and early dendrite growth stage (Figs. 3a, d, g and j), lower jr, 0 is helpful to form rounder nuclei [16], which leads to columnar dendrites with smaller aspect ratio. The exchange current density can be adjusted by regulating the electrolyte component/concentration, temperature, electrode matrix, etc. The above simulation results are consistent with the experimental results of Shi et al. (Figs. 3o–s) [37]. They investigated the electrodeposition morphologies under various electrolytes and attempt to seek the dominant mechanism under complex dendrite patterns, and jr, 0 was found to be the key indicator. In the case of 1, 3-dioxolane (DOL)/1, 2-dimethoxyethane (DME) and ethylene carbonate (EC)/diethyl carbonate (DEC) electrolyte (Figs. 3o and p), the system possesses higher jr, 0, the deposition is whisker-like. With the addition of inhibiting additives, jr, 0 decreases (Figs. 3q–s) and the morphology of lithium deposits changes from randomly oriented whiskers to compactly packed round disks.
Figure 3
 Figure 3. Effect of exchange current density on lithium electrodeposition morphology: (a–c) 0.25j0, (d–f) 0.5j0, (g–i) 1.0j0, (j–l) 2.0j0, (m) maximum dendrite growth height Hmax, (n) space utilization Us in four exchange current densities when qde, and (o–s) SEM images of Li deposition morphology under decreasing exchange current densities. Reprinted with permission [37]. Copyright 2017, National Academy of Sciences.
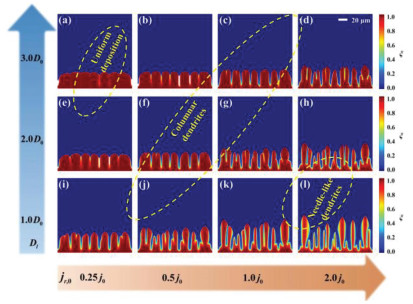
The diffusion coefficient and exchange current density are closely interrelated during electrodeposition, hence their synergistic effect cannot be omitted. With the decrease of jr, 0 (from 2.0j0 to 0.25j0) and the increase of Dl (from 1.0D0 to 3.0D0), the lithium electrodeposition morphology changes from needle-like dendrites to columnar dendrites and to uniform deposition (Fig. 4), which reveals the dual-factor synergistic dendrite inhibition is more effective than single factor regulation. At lower jr, 0 and higher Dl (reaction control), the ion concentration gradient at the interface is smoothed due to lower electrodeposition reaction rate and faster ion transport (Fig. S3a in Supporting information), and accordingly propitious to form uniform electrodeposition. While at higher jr, 0 and lower Dl (diffusion control), ions consumed by fast electrodeposition reaction could not be replenished in time by slower diffusion (Fig. S3l in Supporting information), which leads to the formation of needle-like dendrites with larger aspect ratio.
Figure 4
 Figure 4. Synergistic effect of exchange current density and diffusion coefficient on Li electrodeposition morphology when qde: (a) (0.25j0, 3.0D0), (b) (0.5j0, 3.0D0), (c) (1.0j0, 3.0D0), (d) (2.0j0, 3.0D0), (e) (0.25j0, 2.0D0), (f) (0.5j0, 2.0D0), (g) (1.0j0, 2.0D0), (h) (2.0j0, 2.0D0), (i) (0.25j0, 1.0D0), (j) (0.5j0, 1.0D0), (k) (1.0j0, 1.0D0), (l) (2.0j0, 1.0D0). The dashed lines mark various dendrite morphologies.
Apart from the above two essential factors (jr, 0 and Dl), electrolyte concentration (Cl) and temperature (T) are also important to electrodeposition since they markedly affect the ion deposition rate and the structure of solid electrolyte interphase layers, which is closely related to the compositions, morphologies, and properties of the sediment [38, 39]. Moreover, they have dynamic effects on other key parameters such as jr, 0, Dl and ionic conductivity (σl). Here we take LiPF6 electrolyte in ethylene carbonate (EC)/dimethyl carbonate (DMC) (1/1) as an example to explore the effect of Cl and T on Li electrodeposition by considering their relations between jr, 0, Dl and σl. The jr, 0, Dl and σl in 0.1–3 mol/L LiPF6 electrolyte at 298 K are calculated as follows (Eqs. 11–13) [40, 41], detailed derivation is given in Supporting information (units: Dl in m2/s, σl in S/m, and jr, 0 in A/m2).
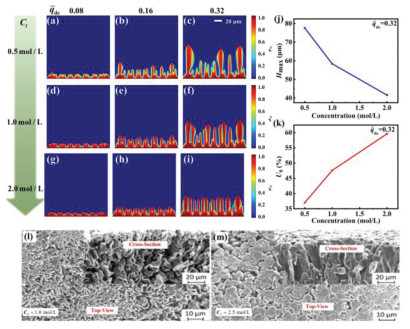
(11) (12) (13) We include the above dependent relationships among factors into the phase-field model to capture the realistic effect of Cl on electrodeposition. Under lower Cl (Figs. 5a–c), the consumed ions at the electrolyte/electrode interface could not be replenished in time (Figs. S4a–c in Supporting information), which intensifies the "tip effect" and promotes the growth of needle-like dendrites. As C increased from 0.5 mol/L (Figs. 5a–c) to 2.0 mol/L (Figs. 5g–i), although the corresponding decrease of Dl and the increase of jr, 0 are counterproductive to uniform electrodeposition, the larger ion diffusion flux brought by higher Cl is still the dominant factor, which can obviously replenish consumed ions (Figs. S4g–i in Supporting information) and inhibit dendritic growth (Figs. 5j and k). The above results are in accordance with the experiment results of Zhang et al. [42]. They found that compared to lower Cl (1 mol/L LiFSI-DOL), the Li deposition in higher Cl (2.5 mol/L LiFSI-DOL) is smoother and shorter (Figs. 5l and m).
Figure 5
 Figure 5. Effect of electrolyte concentration on lithium electrodeposition morphology: (a–c) 0.5 mol/L, (d–f) 1.0 mol/L, (g–i) 2.0 mol/L, (j) maximum dendrite growth Hmax, (k) space utilization Us when qde, and (l, m) SEM images of Li deposition morphology of LiFSI-DOL. Reprinted with permission [42]. Copyright 2018, Elsevier.
Similarly, the effect of temperature on Li electrodeposition is also complex since the variation of temperature will also synchronously influence Dl and jr, 0 (Eqs. 14–16) [30, 43]. The Dl and jr, 0 in 1 mol/L LiPF6 under temperatures ranging from 263 K to 323 K are expressed as (a detailed derivation is given in Supporting information, units: Dl in m2/s, σl in S/m, and jr, 0 in A/m2) [40, 44]:
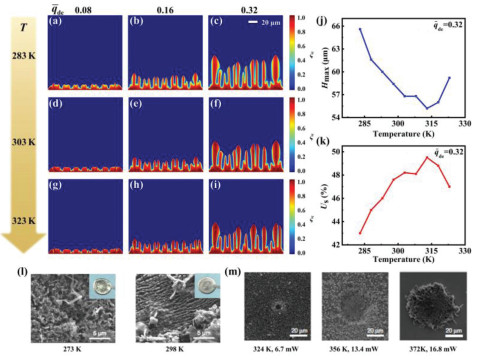
(14) (15) (16) We include the above dependent relationships among factors into the phase-field model to capture the realistic effect of temperature on electrodeposition (Figs. 6a–k). The results show that with the increase of temperature (283 K to 313 K), Hmax decreases by 10.4 µm, and Us increases by 6.5%, indicating that the increase of temperature has a certain inhibitory effect on dendrite growth. This trend is in accordance with the experimental results of Sheng et al. (Fig. 6l) [45], the SEM results demonstrate that higher temperatures can effectively inhibit dendrite growth. However, when the temperature increases from 313 K to 323 K, Hmax increases by 4 µm, and Us decreases by 2.5%. Although the increase of Dl and σl with the increase of temperature can facilitate uniform Li deposition, jr, 0 increases exponentially with temperature and becomes the dominant factor. This phenomenon had also been discovered by the experimental studies of Zhu et al. [46], they found that with the increasing of hotspot temperature, more Li was grown on the hotspot with respect to the surrounding lower-temperature areas (Fig. 6m). In conclusion, the temperature has a dual effect on dendrite growth.
Figure 6
 Figure 6. Effect of temperature on lithium electrodeposition morphology: (a–c) 283 K, (d–f) 303 K, (g–i) 323 K, (j) maximum dendrite growth height Hmax, (k) space utilization Us in various temperatures when qde, (l, m) SEM images of Li deposition morphology under different temperatures. Reprinted with permission [45, 46]. Copyright 2022, Wiley and 2019, Springer Nature.
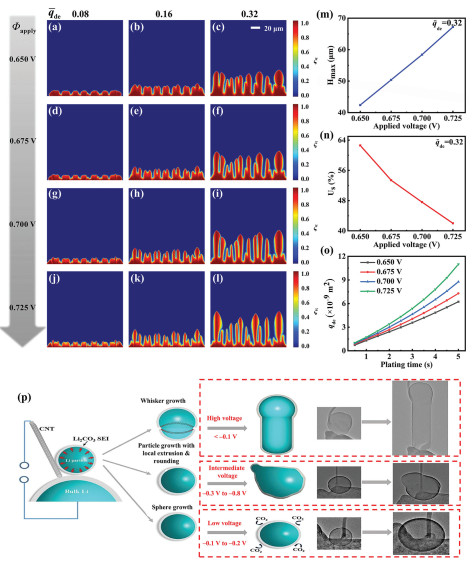
At last, the influence of applied voltage (Φapply =Φl –Φe), which is an important external influence factor and easy to regulate, on electrodeposition is explored, as shown in Figs. 7a–l. With the increase of Φapply, the electrodeposition morphology changes from columnar dendrites to needle-like dendrites. During the nucleation and initial dendrite growth stages (Figs. 7a, d, g and j), lower Φapply is helpful to form rounder and smoother nuclei, which is beneficial to columnar dendrites. With the increase of Φapply (0.650 V to 0.725 V), Hmax increases by 24.8 µm and Us decreases from 62.6% to 42% (Figs. 7m and n). Besides, it can be observed from that Fig. 7o the electrodeposition rate (electrodeposition amount per unit time) is faster under higher Φapply, which leads to larger ion concentration/potential gradient (Figs. S5 and S6 in Supporting information) and uneven lithium deposition. The simulation results are in good agreement with the publications of Yang et al. [47]. They reported in situ observations of Li deposition under various Φapply (Fig. 7p), with the decrease of Φapply, the electrodeposition morphology changes from Li whiskers to columnar/spherical dendrites.
Figure 7
 Figure 7. Effect of applied voltage on lithium electrodeposition morphology: (a–c) 0.650 V, (d–f) 0.675 V, (g–i) 0.700 V, (j–l) 0.725 V, (m) maximum dendrite height Hmax, (n) space utilization Us in four applied voltages when qde, (o) evolution of the electrodeposition amout with time at various applied voltages, and (p) schematic of three different modes of Li growth under various applied voltages and the corresponding TEM images. Reprinted with permission [47]. Copyright 2021, Elsevier.
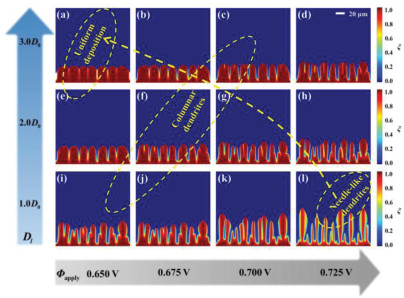
Here we also explored the synergistic effect of applied voltage and D/jr, 0/Cl/T, the results are shown in Fig. 8 and Figs. S7-S9 (Supporting information). Among them, the junction of Φapply and Dl is more effective for dendrite suppression. With the decrease of Φapply (from 0.725 V to 0.650 V) and the increase of Dl (from 1.0D0 to 3.0D0), the electrodeposition morphology changes from needle-like dendrites to columnar dendrites and to uniform deposition (Fig. 8). This is because under lower Φapply, the electrodeposition reaction rate is slower, which will reduces the ion consumption rate as well as the ion concentration gradient. Meanwhile, with the increase of Dl, the consumed ions will be replenished quickly and promote more homogeneous ion distribution. These simulation results are beneficial to the actual regulation of dendrite and the synergistic effects of the above factors are waiting for experimental verification.
Figure 8
 Figure 8. Synergistic effect of applied voltage and diffusion coefficient on lithium electrodeposition morphology when qde: (a) (0.650 V, 3.0D0), (b) (0.675 V, 3.0D0), (c) (0.700 V, 3.0D0), (d) (0.725 V, 3.0D0), (e) (0.650 V, 2.0D0), (f) (0.675 V, 2.0D0), (g) (0.700 V, 2.0D0), (h) (0.725 V, 2.0D0), (i) (0.650 V, 1.0D0), (j) (0.675 V, 1.0D0), (k) (0.700 V, 1.0D0), (l) (0.725 V, 1.0D0). The dashed lines mark various dendrite morphologies.
In this paper, we incorporate the dependent relationship among Dr, 0, Cl and Φapply into the electrochemical phase-field model to capture their synergistic effects on electrodeposition morphologies. The present phase-field simulation is closer to the practical electrodeposition process and provides rational guidance for designing high safety lithium-based batteries. There exist several promising extensions of this study. For example, three-dimensional electrodeposition under porous separator or composite solid electrolyte can be studied by extending this phase-field model/code so as to be closer to the realistic process. Moreover, the lithium stripping process during high current discharge, which is also important and will reshape the electrode surface topography, should be introduced into the simulations of the dendritic growth dynamics.
Declaration of competing interest
The authors declare that they have no known competing financial interests or personal relationships that could have appeared to influence the work reported in this paper.
Acknowledgments
This work was supported by the National Natural Science Foundation of China (Nos. 52102280, U2030206, 11874254, 51622207), Shanghai Pujiang Program (No. 2019PJD016), Foundation of China Academy of Engineering Physics-Key Laboratory of Neutron Physics (No. 2019BB07), and Scientific Research Project of Zhijiang Laboratory (No. 2021PE0AC02). It was also supported by funding from King Abdullah University of Science and Technology (KAUST).
Supplementary materials
Supplementary material associated with this article can be found, in the online version, at doi:
10.1016/j.cclet.2022.107993 .
-
-
[1]
X.B. Cheng, R. Zhang, C.Z. Zhao, et al., Chem. Rev. 117 (2017) 10403-10473. doi: 10.1021/acs.chemrev.7b00115
-
[2]
R. Zhang, X. Chen, X. Shen, et al., Joule 2 (2018) 764-777. doi: 10.1016/j.joule.2018.02.001
-
[3]
L. Fan, H. L. Zhuang, W. Zhang, et al., Adv. Energy Mater. 8 (2018) 1703360. doi: 10.1002/aenm.201703360
-
[4]
J. Cui, T.G. Zhan, K.D. Zhang, et al., Chin. Chem. Lett. 28 (2017) 2171-2179. doi: 10.1016/j.cclet.2017.11.039
-
[5]
F. Ding, W. Xu, G. L. Graff, et al., J. Am. Chem. Soc. 135 (2013) 4450-4456. doi: 10.1021/ja312241y
-
[6]
M. D. Tikekar, S. Choudhury, Z. Tu, et al., Nat. Energy 1 (2016) 1-7.
-
[7]
S. Zhang, B. Cheng, Y. Fang, et al., Chin. Chem. Lett. 33 (2022) 3951-3954. doi: 10.1016/j.cclet.2021.11.024
-
[8]
H. Lee, X. Ren, C. Niu, et al., Adv. Funct. Mater. 27 (2017) 1704391. doi: 10.1002/adfm.201704391
-
[9]
K. Yan, J. Wang, S. Zhao, et al., Angew. Chem. 131 (2019) 11486-11490. doi: 10.1002/ange.201905251
-
[10]
L. Zhang, T. Yang, C. Du, et al., Nat. Nanotechnol. 15 (2020) 94-98. doi: 10.1038/s41565-019-0604-x
-
[11]
L. Liang, Y. Qi, F. Xue, et al., Phys. Rev. E 86 (2012) 051609. doi: 10.1103/PhysRevE.86.051609
-
[12]
L. Liang, L. Q. Chen, Appl. Phys. Lett. 105 (2014) 1457-1459.
-
[13]
Q. Wang, G. Zhang, Y. Li, et al., npj Comput. Mater. 6 (2020) 1-8. doi: 10.1038/s41524-019-0267-z
-
[14]
K. Wang, Y. Xiao, P. Pei, et al., J. Electrochem. Soc. 166 (2019) D389. doi: 10.1149/2.0541910jes
-
[15]
C. Lin, K. Liu, H. Ruan, et al., Mater. Design 213 (2022) 110322. doi: 10.1016/j.matdes.2021.110322
-
[16]
Y. Liu, X. Xu, M. Sadd, et al., Adv. Sci. 8 (2021) 2003301. doi: 10.1002/advs.202003301
-
[17]
Z. Liu, Y. Li, Y. Ji, et al., Cell Rep. Phys. Sci. 2 (2021) 100294. doi: 10.1016/j.xcrp.2020.100294
-
[18]
L. Gao, Z. Guo, Comput. Mater. Sci. 183 (2020) 109919. doi: 10.1016/j.commatsci.2020.109919
-
[19]
X. Xu, Y. Liu, J. Y. Hwang, et al., Adv. Energy Mater. 10 (2020) 2002390. doi: 10.1002/aenm.202002390
-
[20]
Z. Hong, V. Viswanathan, ACS Energy Lett. 4 (2019) 1012-1019. doi: 10.1021/acsenergylett.9b00433
-
[21]
H. Yan, Y. Bie, X. Cui, et al., Energy Convers. Manage. 161 (2018) 193-204. doi: 10.1016/j.enconman.2018.02.002
-
[22]
Y. Shibuta, Y. Okajima, T. Suzuki, Sci. Technol. Adv. Mater. 8 (2007) 511. doi: 10.1016/j.stam.2007.08.001
-
[23]
L. Chen, H. W. Zhang, L. Y. Liang, et al., J. Power Sources 300 (2015) 376-385. doi: 10.1016/j.jpowsour.2015.09.055
-
[24]
H. Jing, H. Xing, X. Dong, et al., J. Electrochem. Soc. 169 (2022) 032511. doi: 10.1149/1945-7111/ac5fed
-
[25]
R. Zhang, X. Shen, H.T. Ju, et al., J. Energy Chem. 73 (2022) 285-291. doi: 10.1016/j.jechem.2022.06.010
-
[26]
L. Vitos, A. Ruban, H. L. Skriver, et al., Surf. Sci. 411 (1998) 186-202. doi: 10.1016/S0039-6028(98)00363-X
-
[27]
L. O. Valøen, J. N. Reimers, J. Electrochem. Soc. 152 (2005) A882. doi: 10.1149/1.1872737
-
[28]
S. Yao, X. Kan, R. Zhou, et al., New J. Chem. 45 (2021) 1838-1852. doi: 10.1039/d0nj05528j
-
[29]
X. Shen, R. Zhang, P. Shi, et al., Adv. Energy Mater. 11 (2021) 2003416. doi: 10.1002/aenm.202003416
-
[30]
M. Hess, J. Electrochem. Soc. 165 (2018) A323. doi: 10.1149/2.0701802jes
-
[31]
Z. Hong, V. Viswanathan, ACS Energy Lett. 3 (2018) 1737-1743. doi: 10.1021/acsenergylett.8b01009
-
[32]
Q. Li, S. Zhu, Y. Lu, Adv. Funct. Mater. 27 (2017) 1606422. doi: 10.1002/adfm.201606422
-
[33]
H. Sano, H. Sakaebe, H. Senoh, et al., J. Electrochem. Soc. 161 (2014) A1236. doi: 10.1149/2.0331409jes
-
[34]
M. Saito, T. Fujinami, S. Yamada, et al., J. Electrochem. Soc. 164 (2017) A2872. doi: 10.1149/2.0151713jes
-
[35]
J. Peng, L.N. Wu, J.X. Lin, et al., J. Mater. Chem. A 7 (2019) 19565-19572. doi: 10.1039/c9ta07165b
-
[36]
Y. Li, G. Zhang, B. Chen, et al., Chin. Chem. Lett. 33 (2022) 3287-3290. doi: 10.1016/j.cclet.2022.03.065
-
[37]
F. Shi, A. Pei, A. Vailionis, et al., Proc. Natl. Acad. Sci. U. S. A. 114 (2017) 12138-12143. doi: 10.1073/pnas.1708224114
-
[38]
J. Wang, W. Huang, A. Pei, et al., Nat. Energy 4 (2019) 664-670. doi: 10.1038/s41560-019-0413-3
-
[39]
S. H. Yu, X. Huang, J. D. Brock, et al., J. Am. Chem. Soc. 141 (2019) 8441-8449. doi: 10.1021/jacs.8b13297
-
[40]
J. Landesfeind, H. A. Gasteiger, J. Electrochem. Soc. 166 (2019) A3079. doi: 10.1149/2.0571912jes
-
[41]
G. Liu, W. Lu, J. Electrochem. Soc. 164 (2017) A1826. doi: 10.1149/2.0381709jes
-
[42]
P. Zhang, J. Zhu, M. Wang, et al., Electrochem. Commun. 87 (2018) 27-30. doi: 10.5539/jsd.v11n6p27
-
[43]
M. Smart, B. Ratnakumar, J. Electrochem. Soc. 158 (2011) A379. doi: 10.1149/1.3544439
-
[44]
J. Jeon, G. H. Yoon, T. Vegge, et al., ACS Appl. Mater. Inter. 14 (2022) 15275-15286. doi: 10.1021/acsami.2c00900
-
[45]
L. Sheng, Y. Wu, J. Tian, et al., Energy Environ. Mater. (2022), doi: 10.1002/eem2.12266.
-
[46]
Y. Zhu, J. Xie, A. Pei, et al., Nat. Commun. 10 (2019) 1-7. doi: 10.3390/w11102067
-
[47]
T. Yang, H. Li, Y. Tang, et al., Sci. Bull. 66 (2021) 1754-1763. doi: 10.1016/j.scib.2021.05.002
-
[1]
-
Figure 1 Schematic and validation of the electrochemical phase-field model. (a) Electrodeposition process in half-cell system. Simulated results: (b–e) Phase-field variable, (f–i) Li+ concentration, and (j–m) electric potential.
Figure 2 Effect of diffusion coefficient on lithium electrodeposition: (a–c) 1.0D0, (d–f) 2.0D0, (g–i) 3.0D0, (j) maximum dendrite growth height Hmax, (k) space utilization Us versus diffusion coefficients when qde, and (l–n) SEM images of Li deposition morphology under various electrolytes with increasing diffusion coefficients. Reprinted with permission [35]. Copyright 2019, Royal Society of Chemistry.
Figure 3 Effect of exchange current density on lithium electrodeposition morphology: (a–c) 0.25j0, (d–f) 0.5j0, (g–i) 1.0j0, (j–l) 2.0j0, (m) maximum dendrite growth height Hmax, (n) space utilization Us in four exchange current densities when qde, and (o–s) SEM images of Li deposition morphology under decreasing exchange current densities. Reprinted with permission [37]. Copyright 2017, National Academy of Sciences.
Figure 4 Synergistic effect of exchange current density and diffusion coefficient on Li electrodeposition morphology when qde: (a) (0.25j0, 3.0D0), (b) (0.5j0, 3.0D0), (c) (1.0j0, 3.0D0), (d) (2.0j0, 3.0D0), (e) (0.25j0, 2.0D0), (f) (0.5j0, 2.0D0), (g) (1.0j0, 2.0D0), (h) (2.0j0, 2.0D0), (i) (0.25j0, 1.0D0), (j) (0.5j0, 1.0D0), (k) (1.0j0, 1.0D0), (l) (2.0j0, 1.0D0). The dashed lines mark various dendrite morphologies.
Figure 5 Effect of electrolyte concentration on lithium electrodeposition morphology: (a–c) 0.5 mol/L, (d–f) 1.0 mol/L, (g–i) 2.0 mol/L, (j) maximum dendrite growth Hmax, (k) space utilization Us when qde, and (l, m) SEM images of Li deposition morphology of LiFSI-DOL. Reprinted with permission [42]. Copyright 2018, Elsevier.
Figure 6 Effect of temperature on lithium electrodeposition morphology: (a–c) 283 K, (d–f) 303 K, (g–i) 323 K, (j) maximum dendrite growth height Hmax, (k) space utilization Us in various temperatures when qde, (l, m) SEM images of Li deposition morphology under different temperatures. Reprinted with permission [45, 46]. Copyright 2022, Wiley and 2019, Springer Nature.
Figure 7 Effect of applied voltage on lithium electrodeposition morphology: (a–c) 0.650 V, (d–f) 0.675 V, (g–i) 0.700 V, (j–l) 0.725 V, (m) maximum dendrite height Hmax, (n) space utilization Us in four applied voltages when qde, (o) evolution of the electrodeposition amout with time at various applied voltages, and (p) schematic of three different modes of Li growth under various applied voltages and the corresponding TEM images. Reprinted with permission [47]. Copyright 2021, Elsevier.
Figure 8 Synergistic effect of applied voltage and diffusion coefficient on lithium electrodeposition morphology when qde: (a) (0.650 V, 3.0D0), (b) (0.675 V, 3.0D0), (c) (0.700 V, 3.0D0), (d) (0.725 V, 3.0D0), (e) (0.650 V, 2.0D0), (f) (0.675 V, 2.0D0), (g) (0.700 V, 2.0D0), (h) (0.725 V, 2.0D0), (i) (0.650 V, 1.0D0), (j) (0.675 V, 1.0D0), (k) (0.700 V, 1.0D0), (l) (0.725 V, 1.0D0). The dashed lines mark various dendrite morphologies.
-

 DownLoad:


 下载:
下载:


 扫一扫看文章
计量
- PDF下载量: 0
- 文章访问数: 2300
- HTML全文浏览量: 240
