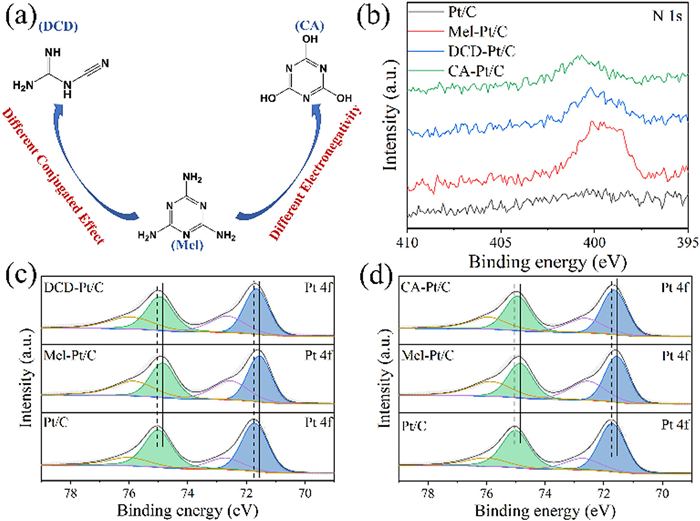
Figure 1.
(a) The scheme of three organic compounds. (b) N 1s spectra; Pt 1s spectra of Pt/C, Mel-Pt/C, (c) DCD-Pt/C and (d) CA-Pt/C.
Surface decoration prompting the decontamination of active sites in high-temperature proton exchange membrane fuel cells
Jiaqi Lin , Pupu Yang , Yimin Jiang , Shiqian Du , Dongcai Zhang , Gen Huang , Jinbo Wang , Jun Wang , Qie Liu , Miaoyu Li , Yujie Wu , Peng Long , Yangyang Zhou , Li Tao , Shuangyin Wang

Proton exchange membrane fuel cells with the merits of high energy capacities and low environmental impact play crucial roles in future energy systems [1]. The performances of proton exchange membrane fuel cells (PEMFCs) are restricted by the activity of electrocatalysts and the operating conditions [2]. The operating conditions exert great influence on the performances, such as the voltage losses resulting from the heterogeneous distribution of ionomers and rapid degradation of electrocatalysts due to the switching voltage during the operating process [3–8]. Therefore, it is quite significant to design and develop electrocatalysts for the application of PEMFCs, targeting the operating characteristics.
High-temperature PEMFCs (HT-PEMFCs), working at 120–300 ℃ and employing phosphoric acid (PA)-doped polymers as proton exchange membranes, are limited by their particular operating conditions because PA, used as the proton carriers, not only can conduct protons that are involved in oxygen reduction reaction (ORR) but also can be adsorbed on Pt surface, block active sites and affect the electronic structure of Pt detrimentally, leading to poor catalytic activity [9–12]. The adverse effect can be weaken by alloying Pt with transition metals, because this method can reduce the adsorption energy between Pt and PA and enhance electrocatalytic performances [13]. However, as shown in Fig. S1 (Supporting information), PA still need to be adsorbed on the Pt surface to transport protons, so the alloying strategy only relieves the blockage of PA to a modest extent but can not solve the problem completely. In addition, using promoters is able to expose active sites. Recently, our group employed SiO2 and FeP as the promoters which have stronger adsorption of PA compared with Pt, so PA incline to be adsorbed by the promoters, avoiding the blockage effect on Pt surface, but the poor conductivity of the promoters can generate greater internal resistance and reduce the cell output [14,15]. The membranes, used in HT-PEMFCs, have a lot of basic groups that have a strong affinity with PA and enable to adsorb or store PA [16,17]. Therefore, inspired by the mechanism, decorating organic compounds containing basic groups on Pt surface may also induce PA to transfer from Pt to organic compounds (Fig. S2 in Supporting information) via the strong affinity between organic compounds with PA and the third body effect that the adsorption of PA is selectively prevented but oxygen is allowed to be activated on Pt surface, decontaminating active sites and increasing electrocatalytic activity [18,19]. Apart from it, basic groups have lone-pair electrons. When these organic compounds are decorated on Pt, electrons would transfer to Pt, altering electronic density and regulating catalytic activity [20]. It is also worth noting that various organic compounds have diverse electronic structures and thus result in different interaction strength and ORR activity, so the influence of organic structure has to be considered [21,22].
In this work, in order to induce the adsorption of proton carriers transferring, three organic compounds are chosen to decorate Pt, dicyandiamide (DCD), melamine (Mel) and cyanuric acid (CA). It was found that three organic compounds all have affinity with PA and are able to induce the adsorption of PA to transfer from Pt surface to Mel, DCD and CA. Additionally, compared with DCD and CA, Mel has the strongest interaction strength with Pt because of the larger conjunction area and the smaller negativity of ligating atoms, which makes Mel have more free electrons and easier to give out electrons. Therefore, Pt/C electrocatalyst decorated by Mel (Mel-Pt/C) has higher coverage of ligands. Due to electrons transferring from Mel to Pt, Mel-Pt/C shows excellent ORR activity and has marvelous resistance to PA under the PA-rich condition because the adsorbed Mel results in the third body effect and induces the adsorption of PA to transfer from Pt to Mel, decontaminating active sites. Distribution of relaxation times (DRT) analysis results show that the organic compounds on Pt surface will hinder the proton transfer process, but they exert a larger amount of positive effect on ORR process that determines performance of HT-PEMFCs to a greater extent. Impressively, when applied to HT-PEMFCs, Mel-Pt/C exhibits outstanding peak power density (629 mW/cm2), exceeding commercial Pt/C (437 mW/cm2), DCD-Pt/C (539 mW/cm2) and CA-Pt/C (511 mW/cm2) and deliver a current density of 0.2 A cm−2 at a voltage of above 0.65 V for at least 50 h. This work provides a versatile approach to decontaminate active sites and may promote the development of HT-PEMFCs in the future.
The synthesis details of Pt/C, Pt/C decorated by DCD, Mel and CA (DCD-Pt/C, Mel-Pt/C and CA-Pt/C) are given in supporting information. Fig. 1a is the image of three organic compounds, where Mel has larger conjugated system compared with DCD and the ligating atoms of Mel is smaller than that of CA. Fig. S3 (Supporting information) is powder XRD pattern of Pt/C, demonstrating that the catalyst has been synthesized successfully. As shown in Figs. S4a and b (Supporting information), Pt nanoparticles distribute on carbon support evenly with a lattice spacing of 0.227 nm, corresponding to Pt (111) and the average size of Pt nanoparticles is 4.7 nm. Fig. S5 (Supporting information) shows that the three organic compounds can be stable under the potential window of real fuel cells because there are no additional redox peaks. Additionally, the pH values of 0.01 mol/L H3PO4, CA, DCD and Mel aqueous solutions are 3.10, 5.68, 6.80 and 7.25, respectively, indicating that CA, DCD and Mel are basic compared with H3PO4 and could spontaneously bind with PA to conduct proton in HT-PEMFCs (Fig. S6 in Supporting information). Fig. 1b is N 1s spectra, implying that DCD, Mel and CA have been decorated on Pt surface successfully [23]. Fig. 1c depicts Pt 4f spectra of DCD-Pt/C, Mel-Pt/C and Pt/C, from which the peaks of 74.89 and 71.55 eV are assigned to the metal Pt 4f5/2 and Pt 4f7/2 of Mel-Pt/C respectively, and the peaks at 76.00 eV (Pt 4f5/2) and 72.50 eV (Pt 4f7/2) are attributed to Pt2+. Compared with Pt/C, DCD-Pt/C and Mel-Pt/C shift to lower binding energy about 0.11 eV and 0.20 eV. It indicates that electrons transfer from organic compounds to Pt, which enables to weaken the adsorption of PA and ORR intermediates, and thus improve their ORR activity. It is worth mentioning that the shift of DCD-Pt/C is smaller than that of Mel-Pt/C, verifying that Mel has stonger interaction strength with Pt, stemming from its larger conjunction area and more free electrons [21]. Mel-Pt/C also has the most negative shift (Fig. 1d) among Pt/C, Mel-Pt/C and CA-Pt/C, demonstrating that because of the smaller electronegativity of ligating atoms that can give out electrons more easily, Mel has firmer interaction with Pt compared to CA.
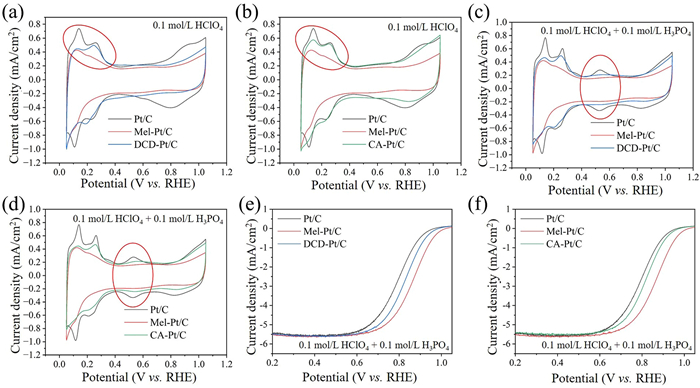
In order to further explore the influence of decoration on Pt surface, the as-prepared electrocatalysts were investigated in N2-saturated 0.1 mol/L HClO4 and 0.1 mol/L HClO4 + 0.1 mol/L H3PO4 solution via cyclic voltammogram (CV). It was reported that the range of 0.05–0.40 V was known as underpotential-deposited of hydrogen (H upd, H+ + e− ⇋ Hupd), the region between 0.40–0.80 V was the pseudocapacitance region, and in 0.80–1.05 V the oxidation of Pt took place, where a large amount of oxygen-containing species could be generated on the surface of Pt [24,25]. In Fig. 2a, the H upd region of Mel-Pt/C and DCD-Pt/C are both smaller than that of Pt/C, demonstrating that two organic compounds are decorated on Pt surface successfully and the region of Mel-Pt/C is the smallest, indicating that the decoration amount of Mel is higher due to the stonger interaction strength with Pt [26]. Also, the same conclusion can be obtained from Fig. 2b, where the H upd of Mel-Pt/C is the smallest. In 0.1 mol/L HClO4 + 0.1 mol/L H3PO4 solution, a couple of redox peaks in double electrode layer region (0.4–0.75 V) are regarded as the adsorption of phosphate ions [14]. When these electrocatalysts are applied to 0.1 mol/L HClO4 + 0.1 mol/L H3PO4 solution, the redox peaks of DCD-Pt/C (Fig. 2c) and CA-Pt/C (Fig. 2d) are relieved only modestly, whereas the redox peaks of Mel-Pt/C disappear almost completely relative to Pt/C, which indicates that Mel-Pt/C has the strongest resistance to PA because the decoration amount of Mel is the most. The decorated organic compounds can cause the third body effect, inhibiting the adsorption of PA on Pt surface [23]. Next, CO stripping voltammetry was used to analyze Pt-OHad formation on Pt surface decorated with organic compounds because it has been reported that CO oxidation can be facilitated by neighboring Pt-OHad. From Figs. S7a and b (Supporting information), the peak potential for CO stripping of Mel-Pt/C is more positive than that of Pt/C, DCD-Pt/C and CA-Pt/C and the same results can be obtained in 0.1 mol/L HClO4 and 0.1 mol/L HClO4 + 0.1 mol/L H3PO4 solution (Figs. S8a and b in Supporting information). The result indicates that the decoration of Mel is capable of suppressing the formation of OHad on Pt surface to a greater extend and means that Mel-Pt/C may exhibit the highest ORR activity [27]. After that, the effect of these organic compounds on Pt performance was investigated in O2-saturated 0.1 mol/L HClO4 and 0.1 mol/L HClO4 + 0.1 mol/L H3PO4 solution via linear sweep voltammetry (LSV). As shown in Figs. S9a and b (Supporting information), the half-wave potential (E1/2) of Mel-Pt/C, DCD-Pt/C and CA-Pt/C is 0.900, 0.879 and 0.870 V (versus RHE) that is superior to Pt/C (0.865 V), meaning that electrons transferring from organic compounds to Pt can enhance the electron density of Pt and thus improve ORR activity. Additionally, because of the strongest interaction between Mel and Pt, Mel-Pt/C has the largest increase of ORR activity (35 mV), surpassing DCD-Pt/C (14 mV) and CA-Pt/C (5 mV). When these electrocatalysts are analyzed in O2-saturated 0.1 mol/L HClO4 + 0.1 mol/L H3PO4 solution (Figs. 2e and f), the improvement of ORR activity is even more dramatic as a result of the decontamination of active sites. Likewise, Mel-Pt/C has the largest enhancement of ORR activity (71 mV), exceeding DCD-Pt/C (35 mV) and CA-Pt/C (24 mV). Deeper insights into their ORR activity could be obtained through comparing their MA and SA values at 0.9 V. The ECSA of these electrocatalysts was investigated by integrating CO stripping curves. The ECSA of Pt/C, Mel-Pt/C, DCD-Pt/C and CA-Pt/C were 82.5, 40.3, 45.8 and 60.6 m2/gPt in 0.1 mol/L HClO4 solution, respectively. As shown in Figs. S10a and b (Supporting information), Mel-Pt/C has the highest mass activity (MA) and specific activity (SA) in 0.1 mol/L HClO4 solution and the MA and SA are 1.68 times and 3.45 times higher than that of Pt/C. In addition, DCD-Pt/C and CA-Pt/C also have pretty higher MA and SA. The former is 1.30 times and 2.37 times higher and the latter is 1.16 times and 1.53 times higher than that of Pt/C. Similarly, the enhancement of electrocatalysts decorated by organic compounds is larger in 0.1 mol/L HClO4 + 0.1 mol/L H3PO4 solution due to the stronger tolerance to PA (Figs. S11a and b in Supporting information).
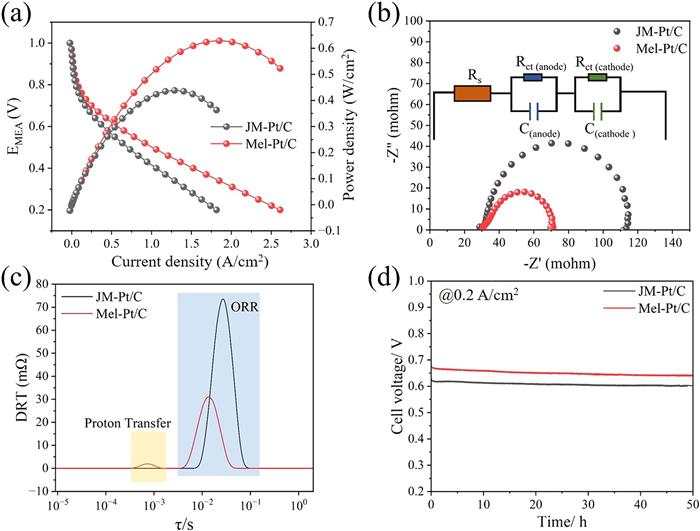
So as to investigate the effectiveness of this method in HT-PEMFCs, firstly we chose Mel-Pt/C as cathode, commercial Pt/C as anode, and PA doped poly(ethersulfone)-poly(vinylpyrrolidone) (PES-PVP) membrane as PEM to fabricate membrane electrodes assembly (MEA) [28]. As a comparison, the anode and cathode of HT-PEMFCs were loaded by commercial Pt/C. The Pt loading is controlled at 1.0 mgPt/cm2 on cathodic and anodic side, respectively. As shown in Fig. S12 (Supporting information), the H upd region of Mel-Pt/C, DCD-Pt/C and CA-Pt/C remain almost unchanged after heat treatment, and there are no obvious PA adsorption signals in the double layer region, indicating that Mel, DCD and CA can exist stably at the operating temperature of HT-PEMFCs. Fig. 3a presents the H2-O2 fuel cell polarization curves (I-V) of the Mel-Pt/C and commercial Pt/C at 120 ℃ under ambient pressure, in which the peak power density of Mel-Pt/C is up to 629 mW/cm2, suppressing that of commercial Pt/C (437 mW/cm2). The better activity can be also verified by electrochemical impedance spectra (EIS) in Fig. 3b. The inset is the corresponding equivalent circuit, where Rs is a symbol of ohmic resistance that originate from the contact between the components in HT-PEMFCs, C(cathode) and C(anode) mean the capacitance of the anode HOR and cathode ORR respectively and Rct (cathode) and Rct (anode) represent the charge transfer resistance of the anode HOR and cathode ORR respectively [29]. As shown in Fig. S13 (Supporting information), the resistance (R) of Mel-Pt/C and commercial Pt/C is 32.2 and 31.2 mohm, meaning the conditions of fuel cells were almost identical in both tests. More importantly, the charge transfer resistance (Rct) is 39.2 mohm for Mel-Pt/C and 79.3 mohm for commercial Pt/C, indicating that the Mel-Pt/C exhibits better performance in HT-PEMFCs. In order to further clarify the effect of Mel on performance, distribution of relaxation times (DRT) analysis was employed to find out more information from the observed features of the EIS data in HT-PEMFCs, and it was beneficial for us to identify kinetic processes occurring on different time scales. It was reported that the mass transfer process appeared at long relaxation time region, the peaks at medium relaxation time region corresponded to cathodic ORR process, and the short relaxation time region was the proton transfer process and anodic HOR process [30,31]. As depicted in Fig. 3c, HT-PEMFCs with Mel-Pt/C cathode perform similarly with commercial Pt/C cathode in the mass transfer region, while in ORR process region Mel-Pt/C has lower resistance and shorter relaxation time, meaning that Mel-Pt/C has better activity in HT-PEMFCs. The result is consistent with the above. It is worth noting that Mel-Pt/C has a peak in the short relaxation time region. Considering that the Pt loading of the two fuel cells in the anode is almost equal, and the loading of 1 mgPt−1 has dramatically exceeded the amount of catalyst that ensures the smooth occurrence of HOR, the HOR reaction kinetics of the two fuel cells should be consistent. Therefore, the peak in this region is attributed to proton transfer, indicating that in HT-PEMFCs, the presence of Mel on the surface of Pt will hinder the proton transfer process. The main reason is that PA is blocked by Mel and cannot be adsorbed on Pt surface. Instead, PA preferentially binds with Mel, resulting in a longer proton conduction distance. Even though Mel exerts negative influence on proton transfer process, it delivers a larger amount of positive effect on ORR process that determines performance of HT-PEMFCs to a greater extent. Therefore, Mel-Pt/C has higher power density. In addition, the stability test of both Mel-Pt/C and commercial Pt/C shows negligible change after 50 h under the H2-O2 condition, delivering a current density of 0.2 A/cm2 at 0.65 and 0.60 V, respectively (Fig. 3d).
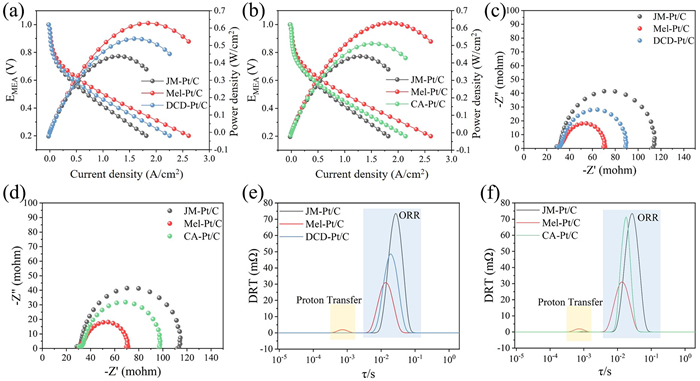
The activity of DCD-Pt/C and CA-Pt/C in HT-PEMFCs was also measured. As shown in Figs. 4a and b, the peak power density of DCD-Pt/C and CA-Pt/C reaches 539 mW/cm2 and 511 mW/cm2 respectively, superior to commercial Pt/C (437 mW/cm2) but inferior to Mel-Pt/C (629 mW/cm2). As depicted in Figs. 4c and d, EIS results show that the Rct of DCD-Pt/C and CA-Pt/C are 58.6 and 65.2 mohm, both smaller than that of commercial Pt/C (79.3 mohm) but larger than that of Mel-Pt/C (39.2 mohm). Furthermore, DRT was employed to analyze the EIS data of DCD-Pt/C and CA-Pt/C. In Figs. 4e and f, in ORR region, the resistance of DCD-Pt/C and CA-Pt/C are both superior and inferior than that of Mel-Pt/C and commercial Pt/C, which is consistent with the above results. However, the proton transfer resistance of both DCD-Pt/C and CA-Pt/C is lower than that of Mel-Pt/C, indicating that DCD-Pt/C and CA-Pt/C have faster proton conduction rates than Mel-Pt/C.
As mentioned above, the organic compounds on Pt surface can hinder proton transfer process. In order to explore how these organic compounds influence the proton conduction, we used PA solution to treat Mel, DCD and CA at the temperature of 90 ℃ for 1 h, and then used deionized water to wash them for several times. As shown in Fig. 5a, the N-H stretching vibration of NH2 in Mel shift positively from 3126 cm−1 to 3151 cm−1 and the vibration signal (1245 cm−1) of P=O appear in PA-Mel, meaning that Mel is protonated and thus can adsorb PA to conduct protons [32]. In terms of DCD and CA, the vibration adsorptions almost have no changes (Figs. 5b and c). These results demonstrate that Mel has the strongest affinity with PA. It was reported that melamine phosphate, produced by the reaction of Mel and PA, has strong stability and is mainly used as fireproof materials [33,34]. We also simulated the binding energy between PA and three organic compounds (Fig. S14 in Supporting information), and energy parament of these species are given in Table S1 (Supporting information). As shown in Fig. 5d, Mel, DCD and CA have affinity with PA, indicating that three organic compounds can induce the adsorption of PA transferring from Pt to their basic groups when decorated on Pt surface. Furthermore, Mel has stronger affinity with PA compared with DCD and CA. The result also confirms that Mel binds more strongly to PA and has greater proton conductivity [35]. However, the proton conductivity of Mel-Pt/C is worse than that of DCD-Pt/C and CA-Pt/C. It may be because the decoration amount of DCD and CA is small, which leads to the fact that a lot of PA are adsorbed on Pt surface, making the average proton transfer distance of DCD-Pt/C and CA-Pt/C shorter than that of Mel-Pt/C.

In summary, Pt/C decorated with basic organic compounds can not only improve the intrinsic activity of ORR, but also induce PA to transfer from Pt to organic compounds, getting rid of adverse effect of PA. In addition, when it comes to the structure of organic compounds, the organic compounds with the larger conjugated system and the smaller the electronegativity of ligating atoms would have the greater interaction with Pt, which causes larger decoration amount on Pt surface, more excellent ORR activity and ability to decontaminate active sites. Therefore, when Mel-Pt/C is applied to HT-PEMFCs, it shows a maximum output power of 629 mW/cm2 with Pt loading of 1.0 mgPt/cm2 under the atmosphere of anhydrous H2-O2 atmosphere, exceeding commercial Pt/C (437 mW/cm2), DCD-Pt/C (539 mW/cm2) and CA-Pt/C (511 mW/cm2), and delivers a current density of 0.2 A/cm2 at a voltage of above 0.65 V for at least 50 h. This work constructs progressive electrocatalysts with fantastic performance and provides a potential methodology to nicely construct highly marvelous resistance to PA for HT-PEMFCs.
The authors declare that they have no known competing financial interests or personal relationships that could have appeared to influence the work reported in this paper.
This work was supported by the National Key R&D Program of China (No. 2021YFA1500900), the National Natural Science Foundation of China (Nos. 22102053, 21825201, 22172047 and U19A2017) and the Provincial Natural Science Foundation of Hunan (Nos. 2019GK2031, 2016TP1009, 2020JJ5045 and 2021JJ30089), the Science and Technology Innovation Program of Hunan Province, China (Nos. 2020RC2020, 2022RC1036), Shenzhen Science and Technology Program (No. JCYJ20210324122209025), Basic and Applied Basic Research Foundation of Guangdong Province -Regional joint fund project (No. 2021B1515120024), Natural Science Foundation of Chongqing (No. cstc2021jcyj-msxmX0770), the Science Funds of the Education Office of Jiangxi Province (No. GJJ2201324), the Science Funds of Jiangxi Province (No. 20224BAB213018), the China Postdoctoral Science Foundation (Certificate No. 2023M741121).
Supplementary material associated with this article can be found, in the online version, at doi:
H.T. Wang, S.C. Xu, C. Tsai, et al., Science 354 (2016) 1031–1036. doi: 10.1126/science.aaf7680
V.R. Stamenkovic, D. Strmcnik, P.P. Lopes, et al., Nat. Mater. 16 (2017) 57–69. doi: 10.1038/nmat4738
S. Ott, A. Orfanidi, H. Schmies, et al., Nat. Mater. 19 (2020) 77–85. doi: 10.1038/s41563-019-0487-0
J. Lin, J. Wang, Y. Wu, et al., Chem. Asian J. 18 (2023) e202300137. doi: 10.1002/asia.202300137
H. Liu, Q. Liu, Y. Wang, et al., Chin. Chem. Lett. 33 (2022) 683–692. doi: 10.1016/j.cclet.2021.07.038
Z. Zhu, Z. Li, J. Wang, et al., eScience 2 (2022) 445–452. doi: 10.1016/j.esci.2022.05.002
J. Ban, X. Wen, H. Xu, et al., Adv. Funct. Mater. 31 (2021) 2010472. doi: 10.1002/adfm.202010472
J. Ban, H. Xu, G. Cao, et al., Adv. Funct. Mater. 33 (2023) 2300623. doi: 10.1002/adfm.202300623
Y. Wu, X. Zhu, S. Du, et al., Proc. Natl. Acad. Sci. U. S. A. 120 (2023) e2300625120. doi: 10.1073/pnas.2300625120
R. Haider, Y.C. Wen, Z.F. Ma, et al., Chem. Soc. Rev. 50 (2021) 1138–1187. doi: 10.1039/D0CS00296H
A. Chandan, M. Hattenberger, A. El-kharouf, et al., J. Power Sources 231 (2013) 264–278. doi: 10.1016/j.jpowsour.2012.11.126
Y. Liu, W. Lehnert, H. Janssen, et al., J. Power Sources 311 (2016) 91–102. doi: 10.1016/j.jpowsour.2016.02.033
Q. He, B. Shyam, M. Nishijima, et al., J. Phys. Chem. C 117 (2013) 4877–4887. doi: 10.1021/jp309282n
G. Huang, Y. Li, S. Du, et al., Sci. China Chem. 64 (2021) 2203–2211. doi: 10.1007/s11426-021-1142-x
S. Du, Y. Li, X. Wu, et al., Adv. Funct. Mater. 32 (2021) 2106758.
S. Authayanun, K. Im-orb, A. Arpornwichanop, Chin. J. Catal. 36 (2015) 473–483. doi: 10.1016/S1872-2067(14)60272-2
Y.L. Ma, J.S. Wainright, M.H. Litt, et al., J. Electrochem. Soc. 151 (2004) A8–A16. doi: 10.1149/1.1630037
D. Strmcnik, M. Escudero-Escribano, K. Kodama, et al., Nat. Chem. 2 (2010) 880–885. doi: 10.1038/nchem.771
A. Cuesta, J. Am. Chem. Soc. 128 (2006) 13332–13333. doi: 10.1021/ja0644172
K. Liu, R. Qin, N. Zheng, J. Am. Chem. Soc. 143 (2021) 4483–4499. doi: 10.1021/jacs.0c13185
K. Miyabayashi, K. Ishihara, P. Joshi, et al., Electrocatalysis 9 (2018) 486–494. doi: 10.1007/s12678-018-0462-6
Z.Y. Zhou, X. Kang, Y. Song, et al., J. Phys. Chem. C 116 (2012) 10592–10598. doi: 10.1021/jp300199x
M. Zorko, P. Farinazzo Bergamo Dias Martins, J.G. Connell, et al., ACS Appl. Mater. Interfaces 13 (2021) 3369–3376. doi: 10.1021/acsami.0c18167
N.M. Markovic, H.A. Gasteiger, P.N. Ross Jr, J. Phys. Chem. C 99 (1995) 3411–3415. doi: 10.1021/j100011a001
J.X. Wang, N.M. Markovic, R.R. Adzic, J. Phys. Chem. B 108 (2004) 4127–4133. doi: 10.1021/jp037593v
F. Chen, S. Chen, A. Wang, et al., Nat. Catal. 6 (2023) 392–401. doi: 10.1038/s41929-023-00949-w
S.I. Yamazaki, M. Asahi, N. Taguchi, et al., ACS Catal. 10 (2020) 14567–14580. doi: 10.1021/acscatal.0c03124
J. Zhang, S. Lu, H. Zhu, et al., RSC Adv. 6 (2016) 86575–86585. doi: 10.1039/C6RA15093D
G. Huang, Y. Li, L. Tao, et al., Angew. Chem. Int. Ed. 62 (2023) e202215177. doi: 10.1002/anie.202215177
N. Bevilacqua, R.R. Gokhale, A. Serov, et al., ECS Trans. 86 (2018) 221. doi: 10.1149/08613.0221ecst
N. Bevilacqua, M.A. Schmid, R. Zeis, J. Power Sources 471 (2020) 228469. doi: 10.1016/j.jpowsour.2020.228469
Y. Chen, Q. Wang, Polym. Degrad. Stab. 91 (2006) 2003–2013. doi: 10.1016/j.polymdegradstab.2006.02.006
Y. Li, B. Xue, S. Wang, et al., ACS Appl. Polym. Mater. 2 (2020) 4455–4463. doi: 10.1021/acsapm.0c00578
D. Xu, H. Lu, Q. Huang, et al., RSC Adv. 8 (2018) 5034–5041. doi: 10.1039/C7RA12865G
P. Tao, Y. Dai, S. Chen, et al., J. Membr. Sci. 604 (2020) 118004. doi: 10.1016/j.memsci.2020.118004

Figure 1 (a) The scheme of three organic compounds. (b) N 1s spectra; Pt 1s spectra of Pt/C, Mel-Pt/C, (c) DCD-Pt/C and (d) CA-Pt/C.

Figure 2 Electrochemical performance. CV curves of Pt/C, Mel-Pt/C, (a) DCD-Pt/C and (b) CA-Pt/C in N2-saturated 0.1 mol/L HClO4 solution. CV curves of Pt/C, Mel-Pt/C, (c) DCD-Pt/C and (d) CA-Pt/C in N2-saturated 0.1 mol/L HClO4 + 0.1 mol/L H3PO4 solution. ORR polarization curves of Pt/C, Mel-Pt/C, (e) DCD-Pt/C and (f) CA-Pt/C in O2-saturated 0.1 mol/L HClO4 + 0.1 mol/L H3PO4 solution.

Figure 3 HT-PEMFCs performance. (a) Fuel cell polarization curves and corresponding power densities curves. (b) Nyquist plot of HT-PEMFCs. (c) DRT analysis of the HT-PEMFCs. (d) Stability test under the current density of 0.2 A/cm2.

Figure 4 Fuel cell polarization curves and corresponding power densities curves of Pt/C, Mel-Pt/C, (a) DCD-Pt/C and (b) CA-Pt/C. (c, d) Nyquist plot of HT-PEMFCs. (e, f) DRT analysis of the HT-PEMFCs.

 扫一扫看文章

扫一扫关注我们
 DownLoad:
 下载:
下载:
