Figure 1.
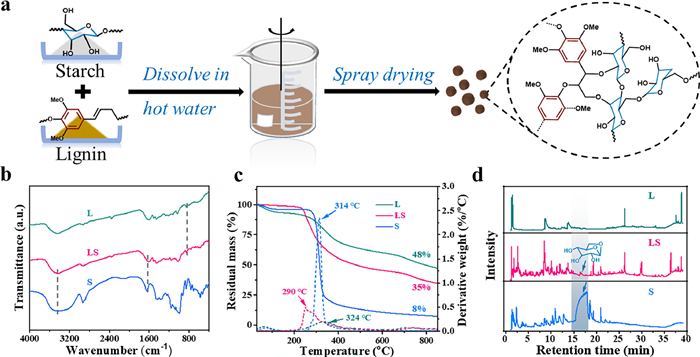
(a) Schematic diagram of precursor reconstitution. (b) FTIR spectra. (c) TG-DTG curves. (d) Py/GC–MS spectrum of the precursors at their corresponding pyrolysis peak temperature.
New insights into the effect of hard carbons microstructure on the diffusion of sodium ions into closed pores
Mingxin Song , Lijing Xie , Fangyuan Su , Zonglin Yi , Quangui Guo , Cheng-Meng Chen

Hard carbons (HCs), with large interlayer spacing, abundant defects, and internal pores, are considered as the most promising anode materials for sodium-ion batteries (SIBs) [1-3]. The storage of Na+ ions in HCs is generally divided into slope region (> 0.1 V) and plateau region (< 0.1 V). The low-voltage feature of plateau region facilitates the enlargement of operating voltage window and the increase of energy density in full cells [4,5]. Closed pores, defined as the enclosed spaces inside material, are a typical structural feature in HCs [3]. Distinct from open pores (connect with outside environment), closed pores usually play an important role in sodium storage at plateau region [6-8], and the main existence form of sodium in closed pores has been identified as quasi-metallic sodium clusters [1,9-11]. Normally, closed pores in HCs are surrounded by disordered carbon sheets, pseudo-graphitic structures, or graphite-like structures [6,7,12,13], and carbonization temperature is an important factor affecting the formation of closed pores [14]. However, the microstructure of HCs is rather complicated due to the diversity of precursors and preparation methods. The effective way of regulating the closed pores structure and the mechanism to achieve the diffusion of Na+ ions into closed pores are still unclear.
Precursor properties that normally play a decisive role in the structure and electrochemical performance of the derived HCs have attracted widespread attention from researchers [15-17]. Zhou et al. [12] regulated the thickness and number of closed pores in HC by removing the lignin and hemicellulose in wood precursor. The obtained HC sample exhibits enhanced sodium storage performance below 0.1 V, which is attributed to rich closed pores with thin pore wall structure. Shao et al. [18] reported that replacing the alkyl with aryl groups in epoxy resin precursor can increase the crosslink density, which leads to a more disordered carbon microstructure. The disordered microstructure with sufficient interlayer spacing provides accessible channels for Na+ ions to enter closed pores, achieving a high plateau capacity. Moreover, our previous work achieved the regulation of HCs porous structure by changing the oxygen content in esterified starch [19]. The removal of excess oxygen promotes the closure of open pores during carbonization process. The optimized sample with a large closed pore volume exhibits a high pore-filling capacity at low potential region. Although the researchers effectively regulate the HC microstructures, especially closed pores, through the modification of precursors, the enhancement of pore filling capacity is usually attributed to the increase of closed pore volume, while the effect of HC microstructures on the diffusion of Na+ ions into closed pores has not received sufficient attention.
In recent research, Yuan et al. [13] pretreated coal pith precursor under O2 and N2 atmosphere to prepare cross-linked hard carbon (PHC) and orientated soft carbon (PSC), respectively. Compared to PSC, the PHC delivers an obvious plateau capacity attributed to the rich closed pores in bulk phase. They found that not all of closed pores can be utilized by the diffusion of Na+ ions. Thus, a concept of accessible closed pores was first proposed. This method is used to correct the surface area of closed pores by introducing a correction factor A, where A is calculated based on the interlayer spacing (A1) or graphite domain size (A2). The accessible closed pores area corrected by A2 shows a higher linear relationship with the plateau capacity than A1. Although this work provides a general mechanism model for the closed pore sodium storage, the structural parameters (such as interlayer spacing, graphite domain size, defect concentration, and closed pore volume) in this method all vary linearly with the carbonization temperatures (from low to high temperatures), and the effects of different microstructures on Na+ ions diffusion are coupled together. Therefore, further research needs to focus on the effect of single structural feature on the closed pore sodium storage.
Herein, a spray drying method was used to reconstitute lignin (typical aromatic structure) and starch (typical polysaccharide structure) precursors. Benefiting from the variation in precursor components, the structural parameters of the derived HCs were effectively regulated under the same carbonization temperature (1300 ℃). The influence of precursor components on the HC microstructures including defect concentration, interlayer spacing, and closed pore volume was systematically investigated. After correlation of HC structural features with the plateau area capacity, the effects of different microstructures on the diffusion of Na+ ions in HC bulk phase were revealed.
As illustrated in Fig. 1a, equal mass of lignin (L) and starch (S) were dissolved and mixed thoroughly in hot water. Then, the solution was spray-dried to obtain the reconstituted precursor (LS). For comparison, L and S were processed separately as single components under the same conditions. As shown in Fig. S1 (Supporting information), the spray-dried precursors exhibit sphere-like morphology caused by the rapid evaporation of solvent from small droplets. After high-temperature carbonization, L1300 and LS1300 completely preserve the initial shape inherited from precursors, while S1300 displays the irregular fragment shape, which is attributed to the poor thermal stability of polysaccharides [20].
To investigate the interactions between two components, Fourier transform infrared (FTIR) spectra were employed to analyze the variations of functional groups (Fig. 1b). Compared to S, the peak intensity of OH stretching vibration (3430 cm−1) and bending vibration (1635 cm−1) in LS decreases significantly, demonstrating the presence of strong hydrogen bonding interactions. Moreover, the absorption peak of the aromatic skeleton (850 cm−1) form L is shifted to higher wavenumber in LS, indicating the formation of new cross-linked structure in the mixture [21]. Thermogravimetric (TG) analysis was conducted to trace the pyrolysis process, and three precursors exhibit different pyrolysis behavior (Fig. 1c). The carbon yield of S and L is 8% and 48%, respectively. Under the physical blending condition, the carbon yield of LS is considered to be 28%. Actually, LS shows a higher carbon yield of 35%, indicating the self-crosslinking effect of LS. Pyrolysis-gas chromatography/mass spectrometry (Py-GC/MS) was applied to further detect the gaseous products of L, LS, and S at their corresponding pyrolysis peak temperature (Fig. 1d). The major gaseous products of L are methanethiol, phenol analogs, chain-like esters, and polyaromatic compounds, and that of S are carbonyl compounds, anhydrous-glucopyranose, and melezitose (Fig. S2 in Supporting information). As shaded in Fig. 1d, a big chromatographic peak appears around 17.9 min, which is assigned to levoglucosan [22]. The intensive release of levoglucosan is the main reason for the structural foaming and low carbon yield of S [23,24]. However, levoglucosan is significantly inhibited in the pyrolysis of LS. These results prove that the blend of L and S is chemically cross-linked to each other, stabilizing the carbon skeleton and reducing carbon loss.
CO2 adsorption technique was employed to detect the porosity properties of the final HCs (Fig. 2a). The specific surface area (SSA) and open pore volume of L1300, LS1300, and S1300 are 380.14, 132.09, and 44.61 m2/g and 0.099, 0.030, and 0.007 cm3/g, respectively (Table 1). This phenomenon indicates that the change of precursor components exerts an obvious effect on the evolution of porous carbon skeleton. Raman spectra were conducted to characterize the defect concentration of the carbon materials (Fig. 2b). Two typical peaks locate at 1350 and 1580 cm−1, which are assigned to the D band and G band, respectively. The calculated ratio of ID/IG is 1.97, 2.16, and 2.31 for L1300, LS1300, and S1300, respectively. These results indicate that the polysaccharide structure facilitates the reduction of the SSA of carbon materials but increases the defects, while the aromatic structure increases the formation of open pores but reduces the defects (Fig. 2c). In addition, Small angle X-ray scattering (SAXS) was adopted to detect the porous structures in HCs. As shown in Fig. S3 (Supporting information), a broad plateau appears around 0.1 Å−1, which is a typical feature for the existing of closed pores [8,12]. To acquire the accurate closed pore volume, true density test was performed using helium as the analysis gas [3]. Ideal graphite has a layered structure without internal pores, and its true density is 2.26 g/cm3. The total closed pore volume in HCs can be calculated according to the equation [3,14].
|
|
(1) |
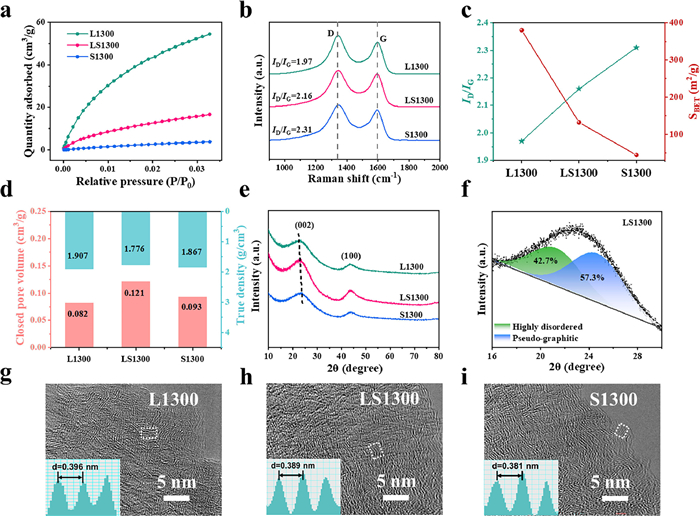
As shown in Fig. 2d, L1300 possesses the smaller closed pore volume (0.082 cm3/g) than S1300 (0.093 cm3/g). After self-crosslinking of L and S, LS1300 exhibits the highest closed pore volume of 0.121 cm3/g.
X-ray diffraction (XRD) was used to further investigate the crystalline structure of the HCs. Two broad peaks appear around 23° and 44°, demonstrating the disordered nature of biomass-derived carbon materials (Fig. 2e). Compared to L1300, the position of (002) peaks in LS1300 and S1300 slightly shifts to higher degree. The interlayer spacing (d002) of L1300, LS1300, and S1300 is calculated to be 0.394, 0.390, and 0.382 nm, respectively. Moreover, the (002) peak fitting results display the proportion variation of highly disordered (d002 larger than 0.40 nm) and pseudo-graphitic (d002 between 0.36–0.40 nm) microstructures (Fig. 2f and Fig. S4 in Supporting information) [25,26]. L1300 possesses the highest proportion (46.2%) of highly disordered carbons, while S1300 contains the highest proportion (60.6%) of pseudo-graphitic domains (Table S1 in Supporting information). The proportion of pseudo-graphitic domains gradually increases from L1300 to S1300, demonstrating the variations of microcrystalline structure caused by the change of precursor components. The carbon microcrystalline was also observed by high-resolution transmission electron microscope (HRTEM) (Figs. 2g–i). All the images display the short-range ordered structural feature, raising from the oriented alignment of carbon layers at high temperature. The interlayer spacing of L1300, LS1300, and S1300 calculated from the corresponding fast Fourier transform (FFT) patterns is 0.396, 0.389, and 0.381 nm, respectively, in line with the XRD results.
The electrochemical properties of the HCs were evaluated in half cells. Fig. 3a and Fig. S5 (Supporting information) show the cyclic voltammetry (CV) curves. During the first sodiation process, two broad peaks appear at 1.0 and 0.4 V, corresponding to the formation of solid electrolyte interphase (SEI) film [27]. In the following cycles, the CV curves are well overlapped, demonstrating the reversible and stable transfer of Na+ ions. Fig. 3b shows the galvanostatic charge-discharge (GCD) curves which are composed of slope (> 0.1 V) and plateau (< 0.1 V) regions. The reversible charge (desodiation) capacity and initial Coulombic efficiency (ICE) of L1300, LS1300, and S1300 are 324.9 mAh/g, 72.3%, 356.9 mAh/g, 75.4%, and 306.8 mAh/g, 82.2%, respectively. It finds that ICE shows a continuous upward trend from L1300 to S1300 (Fig. 3c). Combined with the results in Fig. 2c, it can be presumed that the SSA of the prepared HCs, rather than the defects, exerts a major influence on the ICE. The larger SSA, the more SEI side reactions occur. Moreover, the slope and plateau capacities assigned based on the second discharge (sodiation) curves were also provided (Fig. 3c and Fig. S6 in Supporting information). LS1300 shows the highest slope and the highest plateau capacities, and the sodiation mechanism will be discussed in the later section.
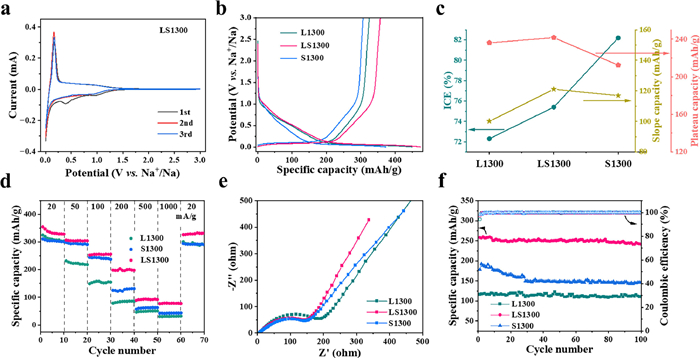
The rate performance test was conducted by applying stepwise current densities (Fig. 3d). As the current density increases, the reversible capacity gradually decays, which is mainly attributed to the poor kinetics of the low potential region [19]. At the range of 20−1000 mA/g, LS1300 displays the highest capacity. When returned to low current density, all HC electrodes recover to their initial capacity, suggesting the stable skeleton of disordered carbons. Electrochemical impedance spectra (EIS) were applied to investigate the charge transfer characteristics (Fig. 3e). The nonsymmetrical semicircle observed at high-medium frequencies corresponds to the SEI film resistance (Rf) and charge transfer resistance (Rct), and the sloping line at low frequency is related to the diffusion of Na+ ions in electrode [1]. The equivalent circuit diagram and the fitting results are shown in Fig. S7 and Table S2 (Supporting information). L1300 shows the highest Rf, which is attributed to the decomposition of electrolytes on the large surface and open pores. The changing trend of the Rf is proportional to the values of the specific surface area. Moreover, LS1300 exhibits the lowest value of Rf + Rct, which may be due to the equilibrium of specific surface area and microcrystalline phase. Long cycling performance was also evaluated at 100 mA/g (Fig. 3f). After 100 cycles, LS1300 still retains a desodiation capacity of 241.5 mAh/g with a capacity retention ratio of 93.5%, compared to L1300 (110.3 mAh/g, 95.2%) and S1300 (146.2 mAh/g, 82.1%).
To explore the sodium storage behavior of the prepared HCs, CV curves obtained at different scan rates were used to analyze the reaction kinetics (Fig. 4a and Fig. S8 in Supporting information). The surface-controlled and diffusion-controlled processes can be reflected by a power-law formula of i = avb, where i and v represent the peak current and the scan rate, respectively. The b value can be calculated by the slope of log(i)-log(v) plot (Fig. 4b) [28]. As listed in Table S3 (Supporting information), the b value of peak s is 0.85, 0.96, and 0.96 for L1300, LS1300, and S1300, respectively, demonstrating that the storage behavior of Na+ ions at high potential region is dominated by adsorption process. However, the b value of peak p is 0.58, 0.49, and 0.42 for L1300, LS1300, and S1300, respectively, suggesting the diffusion-controlled process at low potential region. Galvanostatic intermittent titration technique (GITT) was conducted to further explore the kinetic properties (Fig. S9 in Supporting information). The pulse time was specified as 30 min with open circuit intervals of 2 h. The apparent diffusion coefficients of Na+ ions in HC electrodes can be calculated according to Fick's second law with the simplified equation (Fig. S9) [11]. As shown in Fig. 4c, the changing trends of Na+ ions diffusion coefficients are similar for the three HCs during sodiation process. When the potential is higher than 0.1 V, Na+ ions exhibit high diffusion coefficients, which can be attributed to the ions adsorption at open pores or defect sites. From 0.1 V to 0.05 V, the diffusion coefficients drop sharply and rebound after 0.05 V. This phenomenon has been reported in recent studies, which is usually described as the intercalation of Na+ ions into the pseudo-graphitic layers and then filling into the closed pores [13,18,29].
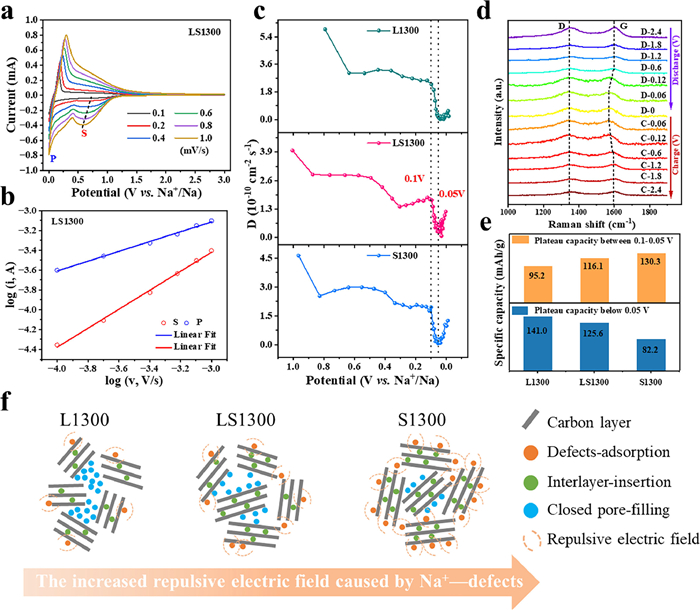
To obtain more information about the storage mechanism, in-situ Raman was applied during the first CV cycle (Fig. 4d). Due to similar CV and GITT results for three samples, LS1300 was used as a model material for in-depth study. During the sodiation process at high potential region, the intensity of D band (1340 cm−1) gradually decreases, and the peak shape becomes broader, suggesting the occupation of Na+ ions at defect sites. Moreover, the position of G band (1580 cm−1) remains unchanged until around 0.1 V, which indicates that Na+ ions are not embedded into the interlayer within this potential range [30], in line with the GITT results. From 0.1 V to 0.05 V, the G band shifts to lower wavenumbers accompanied by a decrease in intensity, which is attributed to the intercalation of Na+ ions in bulk phase. Moreover, the G band shows no significant shift between 0.05 V and 0 V. Combined with the GITT results from plateau region, it can be concluded that Na+ ions intercalate into the pseudo-graphitic structures between 0.1 V and 0.05 V. When the intercalation sites reach saturation, the subsequent Na+ ions fill into the closed pores after 0.05 V. As the desodiation process proceeds, the D and G bands gradually return to their original state.
Based on the above storage mechanism analysis, the plateau region capacity extracted from the second discharge curves can be divided into two parts according to the potential range. As shown in Fig. 4e, the capacity between 0.1 V and 0.05 V is 95.2, 116.1, and 130.3 mAh/g for L1300, LS1300, and S1300, respectively. The capacity below 0.05 V is 141.0, 125.6, and 82.2 mAh/g for L1300, LS1300, and S1300, respectively. It finds that the capacity contributed by ions intercalation is proportional to the ratio of pseudo-graphitic domains (Table S1 in Supporting information). However, the capacity provided by closed pore filling gradually decreases from L1300 to S1300. It is noted that the closed pore volume of both LS1300 (0.121 cm3/g) and S1300 (0.093 cm3/g) is higher than that of L1300 (0.082 cm3/g). Therefore, it is not reasonable to simply correlate the pore-filling capacity with the closed pore volume. Cao and coworkers have proposed that the strong defect−Na+ ions interactions could create a repulsive electric field for other ions, which reduces Na+ ions concentration between graphitic layers and shrinks the intercalation capacity [31]. In this work, the prepared HCs have a large interlayer spacing (> 0.38 nm), providing enough space for ions intercalation. Therefore, the intercalation capacity is less affected by defects. However, the pore-filling behavior occurs at lower potentials (< 0.05 V). As demonstrated in Fig. 4f, from L1300 to S1300, the amount of adsorbed Na+ ions (including reversible and irreversible adsorption) rise due to the increase in defect concentration, and the strength of the repulsive electric field is growing. L1300 has the lowest defect concentration, facilitating Na+ ions to reach closed pores. Although LS1300 and S1300 possess a higher proportion of pseudo-graphitic domains and closed pore volume, the increasing repulsive electric field prevents Na+ ions from reaching the closed pores due to the homo-ionic repulsion effect. As a consequence, the pore-filling capacity shows a downtrend with the increase in defect concentration.
The performance of HC was also evaluated in full cells. LS1300 and Na3V2(PO4)3 (NVP) were selected as anode and cathode materials, respectively (Fig. S10a in Supporting information). After several pre-cycles at 20 mA/g, the full cell can maintain a capacity of 330 mAh/g (based on anode) with an average working voltage of 3.2 V. As the current density increases, the full cell displays good rate performance, and the voltage plateau remains until 1000 mA/g (Fig. S10b in Supporting information). Moreover, the full cells also demonstrate stable charging and discharging process, and a reversible capacity of 280 mAh/g can be recorded after 100 cycles at 100 mA/g (Fig. S10c in Supporting information). These results suggest that LS1300 shows promising potential in practical sodium-ion batteries.
In this contribution, a spray drying strategy was conducted to reconstruct the precursor with aromatic and polysaccharide components. Benefiting from the changes in precursor components, the HC microstructures including specific surface area, defects concentration, interlayer spacing, and closed pore volume were effectively regulated at 1300 ℃. The results indicate that aromatic components tend to develop disordered carbons with fewer defects, larger interlayer spacing, and smaller closed pore volume. In comparison, polysaccharide components prefer to form disordered carbons with more defects, smaller interlayer spacing, and larger closed pore volume. Through the correlation analysis of microstructure features and the sodium storage capacity below 0.1 V. It finds that the intercalation capacity (between 0.1 V and 0.05 V) is proportional to the ratio of pseudo-graphitic domains. However, the pore filling capacity (below 0.05 V) gradually decreases with the increasing defect concentration due to homo-ionic repulsion effect, without linear correlation with short-range microcrystalline and closed pore volume, suggesting that the pore filling capacity cannot be simply related to the closed pore volume. The optimized sample with suitable interlayer spacing and defect concentration delivers a high plateau capacity of 241.7 mAh/g. This work provides new guidance for the structural optimization of high-performance HCs.
The authors declare that they have no known competing financial interests or personal relationships that could have appeared to influence the work reported in this paper.
This work was supported by the National Key Research and Development (R&D) Program of China (No. 2020YFB1505803), the Youth Innovation Promotion Association of CAS (No. 2019178), and the Innovation Fund for Basic Research Program supported by ICC CAS (Nos. SCJC-XCL-2023-10, SCJC-XCL-2023-13).
Supplementary material associated with this article can be found, in the online version, at doi:
X. Yin, Z. Lu, J. Wang, et al., Adv. Mater. 34 (2022) 2109282. doi: 10.1002/adma.202109282
F. Xie, Z. Xu, Z. Guo, et al., Sci. China Chem. 64 (2021) 1679–1692. doi: 10.1007/s11426-021-1074-8
Y.Q. Li, Y.X. Lu, Q.S. Meng, et al., Adv. Energy Mater. 9 (2019) 1902852. doi: 10.1002/aenm.201902852
L. Yue, Y. Lei, Y. Niu, et al., Chem. Rec. 22 (2022) 202200113. doi: 10.1002/tcr.202200113
X. Zhang, X. Dong, X. Qiu, et al., J. Power Sources 476 (2020) 228550. doi: 10.1016/j.jpowsour.2020.228550
Q. Meng, Y. Lu, F. Ding, et al., ACS Energy Lett. 4 (2019) 2608–2612. doi: 10.1021/acsenergylett.9b01900
K. Wang, F. Sun, H. Wang, et al., Adv. Funct. Mater. 32 (2022) 2203725. doi: 10.1002/adfm.202203725
H. He, J. He, H. Yu, et al., Adv. Energy Mater. 13 (2023) 2300357. doi: 10.1002/aenm.202300357
X.Y. Chen, J.Y. Tian, P. Li, et al., Adv. Energy Mater. 12 (2022) 2200886. doi: 10.1002/aenm.202200886
K. Gotoh, T. Yamakami, I. Nishimura, et al., J. Mater. Chem. A 8 (2020) 14472–14481. doi: 10.1039/D0TA04005C
Y. Li, Y.S. Hu, M.M. Titirici, et al., Adv. Energy Mater. 6 (2016) 1600659. doi: 10.1002/aenm.201600659
S. Zhou, Z. Tang, Z. Pan, et al., SusMat 2 (2022) 357–367. doi: 10.1002/sus2.60
M. Yuan, B. Cao, H. Liu, et al., Chem. Mater. 34 (2022) 3489–3500. doi: 10.1021/acs.chemmater.2c00405
Q.J. Ren, J. Wang, L. Yan, et al., Chem. Eng. J. 425 (2021) 131656. doi: 10.1016/j.cej.2021.131656
X. Tang, F. Xie, Y. Lu, et al., Nano Res. (2023) 1–8.
F. Xu, H. Han, Y. Qiu, et al., Carbon 167 (2020) 896–905. doi: 10.1016/j.carbon.2020.05.081
H. Zhang, W. Zhang, H. Ming, et al., Chem. Eng. J. 341 (2018) 280–288. doi: 10.1016/j.cej.2018.02.016
W. Shao, Q. Cao, S. Liu, et al., SusMat 2 (2022) 319–334. doi: 10.1002/sus2.68
M. Song, Z. Yi, R. Xu, et al., Energy Storage Mater. 51 (2022) 620–629. doi: 10.1016/j.ensm.2022.07.005
M. Li, Z. Bi, L. Xie, et al., ACS Sustain. Chem. Eng. 7 (2019) 14796–14804. doi: 10.1021/acssuschemeng.9b02821
Y. Li, Y.S. Hu, H. Li, et al., J. Mater. Chem. A 4 (2016) 96–104. doi: 10.1039/C5TA08601A
X.Y. Jia, Z.L. Yi, R. Xu, et al., Appl. Surf. Sci. 629 (2023) 157371. doi: 10.1016/j.apsusc.2023.157371
M.X. Song, L.J. Xie, J.Y. Cheng, et al., J. Energy Chem. 66 (2022) 448–458. doi: 10.1016/j.jechem.2021.08.050
Z. Yang, X. Liu, Z. Yang, et al., J. Anal. Appl. Pyrolysis 102 (2013) 83–88. doi: 10.1016/j.jaap.2013.03.012
N. Sun, Z. Guan, Y. Liu, et al., Adv. Energy Mater. 9 (2019) 1901351. doi: 10.1002/aenm.201901351
B. Cao, H. Liu, B. Xu, et al., J. Mater. Chem. A 4 (2016) 6472–6478. doi: 10.1039/C6TA00950F
G. Zhang, L. Zhang, Q. Ren, et al., ACS Appl. Mater. Interfaces 13 (2021) 31650–31659. doi: 10.1021/acsami.1c06168
Z. Xu, J. Wang, Z. Guo, et al., Adv. Energy Mater. 12 (2022) 2200208. doi: 10.1002/aenm.202200208
Y. Jin, S. Sun, M. Ou, et al., ACS Appl. Energy Mater. 1 (2018) 2295–2305. doi: 10.1021/acsaem.8b00354
X. Yin, Y. Zhao, X. Wang, et al., Small 18 (2021) 2105568.
L.F. Xiao, H.Y. Lu, Y.J. Fang, et al., Adv. Energy Mater. 8 (2018) 1703238. doi: 10.1002/aenm.201703238

Figure 1 (a) Schematic diagram of precursor reconstitution. (b) FTIR spectra. (c) TG-DTG curves. (d) Py/GC–MS spectrum of the precursors at their corresponding pyrolysis peak temperature.

Figure 2 Structural characterization of the HCs. (a) CO2 adsorption isotherms. (b) Raman spectra. (c) The changing trends of ID/IG and specific surface area measured by CO2 adsorption. (d) True density and closed pore volume. (e) XRD patterns. (f) Fitting result of the (002) peak. (g–i) HRTEM images. Insets in (g–i) show the corresponding FFT patterns.

Figure 3 Electrochemical characterization of the HCs. (a) CV curves conducted at 0.1 mV/s. (b) Initial GCD curves measured at 20 mA/g. (c) The changing trends of ICE and slope/plateau region capacity calculated based on the second cycle discharge curves. (d) Rate performance at various current densities. (e) EIS measured after 5 GCD cycles. (f) Cycling capability at 100 mA/g.

Figure 4 Sodium storage behavior investigation. (a) CV curves measured at various scans. (b) The correlations of scan rate and peak current. (c) The Na+ ions apparent diffusion coefficients during sodiation process. (d) In-situ Raman spectra. (e) The plateau capacity calculated from the second cycle discharge curves. (f) The effect of defects on the Na+ ions closed pore filling.

 扫一扫看文章

扫一扫关注我们
 DownLoad:

 下载:
下载: