
Scheme 1.
Mo2C@C synthetic route using OOC 1-3 with controllable organic ligands.
Defined organic-octamolybdate crystalline superstructures derived Mo2C@C as efficient hydrogen evolution electrocatalysts
Jiao Li , Chenyang Zhang , Chuhan Wu , Yan Liu , Xuejian Zhang , Xiao Li , Yongtao Li , Jing Sun , Zhongmin Su

In the era of rapidly developing new and clean energy source systems, hydrogen energy has stood out as one of the best energy carrier candidates on account of its high energy density and zero carbon emissions. Hydrogen production by electrolytic water enables a closed hydrogen cycle with zero carbon emissions at normal temperature and pressure, which is a sustainable and environmentally friendly method. At present, developing efficient electrocatalysts plays a core role in water hydrolysis and becomes the research focus [1–3]. Currently, the best electrocatalyst for hydrogen evolution is the precious metal Pt/C, with a nearly zero overpotential, but the high cost and scarce raw material characteristics limit large-scale applications [4]. Thereby, the development of affordable, high-catalytic catalysts based on non-noble metals is of great importance.
Mo-based electrocatalysts have been widely used in water electrolysis for hydrogen evolution due to the platinum-like electronic structure, which often exhibit remarkable performance [5–10]. For instance, Cao et al. used thiourea as a sulfur source to prepare MoS2 nanorods for hydrogen evolution by pyrolysis of Mo-MOF, which shows good catalytic activity with an initial potential of 96 mV and the Tafel slope of 93 mV/dec [11]. Dai et al. prepared Mo2C nanocrystals embedded in a carbon network (Mo2C@C) by pyrolysis of molybdate and polyvinylpyrrolidone, which exhibits a lower overpotential of 132 mV at the current density of 10 mA/cm2 [12]. Nevertheless, the Mo-based carbides synthesized on carbon matrixes by high-temperature carbonization, often shows low Mo content (< 40 wt%) [13], going against to load more active species in the electrocatalytic process. Therefore, developing high Mo content precursors with defined crystalline superstructures is the prerequisite to fabricate efficient Mo-containing electrocatalysts, which is of great significance to blossom noble-metal free catalysts for hydrogen evolution.
Metal-organic crystalline materials, such as metal-organic frameworks (MOFs), are widely used as organic-inorganic hybrid precursor materials for electrocatalysts due to the well-defined ordered porous structures, ultra-high specific surface area, and abundant metallic sites [14–20]. Polyoxometalates (POMs) are well-defined anionic oxygen clusters, possessing interesting redox properties, which make POMs as potential catalysts in energy storage and conversion fields [21]. Furthermore, POM is considered as an excellent building block for derived electrocatalysts because of its excellent electron rich property and electron/proton storage behavior [22–26]. However, except loading polyoxometalates, Cu-MOF loading H3PMo12O40 [27] or MIL-100 (Fe) loading H3PMo12O40 [28], there is few metal-organic crystals containing Mo nodes, that can be used as precursors to synthesize molybdenum carbides electrocatalysts. It is still challenging to establish controllable synthesis Mo-based organic crystalline materials as precursors for efficient electrocatalysts fabrication.
In this study, five organic-octanoylated crystalline superstructures (OOCS-1–3) with the same (L)2(β-Mo8O26) asymmetric unit are constructed by flexible ligands of controllable alkyl chains length under hydrothermal method. Using OOCS-1–3 as precursors, the high-efficient hydrogen evolution electrocatalysts Mo2C@C-1–3 were directly obtained by a high-temperature carbonization process. As a typical representative, Mo2C@C-3 exhibits satisfactory HER performance with the overpotential of 151 mV and 24 h stability in 1.0 mol/L KOH. Given that the Mo contents in OOCS-1–3 are all large than 40 wt%, the resulting Mo2C@C electrocatalyst can display much more electrochemical active sites, resulting in the final good HER activity. The synergetic effects of Mo2C and carbon layers can modulate the electronic structure and thereby enhances the intrinsic activity of the electrocatalyst. Moreover, the carbon layers can protect the Mo2C nanoparticles from corrosion, thus improving the stability of the catalyst. There have been few studies on the organic-inorganic hybrid crystals of flexible ligands and polyoxometalate derivatives, directly used as electrocatalysts in electrolysis of water, which provides new research ideas to develop high-efficient hydrogen evolution electrocatalysts.
All single crystal data was obtained by X-ray single crystal diffractometer. Single crystal structures were directly analyzed and refined using the Olex2 program and mapped in the Diamond software (Scheme 1). The complete single crystal structure information of OOCS-1–3 is summarized in Tables S1-S7 (Supporting information) and the CCDC numbers are 2154698–2154699 and 2154702, respectively. By controlling the alkyl chains in the flexible ligands, OOCS-1–3 with same asymmetric units can be synthesized under hydrothermal methods, which establishes the oriented synthesis for this kind of organic-octamolybdate crystalline superstructures.
As shown in Fig. 1, OOCS-1 appertains to the triclinic system and P-1 space group. Its crystal parameters are a = 9.6913(8) Å, b = 10.4404(10) Å, c = 10.7519(11) Å, α = 100.535(6)°, β = 104.154(5)°, γ = 105.425(5)°, V = 980.46(16) Å3. OOCS-1 is a 3D framework material based on the Mo8 cluster. The asymmetric unit includes half of a [β-Mo8O26]4− and one L1 ligand (Fig. 1a). The Mo8 cluster exists in a dissociative state with L1 ligand, and finally forms a two-dimensional stacked structure (Figs. 1b and c).
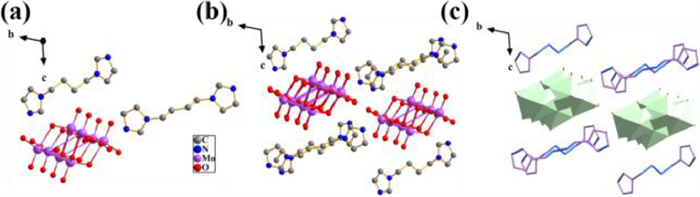
For OOCS-2, single crystal X-ray data indicate that OOCS-2 is monoclinic with a space group of C2/c. The structure parameters are a = 23.491(11) Å, b = 12.481(6) Å, c = 19.090(9) Å, α = γ = 90°, β = 113.890(8)°, V = 5117(4) Å3. From Fig. 2a, the asymmetric unit diagram of OOCS-2 includes one [β-Mo8O26]4−, two L2 ligands and one free water molecule. Similarly, the Mo8 cluster and L2 ligand do not perform coordination and remain in an unbound state, forming a 2D layered structure of Mo8 clusters surrounded by ligands (Figs. 2b and c).
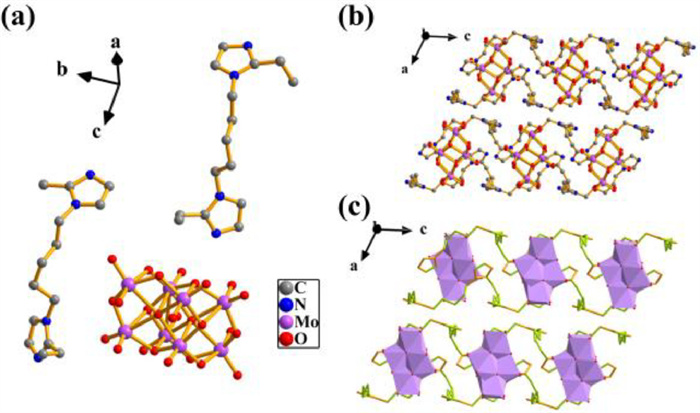
OOCS-3 belongs to monoclinic system of P21/n space group. The crystal parameters are a = 12.0189(5) Å, b = 12.634(6) Å, c = 18.306(8) Å, α = γ = 90°, β = 98.376(7)°, V = 2789.0(2) Å3. The asymmetric unit of OOCS-3 consists of one [β-Mo8O26]4− and two L3 ligands, and [β-Mo8O26]4− exists in a free manner (Fig. 3a). As shown in Figs. 3b and c, the Mo8 clusters and the L3 ligands form a three-dimensional layered structure by electrostatic attraction stacking.

To explore the synthesis of OOCS-1–3, PXRD characterization was performed at room temperature (Fig. S1 in Supporting information). The results indicate that there is no significant difference between the experimental and theoretical pattern for the PXRD mode for all MOFs, indicating that all crystals have high phase purity. In addition, infrared spectra in the range of 400–4000 were recorded in order to determine the composition of the crystal groups (Fig. S2 in Supporting information). The characteristic peaks of crystal OOCS-1 at 1350–1500 and 900–1350 cm−1 are the stretching and plane vibration of imidazole [29]. Located at below 800 cm−1 peaks can be attributed to the out-of-plane vibration of imidazole, and the peak of L1 ligand is at the range of 1047–1691 cm−1. For OOCS-2, the peaks in the range of 1013–1606 cm−1 correspond to L2 ligands [30]. The peaks of OOCS-3 at 876, 781, 490 and 432 cm−1 are the stretching vibrations of the ν(Mo-Od) and the ν(Mo-Ob/c−Mo) [31]. In addition, the peak at 1013–1608 cm−1 was the characteristic peak of ethyl in L2 ligand, and the peak at 1016–1614 cm−1 was the characteristic peak of isopropyl in L3 ligand [30].
Thermal stability and structural changes of MOFs during high-temperature calcination are very important research points for hydrogen evolution. Therefore, a thermodynamic analysis of OOCS-1–3 at 37–1000 ℃ was performed (Fig. S3 in Supporting information). First, from Fig. S3a, it can be observed that the weight loss of OOCS-1 is 39.65% with a range of 315–670 ℃, which can be attributed to the breakdown of the L1 ligand and the collapse of the OOCS-1 skeleton. Based on the same analysis, crystal OOCS-2 shows a small amount of weight loss at 282 ℃, with a weight loss rate of 4.91%, corresponding to the loss of free water molecules. The decomposition temperature of crystal OOCS-2 is approximately 418 ℃ crystal skeleton collapse, L2 ligand decomposition (Fig. S3b). The main weight loss temperature of OOCS-3 is between 300 and 700 ℃, and the weight loss rate is 52.9% and 50.3%, respectively (Fig. S3c).
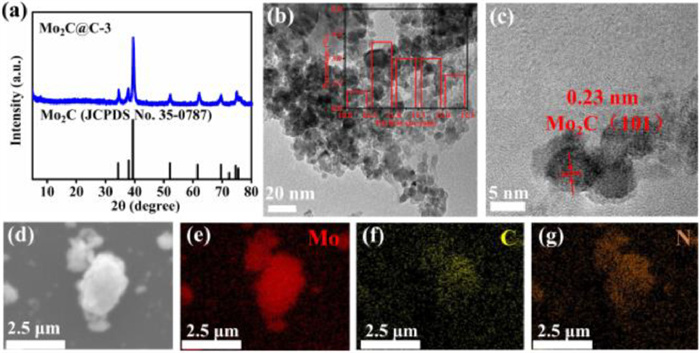
All electrocatalysts are the derivatives of OOCS-1–3, which are obtained through one-step direct high-temperature calcination process (Scheme 1). First of all, the phase composition of the catalyst is analyzed by powder X-ray diffraction (PXRD) patterns, shown in Fig. 4a and Fig. S4 (Supporting information). All five electrocatalysts of Mo2C@C-1–3 display the substance of β-Mo2C (JCPDS No. 35–0787). For Mo2C@C-3, the diffraction peaks of 34.42°, 37.81°, 39.59°, 52.02°, 61.86°, 69.49°, 72.53°, 74.73° and 75.72° are corresponded to the (100), (002), (101), (102), (110), (103), (200), (112) and (201) lattice plane (Fig. S6a in Supporting information). The main characteristic peaks of Mo2C@C-1–2 are same with that of Mo2C@C-3 and corresponding lattice planes (Fig. S4). Then, the microstructures of Mo2C@C-1–3 are characterized by transmission electron microscopy (TEM) (Figs. 4b–g, Figs. S5 and S6 in Supporting information). The particle size of Mo2C nanoparticles in Mo2C@C-3 is mainly distributed in 10–12 nm, and the surface is coated with graphite carbon layers (Fig. 4b). In the high-resolution image, the presence of Mo2C nanoparticles can be clearly seen, and the lattice spacing of 0.23 nm is ascribed to the (101) plane (Fig. 4c). Meantime, Figs. S5a and S6a show that the sizes of Mo2C@C-1–2 nanoparticles are mainly distributed in the range 34–48 nm and 38–64 nm respectively. In Figs. S5b and S6b, HRTEM images all exhibit Mo2C nanoparticles existed, and the lattice spacings are both 0.26 nm (100). Furthermore, Figs. 4d–g, Figs. S5c-f and S6c-f exhibit the energy dispersive X-ray (EDX) diagrams of Mo, C and N, indicating that all elements are uniformly distributed in the electrocatalysts.
The graphitization degree of Mo2C@C-1–3 is usually assessed by Raman spectroscopy [32,33]. The Raman spectra of Mo2C@C-1–3 are shown in Fig. S7 (Supporting information). The D band and G band are located at 1352 cm−1/1597 cm−1 (Mo2C@C-1), 1352 cm−1/1599 cm−1 (Mo2C@C-2), 1330 cm−1/1597 cm−1 (Mo2C@C-3), and the values of ID/IG are 1.087, 0.981 and 1.171, respectively. The results show that Mo2C@C-1–3 all exhibit a proper degree of graphitization, which could enhance the electrical conductivity [34]. Meanwhile, along with the moderate defects, more active sites can participate the electrocatalytic process. Furthermore, given that the mass transfer process, N2 adsorption-analytical tests were performed to investigate the pore structures (Fig. S8 in Supporting information). All electrocatalysts belong to the Ⅲ type of adsorption isotherms and exhibit mesopore structures with pore sizes of 54.21 nm (Mo2C@C-1), 5.35 nm (Mo2C@C-2) and 7.28 nm (Mo2C@C-3), respectively.
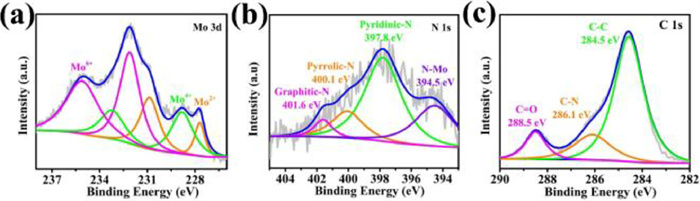
The valence states and compositions of Mo2C@C-1–3 are analyzed by X-ray photoelectron spectroscopy (XPS). It is obvious that Mo2C@C-1–3 are composed of Mo, N and C elements (Figs. S9 and S10 in Supporting information, Fig. 5). Thereinto, Fig. 5 shows the XPS spectra of Mo 3d, N 1s and C 1s of Mo2C@C-3. As shown in Fig. 5a, the XPS spectrum of Mo 3d can be deconvolved into six peaks of Mo2+ (227.7 and 230.9 eV), Mo4+ (228.8 and 233.2 eV) and Mo6+ (232.1 and 235.1 eV) [35]. The peaks of Mo2+ can be attributed to Mo2C, while the peaks of Mo6+ and Mo4+ belong to the molybdenum oxidation species, which is mainly caused by the surface oxidation [36,37]. The XPS spectrum of N 1s can be mainly divided into four characteristic peaks of pyridinic N (397.8 eV), pyrrolic N (400.1 eV), graphitic N (401.6 eV) and N-Mo bond (394.5 eV), proving that N element is successfully doped into graphitic carbon layers, and pyridinic N and pyrrolic N are more conducive to improve the electrocatalytic performance (Fig. 5b) [28]. According to Fig. 5c, the XPS spectrum of C 1s is mainly deconvolved into three peaks, which are C–C (284.5 eV), C–N (286.1 eV) and O–C=C (288.5 eV). By the similar raw material compositions and synthesis process of all electrocatalysts, not only do Mo2C@C-1–2 have the same elemental composition, electronic valence states, the characteristic peak positions are almost same with Mo2C@C-3 (Figs. S9 and S10) [38].
For purpose of investigating the HER activity of catalysts, firstly, liner sweeps voltammetry (LSV) curves of Mo2C@C-1–2 in alkaline solutions are recorded by traditional three-electrode system to evaluate the HER performance. As the most important factors in the preparation of catalysts, the effect of temperature on the hydrogen evolution performance is investigated. The results are shown in Fig. S11 (Supporting information). Mo2C@C-1 and Mo2C@C-2 exhibit the lowest overpotentials of 183 and 173 mV, respectively, at a calcination temperature of 850 and 750 ℃. The lowest overpotentials of Mo2C@C-3 is 151 mV at 800 ℃. Fig. 6a shows the polarization curves of Mo2C@C-1–3 and Pt/C in alkaline media. There is no doubt that the precious metal catalyst Pt/C exhibits the best catalytic activity of almost zero overpotential [39]. Mo2C@C-3 exhibits satisfactory hydrogen evolution properties with respect to the other electrocatalysts, with an overpotential of 151 mV at a current density of 10 mA/cm2, while the other catalysts show similar hydrogen production properties. In order to clarify the catalytic mechanism, the Tafel slopes are calculated as shown in Fig. 6b. The Tafel slopes for Mo2C@C-1–3 are 75, 106 and 85 mV/dec, respectively, obeying the Volmer-Heyrovsky mechanism and the Volmer process is the rate determination step [40]. To investigate the element content influence on the hydrogen evolution performance, inductively coupled plasma (ICP) and elemental analysis tests were performed. The results are shown in Table S8 (Supporting information). The content of Mo and C element in Mo2C@C-3 is highest as 60.6 wt% and 15.4 wt%, consistent with component trend in precursor OOCS-3, meaning the higher carbon residues from the high C amount in organic ligands. The content of nitrogen in Mo2C@C-1–3 increases from 1.9 wt% to 3.8 wt%, which shows a opposite trend with the precursor from 7.14 wt% to 6.24 wt%. N atoms can participate the regulation of electronic structure for electrocatalyst, thus higher N amount may accelerate charge transfer in HER process, benefiting for the enhanced hydrogen evolution performance.

For the purpose of further understand the electrochemical active area, the electrochemical surface (ESCA) of Mo2C@C-1–3 is characterized by double layer capacitance (Cdl). Cyclic voltammetry (CV) curve tests were performed at different sweep rates in the voltage range of −0.1~0.15 V (Fig. 6c and Fig S12 in Supporting information). The Cdl values of Mo2C@C-1–3 under alkaline conditions are 8.48, 5.28 and 9.23 mF/cm2 (Fig. 6d), and Mo2C@C-3 possesses the highest double layer capacitance, meaning higher electrochemical active surface area and more exposed active sites to enhance the catalytic activity [41]. Electrochemical impedance spectroscopy (EIS) has also been used to evaluate catalytic activity. Charge transfer resistance (Rct) is derived from high frequencies in Nyquist diagrams [42]. In short, lower Rct values correspond to faster HER dynamics. Nyquist plots of Mo2C@C-1–3 are demonstrated in Fig. 6e, where Mo2C@C-3 corresponds to the smallest semicircle and lower impedance value, proving a faster charge transfer rate. The stability has been one of the main research concerns for electrocatalysts. In order to assess the durability of Mo2C@C-1–3, 2000 CV cycles were tested at a certain scan rate and the polarization curves were subsequently tested. It is found that there exists little difference of the tested curves compared with the initial one, indicating that all the electrocatalysts show good durability (Fig. 6f and Fig. S13 in Supporting information). To further demonstrate the electrochemical stability, current-time (i-t) (inset) curves at 10 mA/cm2 for 24 h were measured (Fig. 6f (inset) and Fig. S13 (inset)). The results also show good stability for all electrocatalysts. Furthermore, XRD patterns and TEM images characterizations of Mo2C@C-3 was further performed after 24 h stability test in 1.0 mol/L KOH. As shown in Fig. S14 (Supporting information), the XRD pattern of after 24 h test is consistent with the before with Mo2C (PDF#35–0787) phases. Fig. S15 (Supporting information) shows the TEM images and EDS mapping images, which indicated that the tested catalyst is composed of Mo2C nanoparticles, and Mo, C and N elements are uniformly distributed in the catalyst. The above results show that the phase and structure of the catalyst have no change after testing, which proves that the catalyst has satisfactory durability. For comparison, recent MOF derivatives used for hydrogen evolution are summarized in Table S9 (Supporting information).
In summary, three new two-dimensional organic-octamolybdate crystalline superstructures (OOCS-1–3) were synthesized through hydrothermal method. Originated from the well-defined crystalline structures and high Mo content, Mo2C@C-1–3 as hydrogen evolution electrocatalysts are obtained by directly calcining OOCS-1–3 at high temperature without complex recombination processes. Mo2C@C-3 shows good catalytic activity with the overpotential of 151 mV at 10 mA/cm2 and 24 h stability under alkaline conditions. The electrocatalytic activity is mainly derived from the synergistic action between Mo2C nanoparticles and carbon layers. Otherwise, compared the elemental analysis of precursor OOCS-1–3 and Mo2C@C-1–3, the amount trend of Mo, and C will inherit the crystalline precursors. Meantime, a higher proportion of N element is beneficial for improving the hydrogen evolution performance of catalysts. This work provides an experimental basis to controllably synthesize well-defined organic-octamolybdate crystalline superstructures as organic-inorganic hybrids precursors for preparing high Mo-content electrocatalysts, exploited in potential energy conversion systems.
The authors declared that they have no conflicts of interest to this work. We declare that we do not have any commercial or associative interest that represents a conflict of interest in connection with the work submitted.
This work was financially supported by Joint Fund Project of the Natural Science Foundation of Jilin Province (No. YDZJ202301ZYTS290).
Supplementary material associated with this article can be found, in the online version, at doi:
S. Khan, T. Noor, N. Iqbal, E. Pervaiz, ChemNanoMat 8 (2022) e202200115. doi: 10.1002/cnma.202200115
G. Zhou, P. Wang, H. Li, et al., Nat. Commun. 12 (2021) 4827. doi: 10.1038/s41467-021-25095-4
Y.H. Li, C.K. Peng, H.M. Hu, et al., Nat. Commun. 13 (2022) 1143. doi: 10.1038/s41467-022-28805-8
D. Gao, R. Liu, J. Biskupek, et al., Angew. Chem. Int. Ed. 58 (2019) 4644–4648. doi: 10.1002/anie.201900428
J. Li, H.Y. Zheng, C.Y. Xu, et al., Inorg. Chem. 60 (2021) 1624–1630. doi: 10.1021/acs.inorgchem.0c03110
T.T. Gu, R.J. Sa, L.J. Zhang, D.S. Li, R.H. Wang, Appl. Catal. B Environ. 296 (2021) 120360. doi: 10.1016/j.apcatb.2021.120360
P.F. Zhang, Y.D. Liu, T.T. Liang, et al., Appl. Catal. B Environ. 284 (2021) 119738. doi: 10.1016/j.apcatb.2020.119738
Y.Y. Chen, Y. Zhang, W.J. Jiang, et al., ACS Nano 10 (2016) 8851–8860. doi: 10.1021/acsnano.6b04725
Z. Hu, J. Chen, P.Y. Pan, et al., Int. J. Hydrog. Energy 47 (2022) 4641–4652. doi: 10.1016/j.ijhydene.2021.11.108
Y., .W Li, L., .Y Guo, H., .F Su, et al., Inorg. Chem. 56 (2017) 2481–2489. doi: 10.1021/acs.inorgchem.6b02601
J.D. Yi, T.T. Liu, Y.B. Huang, R. Cao, Sci. China Mater. 62 (2019) 965–972. doi: 10.1007/s40843-018-9393-x
Y.Y. Chen, Y. Zhang, Y.L. Ma, et al., Chin. J. Chem. 35 (2017) 911–917. doi: 10.1002/cjoc.201600790
S. Li, Z.Y. Zhao, T. Ma, P. Pachfule, A. Thomas, Angew. Chem. Int. Ed. 61(3) 2022 e202112298. doi: 10.1002/anie.202112298
M. Nemiwal, V. Gosu, T.C. Zhang, D. Kumar, Int. J. Hydrog. Energy 46 (2021) 10216–10238. doi: 10.1016/j.ijhydene.2020.12.146
L.L. Zou, Y.S. Wei, et al., Small 17 (2021) 2004809. doi: 10.1002/smll.202004809
G. Dey, A.A. Shadab, ChemElectroChem 8 (2021) 1–23. doi: 10.1002/celc.202001477
B.J. Zhu, D.G. Xia, R.Q. Zou, Coordin. Chem. Rev. 376 (2018) 430–448. doi: 10.1016/j.ccr.2018.07.020
C.T. Buru, O.K. Farha, ACS Appl. Mater. Interfaces 12 (2020) 5345–5360. doi: 10.1021/acsami.9b19785
Y. Yu, X.Y. Qiu, X.X. Zhang, et al., Electrochim. Acta 299 (2019) 423–429. doi: 10.1016/j.electacta.2018.12.184
Q. Yang, W.X. Liu, B.Q. Wang, et al., Nat. Commun. 8 (2017) 14429. doi: 10.1038/ncomms14429
S.S. Zhang, J.Y. Chen, K. Li, et al., Chem. Mater. 33 (2021) 9708–9714. doi: 10.1021/acs.chemmater.1c03418
Y.W. Peng, C.S. Shan, H.J. Wang, et al., Adv. Energy Mater. 9 (2019) 1900597. doi: 10.1002/aenm.201900597
H.Q. Yin, L.L. Yang, H. Sun, et al., Chin. Chem. Lett. 34 (2023) 107337. doi: 10.1016/j.cclet.2022.03.060
X.Q. Huang, S. Liu, G. Liu, et al., Appl. Catal. B Environ. 323 (2023) 122134. doi: 10.1016/j.apcatb.2022.122134
Y. Zhang, X. Wang, Y. Wang, N. Xu, X.L. Wang, Polyoxometalates 1 (2022) 9140004. doi: 10.26599/pom.2022.9140004
H.B. He, G. Wang, S.C. Chai, et al., Chin. Chem. Lett. 32 (2021) 2013–2016. doi: 10.1016/j.cclet.2021.01.051
H.B. Wu, B.Y. Xia, L. Yu, X.Y. Yu, X.W. Lou, Nat. Commun. 6 (2015) 6512. doi: 10.1038/ncomms7512
J.S. Li, Y.J. Tang, C.H. Liu, et al., J. Mater. Chem. A 4 (2016) 1202–1207. doi: 10.1039/C5TA09743F
J.F. Ma, J. Yang, G.L. Zheng, et al., Polyhedron 23 (2004) 553–559. doi: 10.1016/j.poly.2003.10.002
M. Arıcı, O.Z. Yeşilel, M. Taş, H. Demiral, H. Erer, Cryst. Growth Des. 16 (2016) 5448–5459. doi: 10.1021/acs.cgd.6b00912
X.Y. Yu, L. Yu, H.B. Wu, X.W. Lou, Angew. Chem. Int. Ed. 127 (2015) 5421–5425. doi: 10.1002/ange.201500267
B. Nohra, H.E. Moll, L.M.R. Albelo, et al., J. Am. Chem. Soc. 133 (34) (2011) 13363–13374. doi: 10.1021/ja201165c
Q.Q. Pan, C.Y. Xu, X. Li, et al., Chem. Eng. J. 405 (2021) 126962. doi: 10.1016/j.cej.2020.126962
S.F. Wu, M.Y. Chen, W.W. Wang, et al., Carbon 171 (2021) 385–394. doi: 10.1016/j.carbon.2020.09.037
X. Li, L. Yang, T. Su, et al., J. Mater. Chem. A 5 (2017) 5000–5006. doi: 10.1039/C6TA10405C
J. Li, Y. Liu, X. Li, et al., Chem. Eng. J. 431 (2022) 133696. doi: 10.1016/j.cej.2021.133696
J. Li, X. Li, J. Sun, X.L. Hu, Z.M. Su, New J. Chem. 45 (2021) 9456–9461. doi: 10.1039/d1nj01096d
Q. Li, S. Zheng, M. Du, H. Pang, Chem. Eng. J. 417 (2021) 129201. doi: 10.1016/j.cej.2021.129201
L.N. Zhang, S.H. Li, H.Q. Tan, et al., ACS Appl. Mater. Interfaces 9 (2017) 16270–16279. doi: 10.1021/acsami.7b03823
W. Liu, X.T. Wang, F. Wang, et al., Nat. Commun. 12 (2021) 6776. doi: 10.1038/s41467-021-27118-6
T. Zhang, T.X. Yang, B. Li, S.H. Wei, W. Gao, Appl. Surf. Sci. 597 (2022) 153662. doi: 10.1016/j.apsusc.2022.153662
X. Wang, L.L. Yang, C.C. Xing, et al., Nanomaterials 12 (2022) 1098. doi: 10.3390/nano12071098

Figure 1 (a) The asymmetric unit diagram of OOCS-1. (b, c) The 2D structure diagram of OOCS-1.

Figure 2 (a) The asymmetric unit diagram of OOCS-2. (b, c) The 2D layer structure diagram of OOCS-2.

Figure 3 (a) The asymmetric unit diagram of OOCS-3. (b, c) The 3D layer structure diagram of OOCS-3.

Figure 4 (a) XRD pattern of Mo2C@C-3. (b) TEM images of Mo2C@C-3 (inset: the particle size distribution of Mo2C@C-3). (c) HRTEM images of Mo2C nanoparticles. (d-g) EDX mapping of Mo, C and N.

Figure 6 (a) Polarization curves of Mo2C@C-1-3 and Pt/C in 1.0 mol/L KOH. (b) Tafel slope plots of Mo2C@C-1-3 and Pt/C in 1.0 mol/L KOH. (c) CVs of Mo2C@C-3 with the scan rate ranging from 50 mV/s to 300 mV/s in 1.0 mol/L KOH. (d) Cdl values of Mo2C@C-1-3 in 1.0 mol/L KOH (Δj = ja - jc, ja and jc are the anodic and cathodic current densities, respectively). (e) Nyquist plots of electrochemical impedance spectra (EIS) of Mo2C@C-1-3 in 1.0 mol/L KOH. (f) Polarization curves of Mo2C@C-3 initially and after 2000 cycles in 1.0 mol/L KOH (Inset: Time-dependent current density curve of Mo2C@C-3 under the current density of 10 mA/cm2 for 24 h).

 扫一扫看文章

扫一扫关注我们
 DownLoad:

 下载:
下载:
