Table 1.
Retention time, MRM transitions and LODs/LOQs for PASHs.
Citation:
Yanhao Zhang, Yi-Jie Chen, Yuanyuan Song, Chuan Dong, Zongwei Cai. Atmospheric pressure gas chromatography-tandem mass spectrometry analysis of fourteen emerging polycyclic aromatic sulfur heterocycles in PM2.5[J]. Chinese Chemical Letters,
2021, 32(2): 801-804.
doi:
10.1016/j.cclet.2020.07.022

Atmospheric pressure gas chromatography-tandem mass spectrometry analysis of fourteen emerging polycyclic aromatic sulfur heterocycles in PM2.5
English
Atmospheric pressure gas chromatography-tandem mass spectrometry analysis of fourteen emerging polycyclic aromatic sulfur heterocycles in PM2.5
Abstract:
Research on pollution characteristics and toxicities of emerging polycyclic aromatic sulfur heterocycles (PASHs) in PM2.5 has not been reported due to the lack of analytical method with the needed performance. In the present study, a novel method for the determination of 14 PASHs in PM2.5 was developed using atmospheric pressure gas chromatography-tandem mass spectrometry (APGC-MS/MS). Atmospheric pressure chemical ionization was operated with multiple reaction monitoring in positive ionization mode. High sensitivity (method detection limit < 1.673 pg/m3), acceptable recoveries (67.6%–120.8%) and precisions (RSD of 2.2%–15.4%) were obtained. The method was successfully applied for analyzing PASHs in 10 PM2.5 samples collected from Taiyuan, a typical industrial city in China, in 2016. The total concentrations were from 929 pg/m3 to 14,593 pg/m3. The determined levels indicated that further investigations on environmental fate and toxicities of PM2.5-bound PASHs may be needed.
-
Air fine particulate matter (PM2.5) pollution now has been one of the most serious worldwide environmental problems. Small particle size of PM2.5 (aerodynamic diameter < 2.5 μm) allows its transportation into human body through respiratory system. A number of toxicological studies indicated that PM2.5 exposure could lead to different kinds of diseases such as lung cancers [1, 2] and cardiovascular diseases [3, 4]. The epidemiological researches also confirmed the adverse effects of PM2.5 and the relationship between human diseases and PM pollution. For example, the robust correlation was found between the worse air quality and infant mortality in several African countries [5].
The compositions of PM2.5 are extremely complex. It is believed that water soluble inorganic ions (F−, Cl−, Na+, K+, etc.), organic matters and water insoluble fractions (crustal elements/trace elements) are the major components in PM2.5 [6-11]. The adverse effects of PM2.5 were found to be significantly related to different particle compositions [6-13]. Therefore, analysis of the components is important for evaluating possible health influences induced by PM2.5 pollution. Among the different organic matters, polycyclic aromatic hydrocarbons (PAHs) have been studied for long time because of the high concentrations in PM2.5 and obvious toxicities [14, 15]. In our previous work, nitro-PAHs (NPAHs) in PM2.5 were also determined [16]. Compared to them, polycyclic aromatic sulfur heterocycles (PASHs) have not been extensively investigated on their pollution characteristics. The limited reports indicated that pure chemicals of dibenzothiophene (a typical PASH) could cause the inhibition of bacterial baseline respiration rate [17] and naphtho[1,2-b]thiophene (3-ring PASH) and phenanthrol[3,4-b]thiophene (4-ring PASH) could induce the mutagenicity [18]. However, the health effects of PM2.5-bound PASHs have not been reported yet. This is probably attributed to lack of the sensitive analytical method. Only a few reports on PASHs' analysis were published. High performance liquid chromatography (HPLC) was developed to measure 4,6-dimethyldibenzothiophene in water and soil [19]. Gas chromatography-time of flight mass spectrometry (GC-TOFMS) was applied for determination of dibenzothiophene and 3-methyldibenzothiophene in lichen [20]. Comprehensive two-dimensional GC coupled with TOFMS (GC×GC/TOFMS) was used for screening of several PASHs without quantification results [21, 22]. The existing methods do not meet the requirements for the determination of trace PASHs in the complicated PM2.5 samples. In order to investigate the contamination levels, pollution sources, toxicities and health effects, method development for multiple PM2.5-bound PASHs is necessary.
Recently, atmospheric pressure gas chromatography-tandem mass spectrometry (APGC-MS/MS) with atmospheric chemical ionization (APCI) source was found to have better performance in the analysis of some environmental organic pollutants such as NPAHs and hydroxy-PAHs than conventional gas chromatography-mass spectrometry (GC–MS) [16, 23-26]. In the present study, we developed an APGC-MS/MS method for the determination of 14 emerging PASHs in PM2.5. The method was validated and applied for the analysis of PM2.5 samples collected from Taiyuan, a city in northern China that suffers from serious PM2.5 pollution for long time.
PASH standards were obtained from commercial companies. Dibenzothiophene (DBT) was purchased from Supelco Inc., U. S. A.; tribenzothiophene (TBT), 1-methyldibenzothiophene (1-MDBT), 2-methyldibenzothiophene (2-MDBT), 4-methyldibenzothiophene (4-MDBT), 4,6- and 2,8-dimethyldibenzothiophene (4,6- and 2,8-DMDBT) were purchased from Tokyo Chemical Industry Co., Ltd, Japan; 3-methyldibenzothiophene (3-MDBT) in isooctane, 1,4-dimethyldibenzothiophene (1,4-DMDBT) in isooctane and 7-methylbenzo[b]naphtho[2,3-d]thiophene (7-M[2,3-d]T) in toluene were purchased from Chiron Inc. (Norway); benzo[b]naphtho[1,2-d]thiophene (BbN[1,2-d]T) and benzo[b]naphtho[2,3-d]thiophene (BbN[2,3-d]T) were purchased from LGC, U. K.; 2-nitrodibenzothiophene (2-NDBT) and 2,8-dinitrodibenzothiophene (2,8-DNDBT) were purchased from AccuStandard Inc., U. S. A. Pyrene- (PYR-) was purchased from CDN Isotopes Inc. (Canada) as an internal standard of PASHs. Dibenzothiophene- (DBT-d8) was purchased from Chiron Inc. (Norway) as a surrogate standard.
PM2.5 samples were collected at Shanxi University (37°47′42.70′′ N, 112°34′52.51′′ E) in Taiyuan, China in 2016. 10 samples were collected in November and December. ADS-2062E medium volume air sampler (AMAE (Shenzhen) Co., Ltd., China) and Quartz microfiber filters (Whatman, QMA, 90 mm diameter) were used for atmospheric PM2.5 collection. Daily sampling time was 23.5 h and air flowrate was 0.1 m3/min. After collection, the sampled filters were stored under −80 ℃ before analysis.
Ultrasonication was used as an extraction method for analysis of PM2.5-bound PASHs. One eighth of sample filter was cut into strips, and then the strips were put into 150 mL beaker. DBT-d8 (10 ng) was added as surrogate standard for quality control. Pure dichloromethane (DCM) (50 mL) was placed in the beaker for 60 min ultrasonic extraction twice (100 mL/120 min). The DCM extract was concentrated by rotary evaporation from 100 mL to near dryness. The concentrated sample extract was loaded onto a silica gel column chromatography (27 cm×1 cm ID) for purification. After sample loading, PASHs were eluted by 40 mL of hexane/DCM (1:4, v/v). The eluent was then concentrated to 1 mL and submitted to instrumental analysis. The whole extraction and purification process were shown in Fig S1 (Supporting information) and the detailed sample pre-treatment optimizations were listed in results and discussions.
The extracts were analyzed using Agilent 7890B gas chromatography (Agilent Technologies Inc., U. S. A.) equipped with Xevo TQ-S triple-quadrupole mass spectrometer (Waters Corporation., U. K.) under atmospheric pressure chemical ionization (APCI) in the positive mode. The values of the sample cone voltage and the corona pin current were 45 V and 5.0 μA, respectively. The detailed optimizations were listed in Fig S2 (Supporting information). Multiple reaction monitoring (MRM) was used for data acquisition. For GC parameters, 1 μL extract would be injected at 280 ℃ of the injector temperature. An Agilent DB-5MS capillary column (30 m × 0.25 mm ID × 0.25 μm) was applied for chromatographic separation. Carrier gas flow (Helium) was 2.0 mL/min. The initial GC oven temperature was 50 ℃ (hold time 1 min). Then the oven temperature would be increased to 300 ℃ at rate of 10 ℃/min and held for 5 min at final temperature. The critical MS conditions were optimized as described in results and discussion. Under the optimal instrumental conditions, high signal responses were obtained for target analytes and the method was successfully applied for the analysis of PASHs in PM2.5. 2-MDBT and 3-MDBT, which have the same retention time, were treated as a single compound (Table 1). All the other PASHs could be detected separately with this instrumental method.
Table 1
For achieving the accurate and sensitive analysis of PM2.5-bound PASHs, a great challenge is to separate and identify these positional isomers with similar structures, polarity and same molecular mass. Therefore, selection and optimization of appropriate analytical method are important. To obtain the good separation of PASHs, chromatographic parameters of APGC-MS/MS, such as capillary separation column, carrier gas flow and oven temperature program were firstly optimized and described in experimental section. Based on the optimal parameters, better separation of 14 PASHs could be achieved except 2-MDBT and 3-MDBT were overlapped (Table 1).
MRM acquisition method was used for the MS quantitative analysis of 14 PASHs. Based on the optimized APCI parameters, it was found that the protonated molecule, [M+H]+ ion, was the precursor ion with the most intense response for the PASHs (Table 1). Compared to other compounds reported in previous APGC-MS analyses [23, 24], in which the most intense ions were the molecule ions ([M]+·), this phenomenon was due to the higher electronegativity of sulfur than other elements' in the compounds. Because of sulfur's high electronegativity, the electron density in the location of sulfur is higher than near other atoms in PASHs, and the sulfur becomes protonated easily in an APCI source. Various collision energies, from 10 V to 50 V, were tested to select the product ions with the highest and second highest intensities in order to construct the quantification and identification MRM transitions for 14 PASHs (Table 1). The best collision energies for each PASH MRM transition were also listed in Table 1.
For sample preparation, ultrasonic extraction is a time-saving extraction method for persistent organic pollutants in different matrices and was used in this work. Considering the polarity of 14 target PASHs, dichloromethane (DCM) was used for PM2.5 sample extraction. The detailed extraction method was listed in experimental section. In this work, silica gel column (27 cm×1 cm ID) chromatography was used for sample purification followed by rotary evaporation. Type/volume of eluent and usage of silica gel were included in optimization.
Due to the target compounds have both relatively low-medium polar (e.g., DBT) and medium-high polar (e.g., 2,8-DNDBT) PASHs, different mixture ratios (v/v) of hexane (low polar solvent) and DCM (medium polar solvent), such as 1:1,2:3, 3:2, 1:4 and 4:1, were tested on silica gel chromatography for elution of pure 10 ng PASHs mixture standard without normal extraction and rotary evaporation. To reduce possible negative effects, a large volume (100 mL) of eluent and a medium amount of silica gel (4 cm) were used. The results were listed in Fig S3 (Supporting information). From the figure, it was found that when high ratio of hexane was used, the recoveries of most PASHs had decline. The elution performances of 14 target PASHs were the best with hexane/DCM (1:4, v/v). The recoveries were between 71.1% (1,4-DMDBT) and 95.6% (1-MDBT). The elution volume was also optimized among 10, 20, 30, 40 and 50 mL, and finally 40 mL was chosen (Fig S4 in Supporting information).
The usage of silica gel is also optimized for separation and purification. Moderate usage of silica could guarantee clean-up performance and low target loss. The performances of 2, 4, 8 cm columns of silica gel were investigated (Fig S5 in Supporting information) using 40 mL hexane/DCM (1:4, v/v) for elution of 10 ng of PASHs standard mixture. From the results, column packed with 2 cm and 8 cm silica gel did not have acceptable performances. 8 PASHs (2 cm) and 7 PASHs (8 cm) had elution recoveries lower than 50%. For 2 cm packed silica gel column, most analytes may be lost in the waste and could not be retained during sample loading because the thickness of silica gel was too small. In contrast, too much packed silica gel may lead to difficulty in elution of PASHs. Therefore, a 4 cm packed silica gel column chromatography was selected finally with acceptable elution and purification performances (total elution recoveries > 72.5%).
Method validations were then performed to confirm the reliability of the developed method for the analysis of PASHs in PM2.5. The calibration curves of each PASH were established, except for 2-MDBT and 3-MDBT were combined as one because of their identical retention time. The linear ranges were between 0.1 ng/mL and 10 ng/mL, and the regression coefficients (R2) were better than 0.99, except for 4,6-DMDBT and 1,4-DMDBT (R2 > 0.98) (Table 2).
Table 2
Method accuracies and matrix effects were validated by recoveries of standard addition. Five duplicates were used. One eighth of blank PM2.5 sample filters were spiked with mixed PASH standards with low (0.1 ng) and high (10 ng) dosage. Then the spiked samples were treated and analyzed by sample preparation and instrumental analytical methods. As shown in Table 2, the recoveries of PASHs were acceptable, lying between 67.6% ± 3.3% (2,8-DMDBT) and 120.8% ± 4.6% (2-NDBT). The precision of the method was validated by the relative standard deviation (RSD) (Table 2) and the range was from 2.2% (4,6-DMDBT and 7-M[2,3-d]T) to 15.4% (2-NDBT), indicating the method stability was sufficiently reliable for sample analysis.
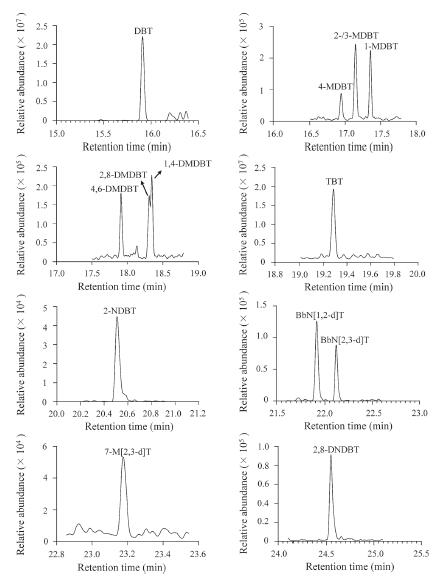
The instrumental limit of detection (LOD) and limit of quantification (LOQ) were defined as three and ten times the signal to noise ratio (S/N) respectively of PASHs. The method LOD and LOQ were calculated by considering the air flowrate (0.1 m3/min) and total sampling duration of the air samplers (23.5 h). Their values were listed in Table 1. The instrumental LODs ranged from 0.92 pg/mL (2,8-DNDBT) to 29.5 pg/mL (1,4-DMDBT) and the method LODs were from 0.052 pg/m3 (2,8-DNDBT) to 1.673 pg/m3 (1,4-DMDBT). In fact, there were few reports about the determination method of PASHs in different environmental matrices, especially PM2.5. Studabaker et al. reported determination of DBT and 2-MDBT in lichen using GC-TOFMS and their instrumental LODs were on the level of ng/mL [20]. Yu et al. used HPLC to measure 4,6-DMDBT in lake water and soil [19]. The instrument LOD of APGC-MS/MS method for the compound (12.2 pg/mL) was about eight times lower than the value of HPLC method (0.103 ng/mL) (Table 1). Although there were rare works about measurements of environmental PASHs, some methods were developed for determination of PASH in coal and petroleum because sulfur content is an important index to the character of fossil matters. Yang et al. used GC–MS to determine PASHs in crude oil [27]. Wilson et al. developed normal phase LC (NPLC) to analyze PASHs in coal tar [28]. Their instrumental LODs were all at levels of ng/mL. The method in this work could provide higher sensitivities than those of previous approaches. The APGC-MS/MS method was successfully applied for the preliminary analysis of 14 emerging PASHs in PM2.5 collected from Taiyuan, China in November and December in 2016. The chromatograms of real sample were shown in Fig. 1. It could be seen that PASHs could be sensitively determined and well separated, which indicated the developed method was robust and useful. The ambient concentrations of PM2.5-bound PASHs were shown in Table 3. Recoveries of surrogate standards (75% ± 8%) were also listed in the table for quality control. All PASHs could be detected in PM2.5 samples collected from Taiyuan (Table 3). The atmospheric concentrations of individual PM2.5-bound PASH ranged from 4.1 pg/m3 (2-NDBT) to 2964 pg/m3 (4-MDBT). The concentration ranges of ∑PASHs were between 929 pg/m3 and 14,593 pg/m3. The average atmospheric concentrations for most of the PM2.5-bound PASHs, except 2-NDBT, 7-M[2,3-d]T and 2,8-DNDBT, were at ng/m3. Compared to the existing organic pollutants in PM2.5, such as PAHs/NPAHs determined in our previous work [16], polybrominated dipheyl ethers (PBDEs) and dioxins [23, 29], the contamination levels of PASHs were not low. Previous researches have proved that some PASHs, like DBT, could induce toxicities [17, 18] so that the PASHs in PM2.5 may also lead to health concerns when large dosage of them were inhaled by human. Therefore, comprehensive investigations on pollution status and health risks of PASHs may be needed based on the data from more PM2.5 samples.
Figure 1
 Figure 1. APGC-MS/MS chromatograms of PASHs in real PM2.5 sample.
Table 3
In conclusion, a novel APGC-MS/MS method was developed and applied for the preliminary analysis of PASHs in PM2.5 from Taiyuan, a typical industrial city in China. The method filled the gap of the accurate quantification of emerging PASHs in PM2.5. The developed method could be applied for supporting further researches on environmental distributions, pollution sources and human health risks of PM2.5-bound PASHs. Given the detected high levels, more investigations on the potential health concerns induced by PM2.5-bound PASHs may be needed.
Declaration of competing interest
The authors declare that they have no known competing financial interests or personal relationships that could have appeared to influence the work reported in this paper.
Acknowledgments
We thank financial support from the National Natural Science Foundation of China (Nos. 91843301 and 91543202), National Key Research and Development Program Cooperation on Scientific and Technological Innovation in Hong Kong, Macau and Taiwan (No. 2017YFE0191000).
Appendix A. Supplementary data
Supplementary material related to this article can be found, in the online version, at doi:https://doi.org/10.1016/j.cclet.2020.07.022.
* Corresponding author at: State Key Laboratory of Environmental and Biological Analysis, Department of Chemistry, Hong Kong Baptist University, Hong Kong SAR, China.
E-mail address: zwcai@hkbu.edu.hk (Z. Cai).
-
-
[1]
X. Han, Y. Liu, H. Gao, et al., Sci. Total Environ. 607-608 (2017) 1009-1017. doi: 10.1016/j.scitotenv.2017.07.061
-
[2]
S. Taghvaee, M.H. Sowlat, M.S. Hassanvand, et al., Environ. Int. 120 (2018) 321-332. doi: 10.1016/j.envint.2018.08.003
-
[3]
W. Hu, G.S. Downward, B. Reiss, etal., Environ. Sci. Technol. 48 (2014) 8456-8464. doi: 10.1021/es502201s
-
[4]
C.A. Pope III, R.T. Burnett, M.C. Turner, et al., Environ. Health Perspect. 119 (2011) 1616-1621. doi: 10.1289/ehp.1103639
-
[5]
S. Heft-Neal, J. Burney, E. Bendavid, M. Burke, Nature 559 (2018) 254-258. doi: 10.1038/s41586-018-0263-3
-
[6]
X. Wang, X. Bi, G. Sheng, J. Fu, Environ. Monit. Assess. 119 (2006) 425-439. doi: 10.1007/s10661-005-9034-3
-
[7]
Q. Chen, X.S. Luo, Y. Chen, et al., Chemosphere 230 (2019) 424-431. doi: 10.1016/j.chemosphere.2019.04.226
-
[8]
D. Huang, G. Xiu, M. Li, X. Hua, Y. Long, Atmos. Environ. 148 (2017) 175-181. doi: 10.1016/j.atmosenv.2016.10.036
-
[9]
J. Lang, Y. Zhang, Y. Zhou, et al., Aerosol Air Qual. Res. 17 (2017) 412-425. doi: 10.4209/aaqr.2016.07.0307
-
[10]
V. Martins, T. Moreno, M.C. Minguillon, etal., Environ. Pollut. 208 (2016) 125-136. doi: 10.1016/j.envpol.2015.07.004
-
[11]
W. Wen, X. Ma, P. Wei, et al., Aerosol Air Qual. Res. 18 (2018) 1720-1733. doi: 10.4209/aaqr.2017.10.0406
-
[12]
Y. Zhang, Z. Yang, Q. Zhang, et al., Chin. Chem. Lett. 26 (2015) 157-159. doi: 10.1016/j.cclet.2014.08.004
-
[13]
L. Zhang, T. Xu, Z. Pi, Chin. Chem. Lett. 30 (2019) 90-94. doi: 10.1016/j.cclet.2017.11.019
-
[14]
M. He, T. Ichinose, M. Kobayashi, et al., Toxicol. Appl. Pharmacol. 297 (2016) 41-55. doi: 10.1016/j.taap.2016.02.017
-
[15]
A. MohseniBandpi, A. Eslami, A. Shahsavani, F. Khodagholi, A. Alinejad, Sci. Total Environ. 593-594 (2017) 182-190. doi: 10.1016/j.scitotenv.2017.03.150
-
[16]
R. Li, X. Kou, H. Geng, C. Dong, Z. Cai, Chin. Chem. Lett. 25 (2014) 663-666. doi: 10.1016/j.cclet.2014.03.032
-
[17]
L. Alves, S.M. Paixao, Bioresour. Technol. 102 (2011) 9162-9166. doi: 10.1016/j.biortech.2011.06.070
-
[18]
R.A. Pelroy, D.L. Stewart, Y. Tominaga, et al., Mutat. Res. 117 (1983) 31-40. doi: 10.1016/0165-1218(83)90150-7
-
[19]
C. Yu, Z. Yao, B. Hu, Anal. Chim. Acta 641 (2009) 75-82. doi: 10.1016/j.aca.2009.03.031
-
[20]
W.B. Studabaker, K.J. Puckett, K.E. Percy, M.S. Landis, J. Chromatogr. A 1492 (2017) 106-116. doi: 10.1016/j.chroma.2017.02.051
-
[21]
G. Becker, A. Colmsjo, C. Ostman, Environ. Sci. Technol. 33 (1999) 1321-1327. doi: 10.1021/es981151t
-
[22]
M. Grung, A. Kringstad, K. Baek, et al., J. Hazard. Mater. 323 (2017) 36-44. doi: 10.1016/j.jhazmat.2016.05.036
-
[23]
Y. Zhang, Y. Chen, R. Li, et al., Talanta 195 (2019) 757-763. doi: 10.1016/j.talanta.2018.12.006
-
[24]
Y. Zhang, R. Li, J. Fang, C. Wang, Z. Cai, Chemosphere 198 (2018) 303-310. doi: 10.1016/j.chemosphere.2018.01.131
-
[25]
W. Zhang, Y. Zhang, Q. Jiang, et al., Anal. Chem. 88 (2016) 10523-10532. doi: 10.1021/acs.analchem.6b02583
-
[26]
Y. Pan, Z. Deng, Y. Chen, et al., Anal. Methods 9 (2017) 5763-5768. doi: 10.1039/C7AY01421J
-
[27]
B. Yang, W. Hou, K. Zhang, X. Wang, J. Sep. Sci. 36 (2013) 2646-2655. doi: 10.1002/jssc.201300184
-
[28]
W.B. Wilson, H.V. Hayes, A.D. Campiglia, S.A. Wise, Anal. Bioanal. Chem. 410 (2018) 4177-4188. doi: 10.1007/s00216-018-1065-z
-
[29]
Y. Chen, Y. Chen, Y. Zhang, et al., Talanta 194 (2019) 320-328. doi: 10.1016/j.talanta.2018.10.025
-
[1]
-

 DownLoad:


 下载:
下载:
 扫一扫看文章
计量
- PDF下载量: 17
- 文章访问数: 2655
- HTML全文浏览量: 268
