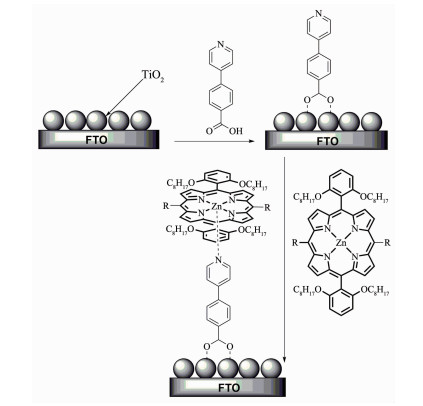
Figure 1.
Self-assembly of A (4-pyrid-4-ylbenzoic acid) with P2 or P3
Self-Assembly with Zinc Porphyrin Antenna for Dye-Sensitized Solar Cells
Hai-Lang JIA , Zhi-Jie PENG , Shan-Shan LI , Bing-Quan GONG , Ming-Yun GUAN

In recent years, the rapid development of economy has also brought about serious environmental pollution and energy shortage, and people show more and more interest in the development and utilization of new energy. New energy has incomparable advantages compared with traditional energy, such as abundant sources, easy development, environmental friendliness, recycling and so on. Among them, solar energy has great application potential, it has become one of the important areas of new energy[1-2]. Many researchers are devoted to the research of DSSCs (dye-sensitized solar cells), the DSSCs have many advantages compared with traditional energy, such as low cost, simple fabrication process, wide source of raw materials, multi-color transparency, high photoelectric conversion efficiency and environmental friendliness[3-5]. After more than 20 years of development, DSSCs have made great progress, up to now, the device of ADEKA-1 exhibited the highest PCE of 14.3%[6].
Dyes play an important role in DSSCs, due to TiO2 is a wide band material, it can only absorb ultraviolet rays and the utilization of sunlight is very low, on the contrary, dyes can broaden the absorption of DSSCs to visible and even near infrared regions[7-8]. So far, many research groups have designed and synthesized many new dyes. Generally speaking, ideal dyes need to meet the following conditions: (1) dyes can absorb sunlight in visible and even infrared regions, (2) dyes contain carboxyl (-COOH), sulfonic acid (-SO3H), phosphoric acid (-PO3H2), pyridine and other anchoring groups, (3) high quantum efficiency, (4) the excited state energy level of dyes should match the conduction level of TiO2, (5) dyes should have high oxidation potential and high regeneration efficiency, (6) dyes have good stability and can be recycled 105 times[9-12]. So far, there are two kinds of efficient dyes for DSSCs, metal complexes and metal-free organic dyes[13-16]. Many excellent dyes have been prepared, the PCE of some of these dyes has exceeded 10%[17-20]. In 2005, ruthenium complex dye N719 was prepared, the PCE of N719 achieved 11.18%[21]. In 2010, Wang prepared ruthenium complex C106, the value of PCE was up to 11.7%[22]. In addition, many metalloporphyrin dyes have excellent photoelectric properties, Grätzel and co-workers reported an excellent porphyrin dye YD2-o-C8, the PCE of the device reached 12.3%[23-27]. In 2014, Grätzel and co-workers synthesized a more efficient dye SM315, under the condition of using cobalt-based redox electrolyte, the PCE of the device was up to 13%[28]. Organic dyes have also developed rapidly, these dyes have good application prospects, which has obvious advantages compared with metal complexes, such as easy modification, low price, good plasticity and easy degradation[29-32]. Some excellent dyes have been successfully prepared, such as C275, DTS-CA, HL7[33-35].
Nevertheless, this is still far from the theoretical efficiency (33%), how to achieve higher PCE on the basis of the previous is a major challenge for DSSCs. Many dyes require complex synthetic steps, which have been troubling researchers, in addition, the monolayer structure of dye molecules always restricts the development of DSSCs, thus, we need to develop some new structures and methods. Construction of multilayer dyes by supramolecular self-assembly strategy may be a promising way to improve the performance of DSSCs. The method is easy to operate, by adjusting the antenna molecules and anchoring groups, the light-harvesting ability of dyes can be improved and charge recombination can be reduced, and complex synthesis is not required[36-38]. What′s more, the amount of dye adsorbed will not decrease, this may change the limitation of monolayer dyes of DSSCs. Saha and co-workers used ZnPc and PyPMI as antenna molecules and anchoring groups, respectively, after supramolecular self-assembly, the PCE of PyPMI-ZnPc was 3 times than that of device of PyPMI[39].
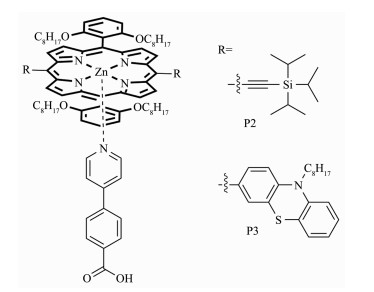
Hererin, we prepared two antenna molecules zinc porphyrin P2 and P3. The zinc porphyrin was choosed as antenna molecule due to its excellent photoelectric properties, which has good absorption in a range of 400~450 nm (Soret band) and 500~700 nm (Q band), this will be very helpful to improve the light-harvesting ability of devices. 4-Pyrid-4-ylbenzoic acid (A) was used as the anchoring group, which can coordinate with zinc porphyrin, after supramolecular self-assembly, the DSSCs based on A-P show obvious photovoltaic performance. The device of A-P2 exhibited the PCE of 1.68%, and the Voc is 526 mV, the Jsc is 5.39 mA·cm-2, which is better than that of A-P3. We also studied the optical properties, electrochemical properties, photovoltaic performance to analyze the differences between them.
The structures of P2, P3 were shown in Fig. 1, and the synthesis method of the two antenna molecules was shown in Fig. 2. All solvents were treated by standard methods before use and all chemicals were purchased from commercial suppliers and used without further purification unless indicated otherwise. The 1H NMR were recorded on a Bruker DRX NMR spectrometer with tetramethylsilane (TMS) as the internal standard.
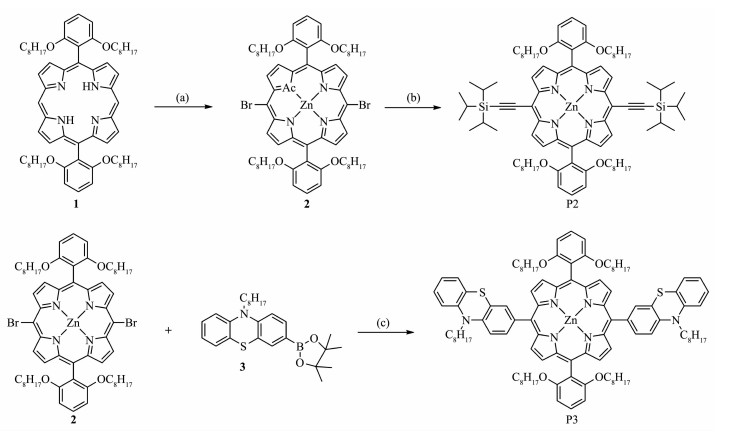
Reagents and conditions: (a) NBS, Zn(OAc)2·2H2O, (b) triisopropylacetylene, Pd(PPh3)2Cl2, CuI, THF, Et3N, (c) Pd(PPh3)4, K2CO3, H2O
The compound 1 (2.00 g, 2.05 mmol) was were dissolved in DCM (500 mL), then the temperature is cooled to 0 ℃, and the NBS (0.75 g, 4.20 mmol, in 30 mL DCM) was dropped slowly. After 6 h, the mixture was quenched with acetone, and evaporated in vacuo. Then the residue was dissolved in DCM (200 mL) and MeOH (100 mL), the Zn(OAc)2·2H2O (2.25 g, 10.25 mmol) was added, the mixture was stirred at room temperature for 2 h. The mixture was washed with brine, dried over MgSO4, and evaporated in vacuo. The residue was purified by silica gel column chromatography (VPE:VEA=10:1) to give compound 2 (1.83 g, 75%). 1H NMR (CDCl3, 500 MHz): δH 9.66~9.67 (m, 4H), 8.92~8.95 (m, 4H), 7.72 (t, J=8.5 Hz, 2H), 7.02 (d, J=8.5 Hz, 4H), 3.86 (t, J=6.0 Hz, 8H), 0.96~0.99 (m, 8H), 0.80~0.84 (m, 8H). 0.38~0.63 (m, 44H).
A mixture of compound 2 (1.00 g, 0.84 mmol), triisopropylacetylene (0.46 g, 2.51 mmol), CuI (32 mg, 0.17 mmol) in THF (60 mL) and Et3N (10 mL). Then the Pd(PPh3)2Cl2 (0.20 g) was added under N2, the mixture was heated under 80 ℃ for overnight. The reaction mixture was cooled to room temperature and evaporated in vacuo. The residue was purified by silica gel column chromatography (VDCM:VPE=1:4) to give P2 (0.71 g, 61%). 1H NMR (CDCl3, 500 MHz): δH 9.66 (d, J=4.5Hz, 4H), 8.87 (d, J=4.5 Hz, 4H), 7.69 (t, J=8.5 Hz, 2H), 7.00 (d, J=6.0Hz 4H), 3.85 (t, J=6.0 Hz, 8H), 1.45~1.51 (m, 42H), 0.92~0.98 (m, 8H), 0.80 ~0.84 (m, 8H). 0.39~0.63 (m, 44H).
Under nitrogen, compound 2 (100 mg, 84 μmol), compound 3 (110 mg, 250 μmol), K2CO3 (46 mg, 334 μmol) and Pd(PPh3)4 (30 mg) were dissolved in 1, 4-dioxane (30 mL) and H2O (5 mL). The mixture was heated under 90 ℃ for overnight. The reaction mixture was cooled to room temperature and extracted by DCM (3×30 mL). The combined organic layers were washed with brine, dried over MgSO4, and evaporated in vacuo. The residue was purified by silica gel column chromatography (VDCM:VPE=1:4) to give P3 (101 mg, 73%). 1H NMR (CDCl3, 400 MHz): δH 8.76~8.83 (m, 8H), 7.93~7.97 (m, 4H), 7.64~7.68 (m, 2H), 7.22 ~7.28 (m, 3H), 7.16 (d, J=8.4 Hz, 2H), 6.96~7.04 (m, 9H), 4.08 (t, J=7.2 Hz, 4H), 3.80 (t, J=6.4 Hz, 8H), 2.01 ~2.08 (m, 4H), 1.55~1.63 (m, 4H), 1.26~1.47 (m, 16H), 0.83~0.97 (m, 24H), 0.68~0.73 (m, 8H), 0.45~0.59 (m, 34H).
The working electrode (active area is 0.196 cm2) was prepared by screen printing the TiO2 paste on Fluorine-doped tin oxide (FTO) glass plates (15 Ω·m-2). For preparation of a DSSC, FTO glass plates were cleaned in a detergent solution using an ultrasonic bath for 30 min for two times and then rinsed with water and ethanol. Then, the plates were immersed into 40 mmol·L-1 TiCl4 (aqueous) at 70 ℃ for 30 min and washed with water and ethanol. The TiO2 paste consisted of 12 μm thick film (particle size, 20 nm, pore size 32 nm). The TiO2 films were performed with a programmed procedure: (1) 80 ℃ for 15 min; (2) 135 ℃ for 10 min; (3) 325 ℃ for 30 min; (4) 375 ℃ for 5 min; (5) 450 ℃ for 15 min, and (6) 500 ℃ for 15 min. Then the films were treated again with TiCl4 at 70 ℃ for 30 min and sintered at 500 ℃ for 30 min. Then the electrode was immersed into 2 mmol·L-1 A solution (methanol) for 2 h at room temperature, then rinsed with ethanol, and then was immersed into 1 mmol·L-1 P solution (VTHF:VEtOH=4:1) for 18 h to form supramolecules on the TiO2 surface and dried in air. The working electrode and the Pt counter electrode were then sealed with a Surlyn film (25 μm) by heating the sandwich-type cell at 110 ℃. The electrolyte was introduced through pre-drilled holes in the counter electrode and was driven into the cell via vacuum backfilling, and the hole was sealed with a Surlyn film and a thin glass (0.1 mm thickness) cover by heating. The electrolyte was composed of 0.6 mol·L-1 1-butyl-3-methylimidazolium iodide (BMII), 50 mmol·L-1 I2, 50 mmol·L-1 LiI, 0.5 mol·L-1 tert-butylpyridine and 0.1 mol·L-1 guanidiniumthiocyanate (GuNCS) in acetonitrile.
The photocurrent-voltage (I-V) curves of the DSSCs were measured on a Keithley 2400 source meter under standard global AM 1.5G solar irradiation supplied by a xenon light source (Oriel). The incident photo-to-electron conversion efficiency (IPCE) spectra of the DSSCs were measured by a DC method. The light source was a 300 W xenon lamp (Oriel 6258) coupled with a flux controller to improve the stability of the irradiance. The single wavelength was selected by a monochromator (Cornerstone 260 Oriel74125). Light intensity was measured by a NREL traceable Si detector (Oriel 71030NS) and the short circuit currents of the DSSCs were measured by an optical power meter (Oriel 70310).
The UV-Vis absorption spectra were recorded on a Shimadzu UV-3600 spectrometer. The cyclic voltammograms (CV) of the dyes and electrochemical impedance spectroscopy (EIS) were studied using a Chenhua CHI760E model Electrochemical Workstation (Shanghai). The amounts of dye loading were estimated according to the following methods: the sensitized electrodes were immersed into a 0.1 mol·L-1 NaOH solution in a mixed solvent (VH2O:VTHF=1:4), which resulted in desorption of each dye. The amounts of dye loading can be estimated according to the following formula: C=AV/(εS), where C stands for the amounts of dye loading, A is optical absorbance of the dye, V is volume of desorption solution, ε is molar extinction coefficients, S is effective area of TiO2 films.
As shown in Fig. 3a, we measured the absorption spectra of P2 and P3 in DCM. It is obvious that all the antenna molecules show standard porphyrin absor-ption peaks, they have characteristic absorption in the range of 400~450 nm (Soret band) and 500~700 nm (Q band), the band of 400~700 nm can be attributed to electronic transitions from π-π* and intramolecular charge transfer (ICT). The antenna molecule porphyrin P2 displays high absorption coefficient (2.26×10⁵ L·mol-1·cm-1) at 438 nm in Soret band, and medium absorption coefficient at 580 nm (8.20×10³ L·mol-1·cm-1) and 631 nm (2.20×10⁴ L·mol-1·cm-1), respectively. From this, we can see that antenna molecule P2 has good spectral response in visible region, this in favor of enhancing the light-harvesting capability of dyes, thereby increasing Jsc (short-circuit current density) of DSSCs. When the R group is replaced by phenothiazine, the absorption spectrum of P3 shows a slight hypsochromic-shift compared with P2, this may be due to the non-planar steric effect between porphyrin ring and phenothiazine. The antenna molecule porphyrin P3 displays high molar extinction coefficient (2.39×10⁵ L·mol-1·cm-1) at 436 nm, with medium absorption coefficient at 567 nm (1.16×10⁴ L·mol-1·cm-1) and 614 nm (1.12×10⁴ L·mol-1·cm-1), respectively.
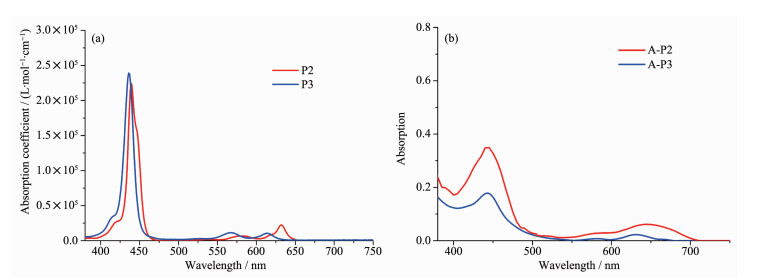
In order to study the changes of absorption spectra, we further measured the spectral response performance of the three supermolecules anchored on 12 μm TiO2 films (Fig. 3b). As shown in Fig. 4, The TiO2 film was first immersed into 2 mmol·L-1 A solution for 2 h at room temperature and rinsed with ethanol, then was immersed into 1 mmol·L-1 P solution to form supramolecules on the TiO2 surface and dried in air. From Fig. 3b, we can see that the absorption spectra have changed a lot compared with those of P2, P3 in DCM, the absorption spectra have been significantly improved, their absorption ranges all are over 650 nm, even up to 700 nm. This indicates that the light-harvesting ability of dyes has been improved greatly after supramolecular self-assembly, this will improve the Jsc of the DSSCs. From Fig. 3a, we can see that there is little difference in spectral response between P2 and P3, after self-assembly, the absorption spectrum of A-P2 was obviously better than that of A-P3, we infer that this should be attributed mainly to the difference in the antenna molecules loading amounts. To better analyze the differences between their absorption spectra, the amounts of dye loading were further measured. After self-assembed with porphyrin chromophores, the value of loading amount of P2 is about 1.12×10⁻⁸ mol·cm-2, and the value of P3 is only about 0.51×10⁻⁸ mol·cm-2, the largest loading amount of P2 can enhance the light-harvesting ability of the device well.
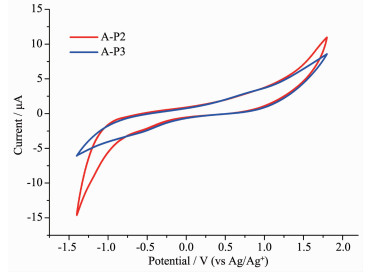
In the process of dye design, the excited state energy level of dyes should match the conduction level of TiO2, and dyes should have high oxidation potential and high regeneration efficiency[40-41]. In order to study the related properties, we measured the cyclic voltammetry curves of A-P2 and A-P3 anchored on TiO2 (Fig. 5). As shown in Fig. 5, the EOX (ground state oxidation potentials) of A-P2 and A-P3 were 0.93 and 0.79 V (versus NHE), respectively. As we known, the redox potential of the I-/I3- is 0.4 V, while the EOX of the two supramolecules all are much positive than 0.4 V, the result indicates that the oxidized dyes can be effectively recycled. We estimated the energy gap (E0-0) by their absorption spectra, and the values of A-P2 and A-P3 are 1.77 and 1.82 eV, respectively. Thus, the excited oxidation potentials (EOX*) of A-P2 and A-P3 are -0.84 and -1.03 V, respectively. They are all negative than the conduction band of TiO2 (-0.5 V versus NHE), this indicates that the electron from the excited dyes of A-P2 and A-P3 all have high electron injection efficiency[42-43].
In DCM, 0.1 mol·L-1 TBAPF6, photoanode as working electrode, Pt as counter electrode, Ag/Ag+ as reference electrode, scan rate: 100 mV·s-1, calibrated with ferrocene/ferrocenium (Fc/Fc+) as an external reference
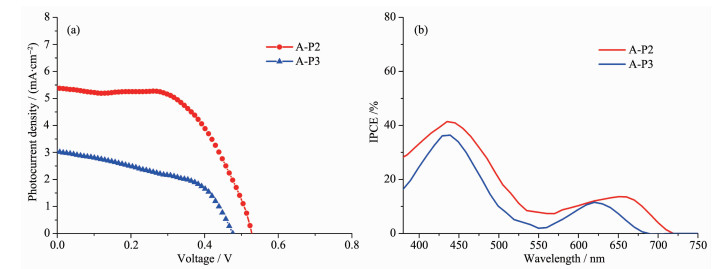
The photovoltaic performance of the devices based on supramolecular self-assembly were measured, the J-V (photocurrent-density-photovoltage) curves of the devices were measured (Fig. 6), and Table 1 shows the related parameters. As designed, the antenna molecules P2, P3 can coordinate with the anchoring groups (A) to form supermolecules A-P2 and A-P3, after self-assembly, the DSSCs based on these supermolecules exhibit remarkable photovoltaic performance. The device of A-P2 shows the highest PCE of 1.68%, with a value of Voc is 526 mV, a value of Jsc is 5.39 mA·cm-2, and a value of FF is 59.20%. Compared with A-P2, the performance of A-P3 has slightly decreased, the PCE droped down to 0.79%. The main reason is that the Voc decreased from 526 to 478 mV and the Jsc decreased from 5.39 mA·cm-2 to 3.02 mA·cm-2. In addition, the loading amounts of P2, P3 have been measured, and the value of P2 (1.12×10⁻⁸ mol·cm-2) is much higher than that of P3 (0.51×10⁻⁸ mol·cm-2). We can see that the loading amount has a great influence on the performance of DSSCs, the highest loading amount of P2 can make up for the deficiency of spectral response, this will not only enhance the light-harvesting capability of devices, on the other hand, close alignment of antenna molecules may can effectively prevent the I3- penetrating into the TiO2 surface, thus, the charge recombination can be reduced.
 下载:
导出CSV
下载:
导出CSV
| Dye | Jsc/(mA·cm-2) | Voc/V | FF/% | η/% |
| A-P2 | 5.39±0.02 | 0.526±0.000 | 59.20±0.73 | 1.68±0.02 |
| A-P3 | 3.02±0.01 | 0.478±0.001 | 54.48±0.40 | 0.79±0.00 |
| Size of the active area for each cell is 0.196 cm2, three devices are assembled in parallel with each dye, the DSSCs were all measured under standard global AM 1.5G solar irradiation. | ||||
We find that the Jsc of these DSSCs decreases in turn along the following trend: A-P2 (5.39 mA·cm-2) > A-P3 (3.02 mA·cm-2). The incident photon-to-current conversion efficiency (IPCE) spectra of the DSSCs were measured to analysis the differences. From Fig. 6b, the IPCE curves of A-P2 exhibited the highest value of 41.9% at 437 nm, and the photocurrent generation up to about 720 nm. The IPCE curves of A-P3 exhibited the photocurrent generation up to about 680 nm, the value at 434 nm was only 36.5%. In the long wave region, we also found that photocurrent of A-P2 was better than that of A-P3, this should be attributed to the larger loading amount of A-P2.
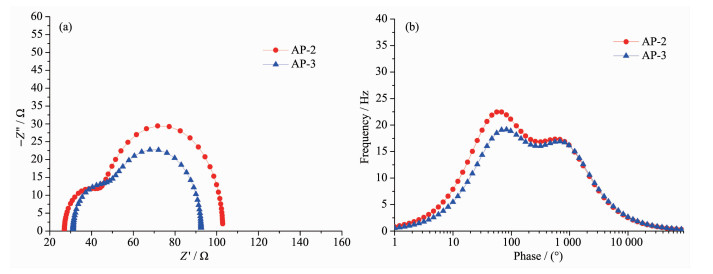
Electrochemical Impedance Spectroscopy (EIS) is an important method for studying the charge transfer properties at the interface of DSSCs, in this work, we measured the EIS to analyze charge recombination dynamics under dark[44-47]. As we known, the charge recombination rate has an important influence on Voc. The EIS was measured under the applied voltage of -0.6 V to analyze the difference between Voc. From Fig. 7, two semicircles were found in the plots, the small semicircle means the transport resistance at the Pt/electrolyte, and the large semicircle means the charge transfer resistance at the TiO2/dye/electrolyte interface. We can see that the radius of the large semicircle of A-P2 is larger than that of A-P3, this means that the device of A-P2 effectively reduces the electron recombination rate after self-assembly, it is conducive to suppressing dark current and improving Voc, this also explains why Voc of A-P2 has the largest value of 526 mV. In addition, the electron lifetimes of the DSSCs were further measured by bode phase plots. The DSSC with longer electron lifetime indicates that there will be low dark current for the device, this helps to enhance the Voc. The peak frequency (f) at lower frequency region can be readed from Fig. 7b, and the electron lifetime (τ) can be calculated by τ=1/(2πf)[48-49]. The f of A-P2 and A-P3 are 63.2 and 76.5 Hz, respectively. As a result, the electron lifetime values of A-P2 and A-P3 are 2.51 and 2.08 ms, respectively. The trend is consistent with the Voc of DSSCs.
In summary, we used a simple method to improve the performance of DSSCs, two antenna molecules zinc porphyrin P2, P3 were prepared and then self-assembly was carried out by coordination with anchoring group (A, 4-pyrid-4-ylbenzoic acid). This method shows obvious advantages, it can avoid complex synthesis steps and improve the light-harvesting ability of dyes and reduce charge recombination by adjusting the antenna molecules and anchoring groups. After supramolecular self-assembly, the device of A-P2 showed a PCE of 1.68%, and a Voc of 526 mV, a Jsc of 5.39 mA·cm-2, and a FF of 59.20%, in contrast, the device of A-P3 showed a PCE of 0.79%, the main reason should be that the different structures of antenna molecules lead to different loading amount. The results show that self-assembly strategy has been successfully used in this work, this will be a potential and effective way to improve the performance of DSSCs.
Ardo S, Meyer G J. Chem. Soc. Rev., 2009, 38:115-164 doi: 10.1039/B804321N
Wu J, Lan Z, Lin J, et al. Chem. Rev., 2015, 115:2136-2173 doi: 10.1021/cr400675m
杨英, 潘德群, 高菁, 等.无机化学学报, 2018, 34:615-626 doi: 10.11862/CJIC.2018.100YANG Ying, PAN De-Qun, GAO Jing, et al. Chinese J. Inorg. Chem., 2018, 34:615-626 doi: 10.11862/CJIC.2018.100
Hagfeldt A, Boschloo G, Sun L, et al. Chem. Rev., 2010, 110:6595-6663 doi: 10.1021/cr900356p
Zhang Q, Uchaker E, Candelariaza S L, et al. Chem. Soc. Rev., 2013, 42:3127-3171 doi: 10.1039/c3cs00009e
Kakiage K, Aoyama Y, Yano T, et al. Chem. Commun., 2015, 51:15894-15897 doi: 10.1039/C5CC06759F
Ragoussi M E, Torres T. Chem. Commun., 2015, 51:3957-3972 doi: 10.1039/C4CC09888A
Li C T, Wu F L, Lee B H, et al. ACS Appl. Mater. Interfaces, 2017, 9:43739-43746 doi: 10.1021/acsami.7b15181
周伟男, 赵鸿斌, 蔡卓弟, 等.无机化学学报, 2016, 32:81-88 http://www.wjhxxb.cn/wjhxxbcn/ch/reader/view_abstract.aspx?file_no=20160112ZHOU Wei-Nan, ZHAO Hong-Bin, CAI Zhuo-Di, et al. Chinese J. Inorg. Chem., 2016, 32:81-88 http://www.wjhxxb.cn/wjhxxbcn/ch/reader/view_abstract.aspx?file_no=20160112
Huang L, Ma P, Deng G, et al. Dyes Pigm., 2018, 159:107-114 doi: 10.1016/j.dyepig.2018.06.010
Miao K, Liang M, Wang Z, et al. Phys. Chem. Chem. Phys., 2017, 19:1927-1936 doi: 10.1039/C6CP07335B
Zeng K, Lu Y, Tang W, et al. Chem. Sci., 2019, 10:2186-2192 doi: 10.1039/C8SC04969F
Lu J, Liu S, Wang M, et al. Front. Chem., 2018, 6:541 doi: 10.3389/fchem.2018.00541
Boaretto R, Carli S, Caramori S, et al. Dalton Trans., 2017, 46:16390-16393 doi: 10.1039/C7DT03536E
Patil D S, Sonigara K K, Jadhav M M, et al. New J. Chem., 2018, 42:4361-4371 doi: 10.1039/C7NJ04620K
Tang Y, Wang Y, Li X, et al. ACS Appl. Mater. Interfaces, 2015, 7:27976-27985 doi: 10.1021/acsami.5b10624
Cheng Y, Yang G, Jiang H, et al. ACS Appl. Mater. Interfaces, 2018, 10:38880-38891 doi: 10.1021/acsami.8b12883
Song H, Liu Q, Xie Y, et al. Chem. Commun., 2018, 54:1811-1824 doi: 10.1039/C7CC09671B
Yun S, Qin Y, Uhl A R, et al. Energy Environ. Sci., 2018, 11:476-526 doi: 10.1039/C7EE03165C
Yang L, Chen S, Zhang J, et al. J. Mater. Chem. A, 2017, 5:3514-3522 doi: 10.1039/C6TA10506H
Nazeeruddin M K, Angelis F D, Fantacci S, et al. J. Am. Chem. Soc., 2005, 127:16835-16847 doi: 10.1021/ja052467l
Yu Q J, Wang Y H, Yi Z H, et al. Acs, Nano., 2010, 4:6032-6038 doi: 10.1021/nn101384e
Wang C L, Zhang M, Hsiao Y H, et al. Energy Environ. Sci., 2016, 9:200-206 doi: 10.1039/C5EE02505B
Krishna J V S, Krishna N V, Chowdhury T H, et al. J. Mater. Chem. C, 2018, 6:11444-11456 doi: 10.1039/C8TC04370A
Song H, Zhang J, Jin J, et al. J. Mater. Chem. C, 2018, 6:3927-3936 doi: 10.1039/C8TC00610E
Ji J M, Zhou H, Kim H K, et al. J. Mater. Chem. A, 2018, 6:14518-14545 doi: 10.1039/C8TA02281J
Yella, Lee H W, Tsao H N, et al. Science, 2011, 334:629-634 doi: 10.1126/science.1209688
Mathew S, Yella A, Gao P, et al. Nat. Chem., 2014, 6:242-247 doi: 10.1038/nchem.1861
Pei K, Wu Y, Li H, et al. ACS Appl. Mater. Interfaces, 2015, 7:5296-5304 doi: 10.1021/am508623e
Qian X, Zhu Y Z, Chang W Y, et al. ACS Appl. Mater. Interfaces, 2015, 7:9015-9022 doi: 10.1021/am508400a
Han M L, Zhu Y Z, Liu S, et al. J. Power Sources, 2018, 387:117-125 doi: 10.1016/j.jpowsour.2018.03.059
Mao M, Li Q S, Zhang X L, et al. Dyes Pigm., 2017, 141:148-160 doi: 10.1016/j.dyepig.2017.02.017
Yao Z, Wu H, Li Y, et al. Energy Environ. Sci., 2015, 8:3192-3197 doi: 10.1039/C5EE02822A
Hung W I, Liao Y Y, Lee T H, et al. Chem. Commun., 2015, 51:2152-2155 doi: 10.1039/C4CC09294E
Jradi F M, Kang X, O'Neil D, et al. Chem. Mater., 2015, 27:2480-2487 doi: 10.1021/cm5045946
Subbaiyan N K, Hill J P, Ariga K, et al. Chem. Commun., 2011, 47:6003-6005 doi: 10.1039/c1cc10802f
Nogueira A F, Furtado L F O, Formiga A L B, et al. Inorg. Chem., 2004, 43:396-398 doi: 10.1021/ic0345727
Han F M, Yang J Y, Zhe Y, et al. Dalton Trans., 2016, 45:8862-8868 doi: 10.1039/C6DT00377J
Panda D K, Goodson F S, Ray S, et al. Chem. Commun., 2014, 50:5358-5360 doi: 10.1039/C3CC47498D
Zhao D X, Bian L Y, Luo Y X, et al. Dyes Pigm., 2017, 140:278-285 doi: 10.1016/j.dyepig.2017.01.051
Zhang L Y, Zou S J, Sun X H, et al. RSC Adv., 2018, 8:6212-6217 doi: 10.1039/C7RA12229B
Krishna N V, Krishna J V S, Singh S P, et al. J. Phys. Chem. C, 2017, 121:25691-25704 doi: 10.1021/acs.jpcc.7b07692
Li C T, Wu F L, Lee B H. ACS Appl. Mater. Interfaces, 2017, 9:43739-43746 doi: 10.1021/acsami.7b15181
Wu J, Li G, Zhang L, et al. J. Mater. Chem. A, 2016, 4:3342-3355 doi: 10.1039/C5TA09763K
Chen Y F, Liu J M, Huang J F, et al. J. Mater. Chem. A, 2015, 3:8083-8090 doi: 10.1039/C5TA00332F
Desta M B, Vinh N S, Kumar C P, et al. J. Mater. Chem. A, 2018, 6:13778-13789 doi: 10.1039/C8TA04774J
Li W, Wu Y, Zhang Q, et al. ACS Appl. Mater. Interfaces, 2012, 4:1822-1830 doi: 10.1021/am3001049
Babu D D, Su R, El-Shafei A, et al. RSC Adv., 2016, 6:30205-30216 doi: 10.1039/C6RA03866B
Yen Y S, Ni J S, Hung W I, et al. ACS Appl. Mater. Interfaces, 2016, 8:6117-6126 doi: 10.1021/acsami.6b00806

Figure 2 Synthesis procedure of P2 and P3
Reagents and conditions: (a) NBS, Zn(OAc)2·2H2O, (b) triisopropylacetylene, Pd(PPh3)2Cl2, CuI, THF, Et3N, (c) Pd(PPh3)4, K2CO3, H2O

Figure 3 (a) UV-Vis absorption spectra of P1, P2 and P3 in DCM, (b) UV-Vis absorption spectra of A-P1, A-P2 and A-P3 anchored on TiO2 surface

Figure 5 Cyclic voltammogram of A-P2 and A-P3
In DCM, 0.1 mol·L-1 TBAPF6, photoanode as working electrode, Pt as counter electrode, Ag/Ag+ as reference electrode, scan rate: 100 mV·s-1, calibrated with ferrocene/ferrocenium (Fc/Fc+) as an external reference

Figure 7 (a) Nyquist plots of A-P2 and A-P3, (b) Bode phase plots of DSSCs based on A-P2 and A-P3
Table 1. Photovoltaic parameters of the DSSCs obtained from the J-V curves
| Dye | Jsc/(mA·cm-2) | Voc/V | FF/% | η/% |
| A-P2 | 5.39±0.02 | 0.526±0.000 | 59.20±0.73 | 1.68±0.02 |
| A-P3 | 3.02±0.01 | 0.478±0.001 | 54.48±0.40 | 0.79±0.00 |
| Size of the active area for each cell is 0.196 cm2, three devices are assembled in parallel with each dye, the DSSCs were all measured under standard global AM 1.5G solar irradiation. | ||||
 下载: 导出CSV

 扫一扫看文章

扫一扫关注我们