

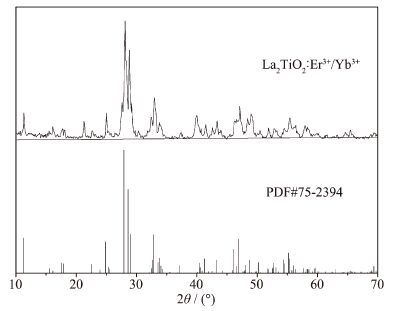
 Figure 1.
XRD patterns of 1% Er3+/10% Yb3+ co-doped La2TiO5 phosphors (top) and the pattern plotted by using the data reported in PDF#75-2394 card (bottom)
Figure 1.
XRD patterns of 1% Er3+/10% Yb3+ co-doped La2TiO5 phosphors (top) and the pattern plotted by using the data reported in PDF#75-2394 card (bottom)
Citation:
LIU Xuan-Wen, QI Jian-Quan, GUO Rui, LIU Fang-Chen, LIU Guang, ZHANG Xiao-Lei, ZHANG Yang. Synthesis and up/down Conversion Luminescence Properties of
Er3+/Yb3+ Co-doped La2TiO5 Phosphor[J]. Chinese Journal of Inorganic Chemistry,
2016, 32(1): 49-55.
doi:
10.11862/CJIC.2016.022

Er3+/Yb3+共掺杂La2TiO5荧光粉体的制备及上下转换荧光性质
摘要:
使用溶胶-凝胶法制备了Er3+单掺及Er3+/Yb3+共掺La2TiO5荧光粉体样品。经过1 100 ℃下3 h的煅烧,得到了较好的微晶。X射线粉末衍射测试表明样品中不含杂质相。扫描电镜观察表明样品颗粒范围为100~300 nm。紫外激发光谱中,在250~320 nm范围内出现Er离子和临近配位氧离子之间强烈的电荷转移跃迁峰,在350~500 nm出现Er离子f-f跃迁尖锐的吸收峰。在378 nm激发下,Er离子发射强烈的特征绿光(546 nm, 4S3/2-4I15/2),当Er离子物质的量分数达到1%,发射峰强度达到最大。在980 nm激发下的上转换光谱中,Yb离子的共掺杂有效的敏化上转换发光强度。详细讨论了样品的上下转换发光机理及相应能量传递过程。同时测试了样品的荧光衰减和量子产率。
English
Synthesis and up/down Conversion Luminescence Properties of Er3+/Yb3+ Co-doped La2TiO5 Phosphor
Abstract:
Er3+ doped and Er3+/Yb3+ co-doped La2TiO5 phosphors were synthesized by using sol-gel reactions. Good crystallinity was achieved after annealing the samples at 1 100 ℃ for 3 h in air. X-ray powder diffraction results revealed the formation of desired La2TiO5 host with pyrochlore structure. The UV excitation spectra of the samples consist of two regions in which the broad band at 250~320 nm originates from the charge-transition(CT) band between Er3+ ion and the nearest neighboring O2- ions and the sharp lines at 350~500 nm correspond to the f-f transition of Er3+ ion. Er3+ ion in La2TiO5 emits intense characteristic green light (546 nm, 4S3/2-4I15/2) under the excitation at 378 nm and the emission intensity reaches the maximum at Er3+ concentration of 1% (molar fraction). In the NIR-excited (980 nm) up-converted spectra, Yb3+ ion as an efficient sensitizer enhanced the emission intensities of Er3+ ion in comparison with those in La2TiO5:Er3+ phosphors. The luminescence decay curve and quantum yield were also measured and discussed in details.
-
Key words:
- erbium
- / ytterbium
- / La2TiO5
- / up/down-conversion
- / luminescence
-
0 Introduction
In recent years, energy transfer up-conversion (UC) and down-conversion(DC) researches have become hot topics in the material luminescence study [1-8], and attracted more and more attention due to their potential applications in the fields of optical comm-unication, electronic display systems, temperature sensors and UC laser [3, 6-8]. Owing to the abundant energy levels and narrow emission spectra lines, rare earth (RE) ions play a great role in the energy transfer UC/DC [1, 6] process. Among all the rare earth ions, Er3+ can emit characteristic green light originating from 2H11/2-4I15/2, 4S3/2-4I15/2 transitions, meanwhile, its energy levels are placed homogeneously in the energy space in different hosts, and the lifetimes of some energy levels are long enough, thus Er3+ is competent for UC/DC luminescence center. However, the absorption cross sections of Er3+ at output wavelength of comm-ercial LDs (typical one is around 980 nm) is small, so Yb3+ ion is often adopted as sensitizing center to improve the UC luminescence properties of Er3+ doped materials [9-16]. In recent years, most studies on Er3+/Yb3+co-doped systems have focused on exploring the UC mechanisms and developing novel hosts [17-19].
Many RE-doped titanate hosts have been studied, such as MgTiO3, La2Ti2O7, SrTiO3 and so on [20], except the La2TiO5 with pyrochlore structure. However, in our early investigations, La2TiO5 is proved to be a low-phonon host for many doping rare earth ions, which act as optical centers that convert the energy from absorbed UV and IR photons into visible light. In up/down-conversion process, the low phonon energy and high chemical stability are the critical factors for a preeminent host. Low phonon energy can prevent the non-radiative energy loss, which due to multi-phonon relaxation of exited rare earth dopants, and enhance the energy transfer efficiency [21-22]. As a new host material, La2TiO5 also has high chemical stability. In this research, the mechanism of UC/DC luminescence of the Er3+ doped and Er3+/Yb3+ co-doped samples are investigated through the excitation/emission spectra, dependence of emission intensity on Er3+ concentration, dependence of UC emission intensity on the pump power, the sensitization effect of Yb3+, the lumines-cence decay curve and quantum yield. To our best knowledge, it is the first report on the UC/DC lumine-scence of Er3+ ion in La2TiO5 host.
1 Experimental
1.1 Synthesis
All the samples were prepared by sol-gel method. All reactants used in the synthesis were of analytical reagent grade. In a typical experiment, Er3+ doped and Er3+/Yb3+ co-doped La2TiO5 phosphors were prepared using lanthanum acetate [La(CH3COO)3], tetrabutyl titanate [Ti(OC4H9)4], erbium nitrate hexahydrate [Er(NO3)3·6H2O] and ytterbium nitrate hexahydrate [Yb(NO3)3·6H2O] as starting reagents. The Er(NO3)3·6H2O, Yb(NO3)3·6H2O and La(CH3COO)3 in stoichio-metric propertions were dissolved into 30 mL distilled water, then 5 mL nitric acid was added to the above solution under vigorous stirring, which marked as solution-A. A certain amount of Ti(OC4H9)4 and 30 mL ethanol were uniformly mixed, which marked as solution-B. Solution-A was added to solution-B under stirring and then the pH value of the mixed solution was adjusted to about 3 by the addition of an appropriate amount of nitric acid. After stirring for 2 h, transparent sol was obtained. Subsequently, the sol was dried at 80 ℃ for 2 h until it was transformed into xero-gel. Er3+ doped and Er3+/Yb3+ co-doped La2TiO5 samples were obtained by further sintering at 1 100 ℃ for 3 h in air.
1.2 Instruments and measurement
X-ray diffraction pattern was obtained for the powder specimen on DX2500 diffractometer using a graphite monochromator Cu Kα radiation (40 kV, λ=0.154 06 nm). The scanning rate was 0.04°·min-1 with 2θ in the range of 10° to 70°. The powder morphology was characterized by a zeiss supra 55 scanning electron microscope(SEM). The photolumine-scence excitation and emission spectra were recorded on F-7000FL spectroflurophotometer with spectral slit width of 5 nm in range 220~800 nm. A 980 nm laser were used as a source of NIR excitation measurements. All measurements were made at room temperature. The lifetime and quantum efficiency were recorded using an Edinburgh instruments FLS920P. The quantum efficiency was measured by a 2 Port 150 mm BaSO4 coated integrating sphere which fits directly into the sample chamber.
2 Results and discussion
2.1 Structure and morphology characterization
The XRD patterns for all the samples were measured to identify the crystal structure of the samples obtained from the sol-gel method. It was found that the profiles of the XRD patterns are the same. The top part in Fig. 1 shows the XRD pattern for 1% Er3+/10% Yb3+ (molar fraction) co-doped La2TiO5 phosphor as representative. All diffraction peaks are found in good agreements with PDF#75-2394 card shown in the bottom part of Fig. 1. No any extra diffraction peaks belonging to other compounds in addition to La2TiO5 are found. It indicates that the Er3+ doped and Er3+/Yb3+ co-doped La2TiO5 phosphors can be achieved via the simple sol-gel method and the Er3+ and Yb3+ doping at present level did not cause observable change in the host structure. Fig. 2 illustrates the SEM image of the La2TiO5 phosphor co-doped with 1% Er3+and 10% Yb3+ (molar fraction). The SEM image reveals that the average grain size of the phosphor particles is in the range of 100~300 nm. The shape of the particle is cubic, and some particles are agglomerated together due to partial melting of samples during annealing process.
Figure 1.
XRD patterns of 1% Er3+/10% Yb3+ co-doped La2TiO5 phosphors (top) and the pattern plotted by using the data reported in PDF#75-2394 card (bottom)
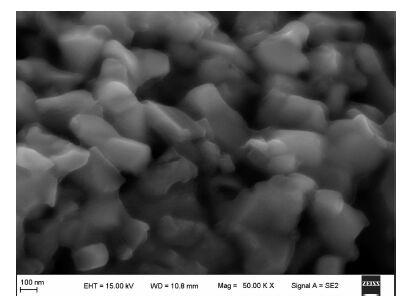 Figure 2.
SEM image of 1% Er3+/10% Yb3+ co-doped La2TiO5 phosphor
Figure 2.
SEM image of 1% Er3+/10% Yb3+ co-doped La2TiO5 phosphor
2.2 DC/UC luminescence and mechanisms
Fig. 3 shows the excitation spectra of 1% Er3+ (molar fraction) doped La2TiO5 by monitoring 546 nm. Six excitation bands are observed at 217, 272, 378, 408, 453 and 490 nm. In which, the first two broad excitation bands originate from the charge transitions of O-Ti and O-Er and the later four narrow bands are observed due to the f-f transitions from ground state 4I15/2 to excited states 4G11/2 (380 nm), 2H9/2 (410 nm), 4F3/2 (456 nm) and 4F7/2 (490 nm), respectively. The intense CT bands indicate there are strong interaction existing between the doping Er3+ ions and the host. Among all the excitation bands, the band at 378 nm shows the highest intensity. Thereby, the DC emission spectra were recorded at 378 nm.
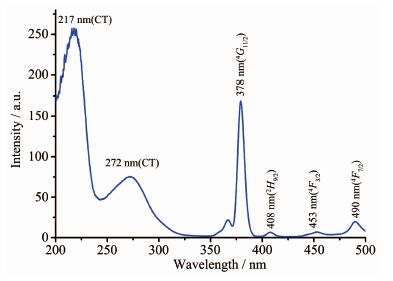 Figure 3.
Excitation spectra of La2TiO5:1% Er3+ at λem=546 nm
Figure 3.
Excitation spectra of La2TiO5:1% Er3+ at λem=546 nm
It is well known that the doping concentration of luminescent center is an important factor affecting the luminescent properties of the phosphors. In order to analyse the concentration quenching behavior of La2TiO5 :Er3+ phosphors, the emission spectra of La2TiO5:Er3+ with (0.5%~7% molar fraction) Er3+ ion is measured and shown in Fig. 4. Two main emissions at 524 (2H11/2-4I15/2) and 546 nm (4S3/2-4I15/2) and one extremely weak emission band at 660~680 nm (4F9/2-4I15/2) are observed. The dependence of emission intensity (546 nm) as a function of the Er3+ doping concentration (0.5%~7% molar fraction) is shown in inset of Fig. 4. The emission peak position is almost the same for the different concentration of Er3+ in the samples indicating that the coordination surroundings of the doping Er3+ ions is independent for this concentration range. It can also be seen that, with the increase of Er3+ concentration up to 1% molar fraction, the relative emission intensity goes on increasing and above the concentration the intensity begins to decrease. This decrease in emission intensity may be caused by the concentration quenching or multi-phonon relaxation after cross relaxation (CR) of Er3+ ion.
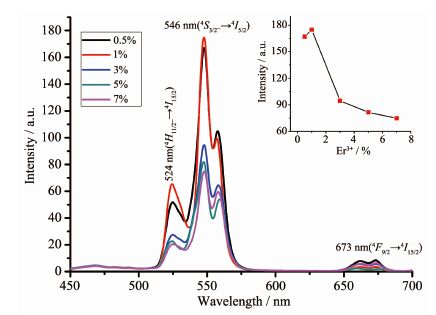 Figure 4.
Emission spectra of La2TiO5:xEr3+ (x=0.5%~7%) at λex=378 nm
Figure 4.
Emission spectra of La2TiO5:xEr3+ (x=0.5%~7%) at λex=378 nm
While taking into the concentration quenching of Er3+ ion, it means there exists the energy transfer between Er3+ ions when the R(Er-Er) in the La2TiO5 host is shorter than the critical transfer distance (Rc). Blasse has suggested that the Rc can be calculated using the formula 1 [30]:
Where, V is the volume of the unit cell, Xc is the critical concentration of Er3+ ion, and N is the number of formula units per unit cell. In La2TiO5 host, V is 0.249 3 nm3 and N is 2. So Rc is obtained to be about 0.31 nm. As the calculated Rc is shorter than 0.5 nm, it implies energy exchange interaction is the major mechanism responsible for concentration quenching of La2TiO5:Er3+.
Because the absorption cross sections of Er3+ at output wavelength of commercial LDs (laser diode, typical one is about 980 nm) is small, thus Yb3+ is often co-doped in phosphors as sensitizing center to improve the UC luminescence properties of Er3+. The emission intensity at 546 nm reaches its maximum with 1% molar fraction concentration of Er3+, so the samples with various Yb3+ and fixed Er3+ concentration were prepared. UC fluorescence emission spectra of La2TiO5:Er3+/Yb3+ under the excitation of 980 nm at same condition are shown in Fig. 5. The strong green emissions (524, 546 nm) and red emission (673 nm) are observed in the Er3+/Yb3+ co-doped samples and the red emission is significantly stronger than the counterpart of Er3+ doped samples. It can also be observed that the green and red emissions of Er3+/Yb3+ co-doped samples can be adjusted by changing Yb3+ concentration. The variation of UC intensity as a function of Yb3+ concentration is shown in top right inset of Fig. 5. The UC emission intensity decreases with the increase in the content of Yb3+, which indicates that the energy transfer from Yb3+ to Er3+ keeps going down due to the Yb3+ concentration quenching. The UC luminescence intensities (I) of the green and red emissions of La2TiO5:Er3+/Yb3+ were measured as a function of the pump power(P), respectively. In Fig. 6, the slopes of the curves ln (I) versus the ln(P) were fitted to be 2.12 and 2.15, respectively, both close to 2. The results mean that there is a two-photon process for the UC excitation.
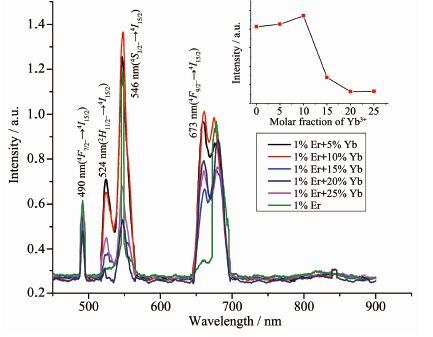 Figure 5.
UC emission spectra under 980 nm excitation of La2TiO5 phosphors doped with fixed concentration of Er3+ and various Yb3+ concentration
Figure 5.
UC emission spectra under 980 nm excitation of La2TiO5 phosphors doped with fixed concentration of Er3+ and various Yb3+ concentration
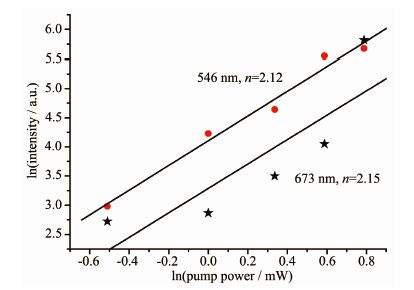 Figure 6.
ln-ln plots of the UC emission intensity at 546 nm versus the pump-power of La2TiO5:1% Er3+/10% Yb3+
Figure 6.
ln-ln plots of the UC emission intensity at 546 nm versus the pump-power of La2TiO5:1% Er3+/10% Yb3+
The schematic energy level diagrams of Er3+, Yb3+ and the different excitation routes for UC and DC are shown in Fig. 7 [7, 23-25]. When the samples of La2TiO5:Er3+ are excited at 378 nm, the luminescent level 2H11/2 and 4S3/2 are populated via multi-phonon nonradiative transitions(NRT) from upper levels and then the radiant transitions from 2H11/2 and 4S3/2 to the ground state produce the green emissions at 524 and 546 nm, respectively. While during the UC process, the Er3+ ion in the ground state absorbs one 980 nm photon (GSA) and is initially excited to 4I11/2 level. And then the excited Er3+ absorbs another photon to be excited to 4F7/2 level, which is an excited-state absorption(ESA) process. Subsequently, the emission from 4F7/2 level to the ground state is observed at 490 nm and luminescent levels 2H11/2 and 4S3/2 are populated by nonradiative transition from 4F7/2, resulting the strong green emissions observed in UC spectra. The possible cross relaxation process CR1, CR2 and CR3 are shown in Fig. 7 as reported in references [7, 26-29]. Thereby, the luminescent level 4F9/2 can be populated by nonradia-tive transition from 2H11/2 and 4S3/2 or by CR2 route. And the red emission from 4F9/2 to the ground state is enhanced via CR2 in UC process. Yb3+ ion is chosen as the sensitizer to enhance the photon absorption property at 980 nm of La2TiO5:Er3+/Yb3+ phosphor. In this case, the Er3+ is mainly excited from the ground state to the 4I11/2 level via energy transfer (ET1). Then the upper level 4F7/2 is populated via another energy transfer (ET2) process resulting the emission at 490 nm obviously observed and the populations of 2H11/2 and 4S3/2 by multi-phonon nonradiative from 4F7/2 level, which increases the green emission intensity at 524 and 546 nm. For the red emission, besides the nonradiative relaxation from 4F7/2, 2H11/2 and 4S3/2, the 4F9/2 can be populated by the cross relaxation route from 4I9/2 level and energy transfer (ET3) process of 4I13/2-4F9/2, rather than the CR2 process, which enhances the red emission at 673 nm comparing to the counterpart of La2TiO5:Er3+ as shown in Fig. 7.
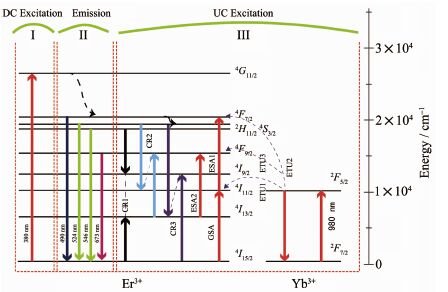 Figure 7.
Schematic energy level diagrams of the Er3+, Yb3+ and the proposed UC/DC mechanisms
Figure 7.
Schematic energy level diagrams of the Er3+, Yb3+ and the proposed UC/DC mechanisms
ET1: 4I15/2(Er3+)+2F5/2(Yb3+)→4I11/2(Er3+)+2F7/2(Yb3+)
ET2: 4I11/2(Er3+)+2F5/2(Yb3+)→4F7/2(Er3+)+2F7/2(Yb3+)
ET3: 4I13/2(Er3+)+2F5/2(Yb3+)→4F9/2(Er3+)+2F7/2(Yb3+)
The kinetic decay curves of the level 4S3/2 was measured. Fig. 8 shows the decay time profile of 1% molar fraction Er3+ doped La2TiO5 phosphor. The moni-toring wavelength is at 546 nm with a 378 nm excitation. The decay curve can be well fitted by a bi-exponential equation as
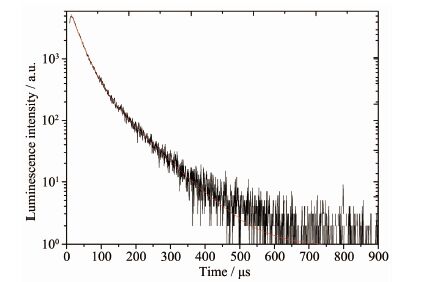 Figure 8.
Decay curve of 1% Er3+doped La2TiO5 phosphor observed at 546 nm, excited at 378 nm
Figure 8.
Decay curve of 1% Er3+doped La2TiO5 phosphor observed at 546 nm, excited at 378 nm
where I(t) is the luminescence intensity, t is the time after excitation, and τ is the decay time constant. A and B are coefficient constant. The fitting results are showed in Table 1. The lifetime values are found to be 26.05 and 79.32 μs for level 4S3/2. Based on this, the average lifetime can be calculated using equation
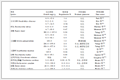 Table 1.
Fitting results of fluorescent decay curve for 1mol% Er3+doped La2TiO5
Table 1.
Fitting results of fluorescent decay curve for 1mol% Er3+doped La2TiO5
 Table 1. Fitting results of fluorescent decay curve for 1mol% Er3+doped La2TiO5
In present case, the bi-exponential fitting implies the existence of multi-phonon nonradiative transitions from 4S3/2, which is in agreement with the energy transfer process in schematic energy level diagrams [31-32]. The increase of initial stage of decay curve indicates the population process of 4S3/2 level from upper energy levels. The quantum yield was measured with a value of about 41%. These results may be important for the fabrication of high-resolution optical detectors, solar cells and high-definition luminescent displays.
3 Conclusions
Phosphors of La2TiO5:Er3+/Yb3+ were synthesized via sol-gel method followed by thermal annealing at 1 100 ℃ and the X-ray diffraction pattern of pure La2TiO5, Er3+ doped and Er3+/Yb3+ co-doped La2TiO5 samples showed good agreement with the PDF#75-2394 card. All samples exhibit interesting characteristic green and red emissions. The Yb3+ sensitizes effectively the UC luminescence properties of Er3+ in La2TiO5 host. The strongest emission intensity at 546 nm is observed in 1% Er3+doped and 1% Er3+/10% Yb3+ co-doped phosphors. The mechanisms of energy absorp-tion, energy transfer, electron transition and nonradia-tive relaxation are discussed in details to explain the UC and DC emission spectra of the phosphors. The studies of decay curve indicate the existence of multi-phonon nonradiative transitions from 4S3/2 level. The quantum yield is about 41%.
Acknowledgment: This work was supported by Fundamental Research Foundation of Central Universities (Grant N142304007) and Basic Key Program of Applied Basic Research of Science and Technology Commission Foundation of Hebei Province in China (Grant No.15961005D and Grant No.14961108D).
-
-
[1]
Lin H, Yan X H, Wang X F. Mater. Sci. Eng. B, 2011,176: 1537-1540 doi: 10.1016/j.mseb.2011.09.020
-
[2]
张庆彬,程成.无机化学学报, 2015,31:81-86 http://www.wjhxxb.cn/wjhxxbcn/ch/reader/view_abstract.aspx?file_no=20150112&flag=1ZHANG Qing-Bin, CHENG Cheng. Chinese J. Inorg. Chem., 2015,31:81-86 http://www.wjhxxb.cn/wjhxxbcn/ch/reader/view_abstract.aspx?file_no=20150112&flag=1
-
[3]
Liu X W, Guo R, Liu H, et al. RSC Adv., 2015,5:15059-15068 doi: 10.1039/C4RA13533D
-
[4]
Fan B, Chlique C, Conanec O M, et al. J. Phys. Chem. C, 2012,116:11652-11657 doi: 10.1021/jp3016744
-
[5]
Lin H, Chen D Q, Yu Y L, et al. Opt. Lett., 2011,36:876-878 doi: 10.1364/OL.36.000876
-
[6]
Lin H, Yan X H, Wang X F. Mater. Sci. Eng. B, 2011,176: 1537-1540 doi: 10.1016/j.mseb.2011.09.020
-
[7]
Yang Y M, Liu L L, Cai S Z, et al. J. Lumin., 2014,146:284-287 doi: 10.1016/j.jlumin.2013.09.069
-
[8]
Xiao S, Yang X, Ding J W. Appl. Phys. B, 2010,99:769-773 doi: 10.1007/s00340-010-3960-7
-
[9]
Li J J, Sun J S, Liu J T, et al. Mater. Res. Bull., 2013,48: 2159-2165 doi: 10.1016/j.materresbull.2013.02.009
-
[10]
Schietinger S, Aichele T, Wang H Q, et al. Nano Lett., 2010,10:134-138 doi: 10.1021/nl903046r
-
[11]
邵黎明,荆西平.无机化学学报, 2014,30:2295-2300 http://www.wjhxxb.cn/wjhxxbcn/ch/reader/view_abstract.aspx?file_no=20141008&flag=1SHAO Li-Ming , JING Xi-Ping . Chinese J. Inorg. Chem., 2014,30:2295-2300 http://www.wjhxxb.cn/wjhxxbcn/ch/reader/view_abstract.aspx?file_no=20141008&flag=1
-
[12]
Sunil S K, Kaushal K, Rai S B. Sens. Actuators A, 2009, 149:16-20 doi: 10.1016/j.sna.2008.09.019
-
[13]
范乐庆,李兆磊,黄昀昉.无机化学学报, 2015,31:147-152 http://www.wjhxxb.cn/wjhxxbcn/ch/reader/view_abstract.aspx?file_no=20150122&flag=1FAN Le-Qing, LI Zhao-Lei, HUANG Yun-Fang, et al. Chinese J. Inorg. Chem., 2015,31:147-152 http://www.wjhxxb.cn/wjhxxbcn/ch/reader/view_abstract.aspx?file_no=20150122&flag=1
-
[14]
Wang G F, Qin W P, Wang L L, et al. J. Rare Earths, 2009, 27:394-397 doi: 10.1016/S1002-0721(08)60258-6
-
[15]
Chen Z S, Gong W P, Chen T F, et al. Mater. Lett., 2012, 68:137-139 doi: 10.1016/j.matlet.2011.10.001
-
[16]
Wang X J, Lei M K, Yang T, et al. Opt. Mater., 2004,26: 253-259 doi: 10.1016/j.optmat.2004.01.011
-
[17]
Tian Y, Hua R, Yu J, et al. Mater. Chem. Phys., 2012,133: 617-620 doi: 10.1016/j.matchemphys.2012.01.025
-
[18]
Wang R, Zhou D, Yang Z, et al. J. Non-Cryst. Solids, 2011, 357:2413-2416 doi: 10.1016/j.jnoncrysol.2010.12.026
-
[19]
Dhlamini M S, Mhlongo G H, Swart H C, et al. J. Lumin., 2011,131:790-794 doi: 10.1016/j.jlumin.2010.12.005
-
[20]
Zhang S, Liang H B, Liu C M. J. Phys. Chem. C, 2013,117: 2216-2221 doi: 10.1021/jp3120258
-
[21]
Deng K, Wei X, Wang X, et al. Appl. Phys. B, 2011,102: 555-558 doi: 10.1007/s00340-011-4413-7
-
[22]
Xia Z G, Luo Y, Guan M, et al. Opt. Express, 2012,20: A722-728 doi: 10.1364/OE.20.00A722
-
[23]
Vetrone F, Boyer J C, Capobianco J A, et al. J. Phys. Chem. B, 2002,106:5622-5628 doi: 10.1021/jp020256m
-
[24]
Gao F, Wu G, Zhou H, et al. J. Appl. Phys., 2009,106: 126104-126111 doi: 10.1063/1.3273477
-
[25]
Chen X Q, Li Y L, Kong F, et al. J. Alloys Compd., 2012, 541:505-509 doi: 10.1016/j.jallcom.2012.07.008
-
[26]
Auzel F, Chen Y. J. Lumin., 1995,65:45-56 doi: 10.1016/0022-2313(94)00071-J
-
[27]
Ajroud M, Haouari M, Ben O H, et al. Phys. Status Solidi A, 2005,202:316-329 doi: 10.1002/pssa.v202:2
-
[28]
Lakshminarayana G, Qiu J, Brik M G, et al. J. Phys.: Condens. Mater., 2008,20:375101-375108 doi: 10.1088/0953-8984/20/37/375101
-
[29]
Xu C F, Yang L W, Han H L, et al. Opt. Mater., 2010,32: 1188-1192 doi: 10.1016/j.optmat.2010.03.029
-
[30]
Blasse G. Philips Res. Rep., 1969,24:131-144
-
[31]
Victory D C, Rajmuhon S N. Spectrochim. Acta Part A, 2015,146:331-341 doi: 10.1016/j.saa.2015.03.039
-
[32]
Stouwdam J W, Van V F. Nano Lett., 2002,2:733-739 doi: 10.1021/nl025562q
-
[1]
-

Figure 1 XRD patterns of 1% Er3+/10% Yb3+ co-doped La2TiO5 phosphors (top) and the pattern plotted by using the data reported in PDF#75-2394 card (bottom)

Figure 4 Emission spectra of La2TiO5:xEr3+ (x=0.5%~7%) at λex=378 nm
Inset shows variation of PL intensity with Er3+ content

Figure 5 UC emission spectra under 980 nm excitation of La2TiO5 phosphors doped with fixed concentration of Er3+ and various Yb3+ concentration
Inset shows variation of intensity at 546nm with Yb3+ content; For a comparison, an up-converted spectra of 1mol% Er doped sample is included

Figure 6 ln-ln plots of the UC emission intensity at 546 nm versus the pump-power of La2TiO5:1% Er3+/10% Yb3+

Figure 7 Schematic energy level diagrams of the Er3+, Yb3+ and the proposed UC/DC mechanisms

Figure 8 Decay curve of 1% Er3+doped La2TiO5 phosphor observed at 546 nm, excited at 378 nm
-


 下载:
下载:


 扫一扫看文章
计量
- PDF下载量: 0
- 文章访问数: 1209
- HTML全文浏览量: 123
 下载:
下载:

