

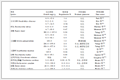
 Table 1.
Crystal data and structural refinements at 293 K for 1
Table 1.
Crystal data and structural refinements at 293 K for 1
Citation:
ZHANG Xue-Mei, YU Shan-Shan, ZHANG Hui, DUAN Hai-Bao. Magnetic and Relax-like Dielectric Response Behavior in a Charge-Transfer Crystal[J]. Chinese Journal of Inorganic Chemistry,
2016, 32(1): 25-33.
doi:
10.11862/CJIC.2016.002

一种电荷转移晶体的磁和介电弛豫性质
摘要:
在外加电场下,利用分子的旋转和取向运动是组装分子介电马达以及弛豫型分子介电体的一个主要策略。在本论文中,我们制备并表征了一个新的电荷转移晶体[C10-DMPy][Ni(mnt)2](1)(C10-DMPy+=1-decanel-N, N-dimethylpyridinium, mnt2-=马来二氰基二硫烯)。在一定的频率范围内,该化合物展现了介电弛豫行为,我们将此归于平衡阳离子的动力学位置取向和阴、阳离子间的电荷转移。该化合物的介电弛豫过程遵循Cole-Cole方程,偏离理想的Debye模型。单晶X-射线衍射表明该化合物的阴、阳离子分别独立堆积成柱状,柔性的有机阳离子与刚性的磁性阴离子构筑块间存在电荷协助氢键作用。此外,该化合物的磁行为展现为弱的铁磁耦合作用。
English
Magnetic and Relax-like Dielectric Response Behavior in a Charge-Transfer Crystal
Abstract:
Molecular rotation and orientation by applied electric field is one of the promising strategies for assembling the potential molecular dielectric rotors and relax-like dielectric. Here, a new charge transfer compound [C10-DMPy][Ni(mnt)2] (1) (C10-DMPy+=1-decanel-N, N-dimethylpyridinium cation, mnt2-=maleonitriledithiolate), which shows interesting dielectric relaxation process, is synthesized and characterized. The anions and cations of 1 are aligned into segregated stacks. There existed weakly charge-assisted hydrogen bonding interactions between the mobile organic cation and rigid [Ni(mnt)2]- anion. Large temperature-dependent dielectric constant values and dielectric relaxation process of 1 can be ascribed to the dynamic orientation motion of alkyl chain of the organic cation and charge transfer between anions and cations. The overall magnetic behavior of 1 corresponds to a paramagnetic system with ferromagnetic coupling interaction. CCDC: 1415204, 1.
-
Key words:
- charge-transfer crystal
- / crystal structure
- / dielectric response
- / magnetic properties
-
Relaxation means a systems monotonous approach to the equilibrium state after some excitation. In the case of dielectric relaxation one considers the response of polarization to an external alternating current field. Dielectric relaxation spectroscopy can provides information about the orientation adjustment of mobile charge present in the dielectric medium [1-3]. The dielectric relaxation methods are commonly used in studies of ionic conductivity and molecular dynamics in different dielectric materials, such as glasses, crystal and liquids [4-7]. It is well known that the measurements of alternating current (ac) conductivity can provide the underling mechanisms of the dielectric relaxation [8-10].
In general, molecular rotation and orientation by applied electric field is one of the promising strategies for assembling the potential molecular ferroelectric and switchable dielectric [11-16]. Approaches to creating such materials with internal reorientation or rotation include molecular crystal with rotary groups [17-18], inclusion compounds with rotating guests and rotor-coated surfaces [19-21]. In our previous studies, a series of ion-pair compounds with spin-Peierls-type transition were achieved, which consist of bis(maleonitriledithio)metalate monoanion (abbr. [M(mnt)2]- and M=Ni or Pt) bearing S=1/2 spin and organic cation with tunable molecular conformation [22-24]. Recently, we explored to introduce mobile organic cation into the rigid [Ni(mnt)2]- spin system and created a bifunctional compound [25]. Further investigation indicated utilization of such rigid [Ni(mnt)2]2- molecular block as a stator unit can create a switchable dielectrics. However, there are a limited number of studies on the dielectric relaxation and ac conductivity of [Ni(mnt)2]- spin system. Theses compounds may show interesting dielectric features. Usually, there are weakly charge-assisted interactions between the mobile organic cation and rigid [Ni(mnt)2]- anion, and the dipole motion of the cations under an ac electrical field may give rise to an interesting dielectric response.
Encouraged by our previous study and above-mentioned findings, in this paper, we present a new compound [C10-DMPy][Ni(mnt)2](1) (C10-DMPy+=1-decanel-N, N-dimethylpyridinium cation, mnt2-=maleo-nitriledithiolate). This compound showed novel dielectric relaxation behaviors.
1 Experimental
1.1 Chemicals and reagents
All reagents and chemicals were purchased from commercial sources and used without further purification. The starting materials disodium maleonitriledithiolate (Na2mnt) and 1-decanel-N, N-dimethylpyridinium bromide were synthesized following the published procedures [26-27].
1.2 Physical measurements
Elemental analyses (C, H and N) were performed with an Elementar Vario EL Ⅲ analytical instrument. IR spectra were recorded on a Bruker Vector 22 Fourier Transform Infrared Spectrometer (170SX) (KBr disc). Differential scanning calorimetry (DSC) experiments for 1 were carried out on a Pyris 1 power-compensation differential scanning calorimeter and the heating-cooling treatments were performed up to two cycles with the heating/cooling rate of 10 K·min-1. Magnetic susceptibility data on polycrystalline-sample were collected over the temperature range of 1.8~400 K for 1 using a Quantum Design MPMS-5 superconducting quantum interference device (SQUID) magnetometer. Temperature and frequency dependent dielectric constant, ε, dielectric loss, tan δ, the impe-dance, Z, and ac conductivity, σ(ac) measurements were carried out employing Concept 80 system (Novocontrol, Germany); the powdered pellet, which was prepared under 10 MPa pressure, and was coated by gold films on the opposite surfaces and was sandwiched by the copper electrodes. The pellet had a thickness of ca. 0.80 mm and 78.5 mm2 in the area. The rang of the ac frequencies was 1~107 Hz.
1.3 Preparations for 1
Na2mnt (2.0 mmol) and NiCl2·6H2O (1.0mmol) were mixed under stirring in MeOH. Subsequently, a CH3CN solution of 1-decanel-N, N-dimethylpyridinium bromide (2.0 mmol) was added, and the red precipitate was washed with MeOH. A MeOH solution with I2 (0.40 mmol) was added to the mixture; the mixture was allowed standing overnight after stirred for 25 minutes. The black precipitate formed were filtered off, washed with MeOH and dried at 65 ℃ in vacuum to give compound 1. Yield: ~42%.
The single crystals suitable for X-ray analysis were obtained by evaporation of the corresponding compound in MeOH to give black-needle crystals for 1.
1.4 X-ray crystallography
The diffraction data for single crystals were collected with graphite monochromated Mo Kα( λ=0.071 073 nm) on a CCD area detector (Bruker-SMART). Data reductions and absorption corrections were performed with the SAINT and SADABS software packages [28], respectively. Structures were solved by the direct method and refined by the full-matrix least-squares procedure on F2 using SHELXL-97 program [29]. The non-hydrogen atoms were refined anisotropically, and the hydrogen atoms were introduced at calculated positions (C-H 0.093 0 nm for benzene and 0.097 0 nm for methylene) and refined riding on the parent atoms with U(H)=1.2Ueq (bonded C or N atoms). The crystallographic details about data collection and structural refinement are summarized in Table 1. Selected bond lengths and angles together with their estimated standard deviations are listed in Table 2.
Table 1.
Crystal data and structural refinements at 293 K for 1
 Table 1. Crystal data and structural refinements at 293 K for 1
Table 2.
Selected bond lengths (nm) and bond angles (°) for 1
Table 1. Crystal data and structural refinements at 293 K for 1
Table 2.
Selected bond lengths (nm) and bond angles (°) for 1
 Table 2. Selected bond lengths (nm) and bond angles (°) for 1
CCDC: 1415204, 1.
2 Results and discussion
2.1 Crystal structure
Compound 1 crystallizes in triclinic space group P1 at room temperature, as shown in Fig. 1a, and an asymmetry unit is comprised of a pair of [Ni(mnt)2]- anion and C10-DMPy+ cation. The [Ni(mnt)2]- anions possess an approximated planar geometry, and the mean-molecule-plane of [Ni(mnt)2]- anion, defined through four coordinated S atoms, makes a dihedral angle of 2.9° with the pyridine ring in the cation. The bond lengths and angles are in good agreement with the reported [Ni(mnt)2]- compounds [22-23]. The cations exhibit different alkyl chain conformation, namely, from C11 to C19 atoms show completely trans-planar conformation in the hydrocarbon chain, whereas the C9 and C10 atoms in the pyridyl ring tail display a cis conformation. The direction of alkyl chain is almost parallel to the long molecular axis of [Ni(mnt)2]- anions. All the alkyl of the cations are nor disordered at room temperature.
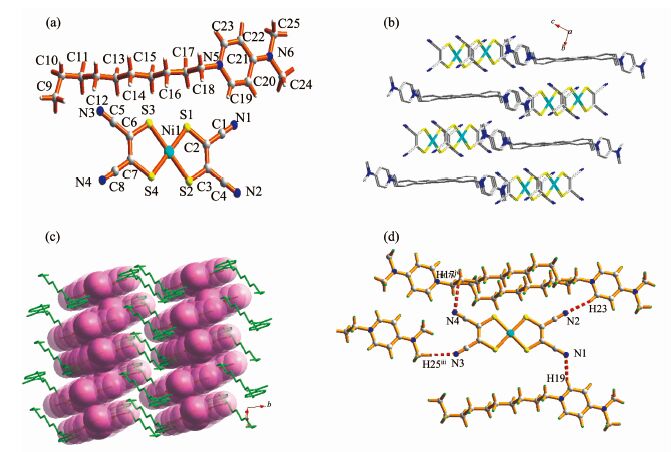 Figure 1.
(a) ORTEP view labelling atom and thermal ellipsoids drawn at the 20% probability level for 1;(b) Packing structure of 1 viewed along the a axis;(c) The layer arrangement parallel to the (111) plane, showing the alternating stacks of anions and cations; (d) Anionic dimer with the longitudinal offset mode (Symmetry code: iii 1-x, 0.5+y, z; iv -x, 1-y, -1+z).
Figure 1.
(a) ORTEP view labelling atom and thermal ellipsoids drawn at the 20% probability level for 1;(b) Packing structure of 1 viewed along the a axis;(c) The layer arrangement parallel to the (111) plane, showing the alternating stacks of anions and cations; (d) Anionic dimer with the longitudinal offset mode (Symmetry code: iii 1-x, 0.5+y, z; iv -x, 1-y, -1+z).
As shown in Fig. 1b and 1c, the anions and cations are aligned into segregated stacks, respectively. The two neighboring Ni[(mnt)2]- anions are formed into π-type dimer along the crystallographic a axis direction with the shorter interatomic separations is 0.3995 nm of Ni(1)…Ni(1)i (Symmetry code: ix, -1+y, z). The adjacent anions dimers with a slippage arrangement along both short and long molecular axes of the anions form a zigzag chain. Each anions chain was surrounded by four nonmagnetic cations stacks. There existed charge assisted C-H…N and N-H…N interactions between the adjacent anion and cation stacks, as demonstrated in Fig. 1d, the shorter inter-atomic contacts are found(C(19)…N(1) 0.331 8 nm, H(19)…N(1) 0.256 8 nm, C(19)-H(19)…N(1) 146.75°, C(23)ii…N(2) 0.351 4 nm, H(23)…N(2) 0.265 2 nm, C(19)-H(19)…N(1) 161.19°, N(25)iii…N(3) 0.352 3 nm, H(25A)…N(3) 0.255 7 nm, C(19)-H(19)…N(1) 175.14°, C(17)iv…N(4) 0.349 6 nm, H(17B)…N(4) 0.272 8 nm, C(19)-H(19)…N(1) 138.57° (Symmetry code: iix, y, -1+z; iii1-x, 0.5+y, z; iv-x, 1-y, -1+z). Along the c axis direction, two C10-DMPy+ cations are arranged in an anti-parallel arrangement, a longer centroid-to-centroid separation (0.680 750 nm) of pyridine owing to the steric hindrance between the N, N-dimethyl groups and the alkyl chain. The cations are further arranged into the individual cation layers, which are also parallel to the ab-plane.
2.2 Magnetic property of 1
The plots of χm as a function of temperature of 1 in the temperature range of 1.8~400 K is displayed in Fig. 2, where χm represents the molar magnetic susceptibility with one [Ni(mnt)2]- per formula unit and the diamagnetism contributed from the atomic cores was not removed. The overall magnetic behavior of 1 corresponds to a paramagnetic system with ferromagnetic coupling interaction.
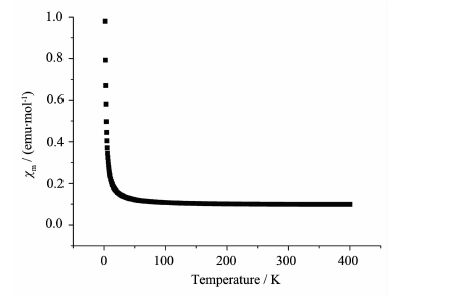 Figure 2.
Plots of χm-T for 1
Figure 2.
Plots of χm-T for 1
The χmT value at 300 K is 0.390 emu·K·mol-1 which is slightly higher than the spin-only value expected for system with S=1/2(0.375 emu·K·mol-1). With the temperature decrease, the value of χm slightly increases. Below 25 K, the χm values decrease steeply, and such the typical Curie paramagnetic behavior of 1 in low temperature region arises from the magnetic impurity caused by the lattice defects. In order to estimate the magnetic exchange nature of 1, the simple Curie-Weiss law was used to analyze the magnetic susceptibility data over the range of 1.8~ 400 K:
where the symbols of χ0 is contributed by the core diamagnetism and the possible temperature-independent van Vleck-type paramagnetic susceptibility originated from the coupling of the ground and excited states through a magnetic field, and then C/T term represents the paramagnetism from the magnetic impurity. However, the obtained C values from fits are too large and seem unreasonable. The inability of Curie-Weiss models to describe the magnetic behavior indicates this 1-D spin system probably posses strong magnetic anisotropy, which leads to the temperature dependent magnetic susceptibility deviating from the isotropic magnetic coupling model.
2.3 Dielectric properties
The relative permittivity ε*( ω) of the dielectric material as function of frequency is given by:
Frequency dependent of the dielectric permittivity ε′ and dielectric loss tan δ= ε″/ ε′ for 1 are shown in Fig. 3 in the temperature range of 50~130 ℃. From the Fig. 3, it can be seen that the values ε′ rapidly drops from about 40 to 7 with the increase of the field frequency from 1 to 104 Hz at 130 ℃. The nature of the dielectric permittivity related to oscillating free dipoles (like long alkyl chain of the organic cation) in an alternating field. At very low frequencies, the dipoles motion can follow the applied electric field. As the frequency increases and reaches a characteristic value ( ω=1/ τ), the dielectric constant slightly decreases and exhibit relaxation process. The different model of mechanisms leads to the resonance dielectric relaxation spectra in the case of electronic polarization or molecular vibrations which occur at frequency beyond 1012 Hz. Below this frequency, the dielectric relaxation spectra prevail relating to the behavior of dipole motion or ionic polarization. For 1, [Ni(mnt)2]- anions have rigid planar configuration and the motion at small electric field is very difficult. Therefore, the relaxation that appears in 1~104 Hz could be attributed to dipole motion of the organic cations in 1. Dielectric relaxation process were also observed in the tan δ-f plot (Fig. 3b). The dielectric relaxation spectra of 1, transformed into electric modulus spectra in Fig. 4a by using Eq.(3), the dielectric modulus representation minimizes the unwanted effects of the extrinsic relaxation and is often used in the analysis of the dynamic conductivity of solids [30]. It can essentially eliminate the problem of the electrode polarization and space charge injection phenomena.
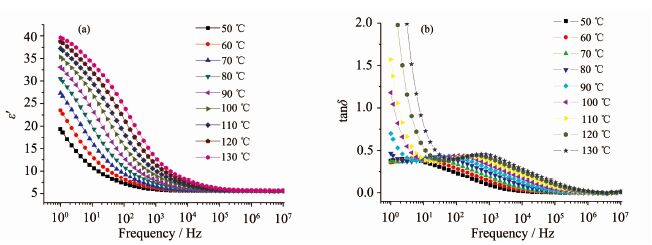 Figure 3.
Frequency dependences of ε′(a) and tanδ (b) for 1 in the range of 50~130 ℃
Figure 3.
Frequency dependences of ε′(a) and tanδ (b) for 1 in the range of 50~130 ℃
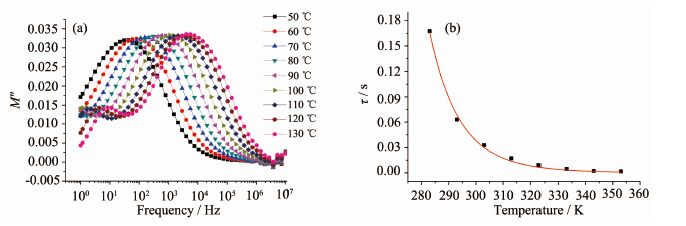 Figure 4.
Frequency dependences of dielectric modulus M″ (a) and plots of τ versus T for 1 (b) at selected temperature
Figure 4.
Frequency dependences of dielectric modulus M″ (a) and plots of τ versus T for 1 (b) at selected temperature
It is observed that the maximum in M″ peak shift to higher frequency with the temperature increase. In the frequency region below peak maximum, the charge carrier drifts to long distance. For the frequency above peak maximum M″, the carrier seem to be confined to potential well, thus drifts to short distances or spatially localized. In order to get the deep insight into the dielectric relaxation process, the frequency- dependence of peak for the dielectric loss at different temperature is plotted(Fig. 4b) and the following relation is:
Where τ=1/fmax and fmax is the frequency at maximum in the plot of tan δ-f under a selected temperature; τ0 represents the characteristic macroscopic relation time, Ea is the activation energy or potential barrier required for the dielectric relaxation, kB is Boltzmanns constant. The best fits giving the following results using Eq.(4): τ0=8.928(3)×10-13 s and Ea=0.63(1) eV. According to our previous work, this dielectric relaxation is attributed to dynamic orientation motion segmental motions of the organic cation. Similar relaxation have been reported in polymer. The Ea and τ0 values in this compound are slightly larger than our reported compound 1, 10-bis(1-methylimidazolium)decane bis(maleonitriodithiolato)nickelate [31]. For this compound, the segregated stacks of anions and cations and diverse charge-assisted H…N, C…N and H…S interactions between the adjacent anion and cation stacks (as shown in Fig. 1d) stabilize the cations in its lattice, furthermore, the rigid pyridine ring compared to imidazolyl ring in 1 give seldom freedom for the motion of the cations, which may be the reason for its relatively larger activation energy and τ0.
Carefully check the temperature dependence dielectric constant ( ε″) and dielectric loss (tan δ) at selected frequency for 1 (Fig. 5a and 5b), the second step dielectric relaxation was observed in the range of 50~110 ℃ and at the frequency from 105 to 106 Hz. The dielectric constant and loss are almost constants at low temperature. With the temperature increasing, the wide dielectric loss and constant peak become visible in the range of 50~110 ℃ and maxima of all peaks shift toward high frequencies. This dielectric behavior is typical thermal assisted dielectric relaxation, and may be related to charge transfer of the cations and anions. At high frequencies (105 to 106 Hz), the dipoles motion (organic cation segments motion, the first step dielectric relaxation) cannot follow the applied electric field, and second relaxation becomes apparent.
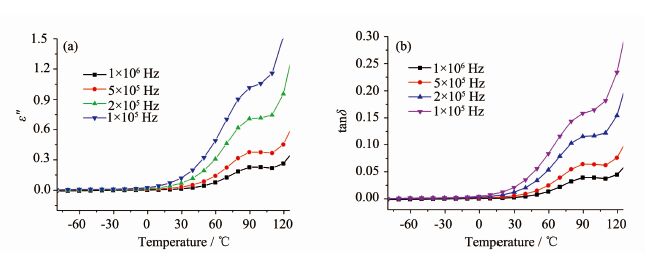 Figure 5.
Temperature dependences of ε″(a) and tanδ (b) for 1 at the selected frequency
Figure 5.
Temperature dependences of ε″(a) and tanδ (b) for 1 at the selected frequency
The relaxation process for 1 at selected temperatures was fitted using Cole-Cole model function:
Where the symbols ε0 and ε∞ are respectively the static and high frequencies limits of dielectric permittivity, is relaxation time related to the frequency of maximum dielectric loss and is parameter which describe the shape of the relaxation spectra with the range of 0~1. For an ideal Debye relaxation, α=0. Fig. 6 shows the Cole-Cole plots of the relaxation process for 1 at selected temperatures, and the best fits using Eq.(5) for the plots of ε”- ε yielded the corresponding parameters ε0, ε∞ and α for 1, which are summarized in Table 3. The fitted ε∞ parameter is closed to the dielectric constant at higher frequency (f>105 Hz) for 1, and the fitted α parameters deviate from zero, indicating that the relaxation process depart from the ideal Debye dielectric response.
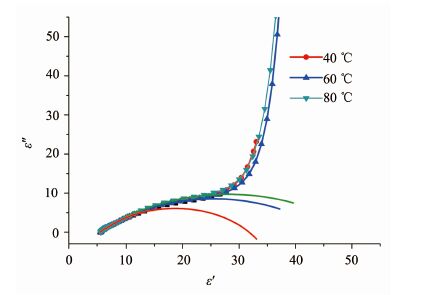 Figure 6.
Plots of ε″ versus ε′ at selected temperatures for 1 (Open: experimental data; lines: theoretically reproduced using Eq.(5)).
Table 3.
ε0, ε∞ and α parameters for 1
Figure 6.
Plots of ε″ versus ε′ at selected temperatures for 1 (Open: experimental data; lines: theoretically reproduced using Eq.(5)).
Table 3.
ε0, ε∞ and α parameters for 1
 Table 3. ε0, ε∞ and α parameters for 1
2.4 Complex impedance analysis
The increase of dielectric loss and dielectric permittivity at higher temperature is due to the conductivity increase of the sample. To understand this dielectric relaxation and analyze dynamics of the ionic movement in crystal, the complex impedance (Z′-Z″) plot at different temperature was made (Fig. 7a). The plot shows a single semicircle for selected temperature related to bulk effects. It indicates that single conductivity process take place in the sample. These impedance plots were solved by fitting using equivalent circuit where each impedance semicircle can be represent by a resistor, R, and capacitor, C, in parallel. It is clearly seen from the Fig. 7a that the radius of semicircle decreases with increasing temperature, which indicates that the decrease of the bulk resistance with an increases of the temperature. The temperature dependent conductivities σdc are plotted in the form of lg σdc versus 1 000/T, as shown in Fig. 7b, the lg σdc as a function of 1 000/T shows linear relationship in the temperature range of 403~473 K, and the activation energy (Edc) was estimated as 0.57(2) eV, which is similar with the activation energy obtained from dielectric relaxation. The similar active energy implies that charge carrier has to overcome the same energy barrier while conducting as well as relaxation. The conduction of 1 due to a process of charge transfer between the cation and anion. From the single crystal structure, there are diverse weak interactions between the anion and cation. As the temperature increasing, the motion of the alkyl chain of the cation induces the enhancement charge transfer and charge carrier. The motion of charge carriers in the low-mobility solids is accompanied by an electric relaxation. The charge transfer between the cation and anion is accompanied by the change in the direction of the dipole movement in the samples.
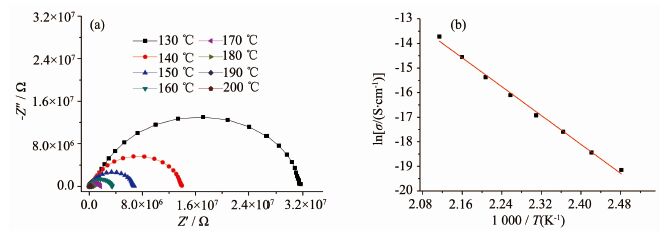 Figure 7.
Complex-plane impedance plots for 1 at various temperatures(a) and temperature dependence of σdc for 1(b) (Black dot: obtained from using an equivalent circuit; lines: theoretically reproduced)
Figure 7.
Complex-plane impedance plots for 1 at various temperatures(a) and temperature dependence of σdc for 1(b) (Black dot: obtained from using an equivalent circuit; lines: theoretically reproduced)
3 Conclusions
In summary, a molecular magnetic based on [Ni(mnt)2]- spin system have been synthesized and characterized structurally via incorporating the easily mobile organic cation. Some weakly charge-assisted interactions between the mobile organic cation and rigid [Ni(mnt)2]- anion were observed in the crystal structure of 1. The dielectric results indicated that the dielectric relaxation in the investigated frequency range originates from the dynamic orientation motion of alkyl chain of the organic cation. The overall magnetic behavior of 1 corresponds to a paramagnetic system with ferromagnetic coupling interaction. This study provided a new strategy for the design of relax-like dielectric.
-
-
[1]
Wojnarowska Z, Knapik J, Diaz M, et al. Macromolecules, 2014,47:4056-4065 doi: 10.1021/ma5003479
-
[2]
Arik E, Altan H, Esenturk O. J. Phys. Chem. A, 2014,118: 3081-3089 doi: 10.1021/jp500760t
-
[3]
Xiao B, Zheng W, Dong Y L, et al. J. Phys. Chem. C, 2014, 118:5802-5809 doi: 10.1021/jp411167g
-
[4]
Moynihan C T. Solid State Ionics, 1998,105:175-180 doi: 10.1016/S0167-2738(97)00462-1
-
[5]
Petrovsky V, Manohar A, Dogan F. J. Appl. Phys., 2006,100: 014102(2 pages) doi: 10.1063/1.2206411
-
[6]
Sheoran A, Sanghi S, Rani S, et al. J. Alloys Compd., 2009, 475:804-809 doi: 10.1016/j.jallcom.2008.08.006
-
[7]
Roling B, Happe A, Funke K, et al. Phys. Rev. Lett., 1997, 78:2160-2163 doi: 10.1103/PhysRevLett.78.2160
-
[8]
Ang C, Yu Z, Jing Z, et al. Phys. Rev. B, 2000,61:3922-3926 doi: 10.1103/PhysRevB.61.3922
-
[9]
Thongbai P, Yamwong T, Maensiri S. Solid State Commun., 2008,147:385-387 doi: 10.1016/j.ssc.2008.06.020
-
[10]
Pradhan D K, Choudhary R N P, Samantaray B K. Int. J. Electrochem. Sci., 2008,3:597-608
-
[11]
Xu G C, Ma X M, Zhang L, et al. J. Am. Chem. Soc., 2010,132:9588-9590 doi: 10.1021/ja104263m
-
[12]
周琴琴,付大伟.无机化学学报, 2013,29(8):1696-1702ZHOU Qin-Qin, FU Da-Wei . Chinese J. Inorg. Chem., 2013,29(8):1696-1702
-
[13]
Akutagawa T, Koshinaka H, Sato D, et al. Nat. Mater., 2009,8:342-347 doi: 10.1038/nmat2377
-
[14]
Fu D W, Cai H L, Liu Y M, et al. Science, 2013,339:425-428 doi: 10.1126/science.1229675
-
[15]
Fu D W, Song Y M, Wang G X, et al. J. Am. Chem. Soc., 2007,129:5346-5347 doi: 10.1021/ja0701816
-
[16]
Fu D W, Dai J, Ge J Z, et al. Inorg. Chem. Commun., 2010, 13:282-285 doi: 10.1016/j.inoche.2009.12.003
-
[17]
Rodríguez-Molina B, Pérez-Estrada S, Garcia-Garibay M A, J. Am. Chem. Soc., 2013,135:10388-10395 doi: 10.1021/ja4024463
-
[18]
Jiang X, Rodríguez-Molina B, Nazarian N, et al. J. Am. Chem. Soc., 2014,136:8871-8874 doi: 10.1021/ja503467e
-
[19]
Kottas G S, Clarke L I, Horinek D, et al. Chem. Rev., 2005, 105:1281-1376 doi: 10.1021/cr0300993
-
[20]
Kaszynski P, Friedli A C, Michl J. J. Am. Chem. Soc., 1992,114:601-620 doi: 10.1021/ja00028a029
-
[21]
Winston E B, Lowell P J, Vacek J, et al. Phys. Chem. Chem. Phys., 2008,10:5188-5191 doi: 10.1039/b808104b
-
[22]
Duan H B, Chen X R, Yang H, et al. Inorg. Chem., 2013,52:3870-3877 doi: 10.1021/ic302571p
-
[23]
周宏,于姗姗,段海宝.无机化学学报, 2013,29(7):1-10ZHOU Hong, YU Shan-Shan, DUAN Hai-Bao, et al. Chinese J. Inorg. Chem., 2013,29(7):1-10
-
[24]
Duan H B, Ren X M, Meng Q J. Coord. Chem. Rev., 2010, 254:1509-1522 doi: 10.1016/j.ccr.2009.12.021
-
[25]
Daun H B, Ren X M, Shen L J, et al. Dalton Trans., 2011,40:3622-3630 doi: 10.1039/c0dt01704c
-
[26]
Davison A, Holm H R. Inorg. Synth., 1967,10:8-26
-
[27]
许多慧,盛小利,芦昌盛.无机化学学报, 2012,28(5):888-892XU Duo-Hui, SHENG Xiao-Li, LU Chang-Sheng, et al. Chinese J. Inorg. Chem. , 2012,28(5):888-892
-
[28]
SMART and SAINT, Siemens Analytical X-ray Instrument Inc., Madison, WI, 1996.
-
[29]
Sheldrick G M. SHELX-97, Program for the Refinement of Crystal Structure, University of G?ttingen[J]. Germany, 1997, : .
-
[30]
wiergiel J, Jadzyn J. Ind. Eng. Chem. Res., 2011,50:11935-11941 doi: 10.1021/ie201172t
-
[31]
Duan H B, Zhang X M, Zhou H. Synth. Met., 2014,15:294-298
-
[1]
-

Figure 1 (a) ORTEP view labelling atom and thermal ellipsoids drawn at the 20% probability level for 1;(b) Packing structure of 1 viewed along the a axis;(c) The layer arrangement parallel to the (111) plane, showing the alternating stacks of anions and cations; (d) Anionic dimer with the longitudinal offset mode (Symmetry code: iii 1-x, 0.5+y, z; iv -x, 1-y, -1+z).

Figure 4 Frequency dependences of dielectric modulus M″ (a) and plots of τ versus T for 1 (b) at selected temperature

Figure 5 Temperature dependences of ε″(a) and tanδ (b) for 1 at the selected frequency

Figure 6 Plots of ε″ versus ε′ at selected temperatures for 1 (Open: experimental data; lines: theoretically reproduced using Eq.(5)).

Figure 7 Complex-plane impedance plots for 1 at various temperatures(a) and temperature dependence of σdc for 1(b) (Black dot: obtained from using an equivalent circuit; lines: theoretically reproduced)
-


 下载:
下载:


 扫一扫看文章
计量
- PDF下载量: 0
- 文章访问数: 865
- HTML全文浏览量: 49
 下载:
下载:

