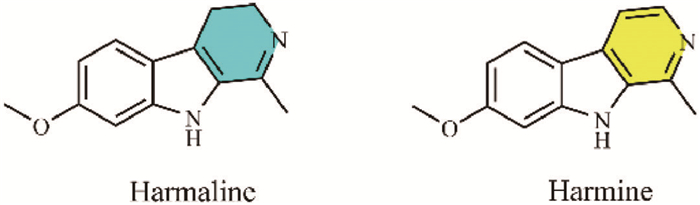
Figure 1.
Structure of compounds harmaline and harmine.
Alkaloids peganumiums A–C from Peganum harmala L., with two novel long conjugated structures
Yongjian Liu , Cen Liu , Haitao Guo , Jinchai Qi , Heng Chen , Yuping Yang , Tao Ma , Yonggang Liu

Peganum harmala L. (Zygophyllaceae) is a perennial herb that is widely distributed in some arid and semi-arid areas of China, the United States, India, Iran, and Africa [1]. Its seeds are of high medicinal value and are often used to treat digestive cancers, colds, rheumatism, malaria, amnesia, and some skin diseases. The seeds are rich in alkaloids, mainly containing β-carbolines, followed by quinazolines. The compounds harmaline and harmine as β-carbolines constituted the main components of the seeds (Fig. 1) and the contents of these two alkaloids in the dried seeds were reported to be 5.6% and 4.3% (w/w) respectively [2]. Many dimeric alkaloids were isolated from Peganum harmala L. seeds with structures consisting of β-carboline polymerization, quinazoline polymerization, and polymerization of the above two, among others [3,4].
Over the years, the discovery of new alkaloids in Peganum harmala L. seeds has focused on the extraction and re-separation of the filtrate after alcohol extraction, acid solubilization, and alkali precipitation [5-13]. However, the precipitated fractions containing mainly harmaline and harmine after acid solubilization and base precipitation have hardly been isolated to explore new compounds. We have so far isolated 12 compounds from this precipitated fraction and a homologue of compound 3 (Fig. 2) has been published as a new compound [14]. This study also focused on this precipitation fraction and aimed to isolate new compounds from it, with their anticancer activities and related mechanisms being initially explored in vitro and in vivo.
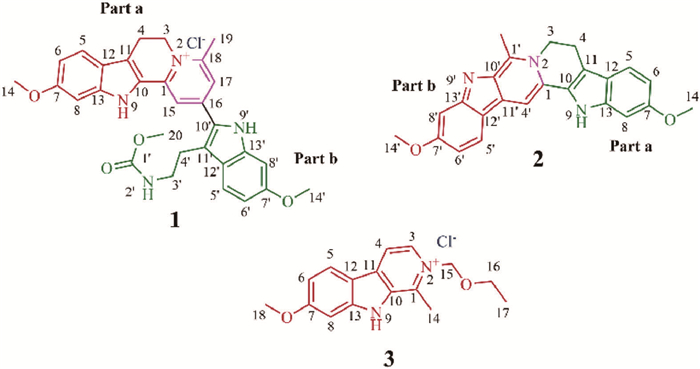
Compound 1 was obtained as an orange amorphous powder. Its molecular formula was determined to be C30H31N4+O4Cl− with 18 indices of hydrogen deficiency by high resolution electrospray ionization mass spectrometry (HR-ESI-MS) at m/z 511.2333 [M]+ (calcd. 511.2340). The compound displayed a distinct orange color under daylight in methanol indicating a large ultraviolet (UV) absorption and the presence of a very long conjugated structure. The UV spectra (Fig. S5 in Supporting information) of compound 1 displayed maximum UV absorption at λmax 206, 334, and 466, verifying the above inferences. The data of 1H nuclear magnetic resonance (NMR) (Table 1) combined with 1H–1H correlation spectroscopy (COSY) (Fig. 3) revealed the presence of two aromatic ABX spin systems (δH 7.64 (d, J = 8.7 Hz, 1H), 6.84 (dd, J = 8.7, 2.2 Hz, 1H), 6.96 (d, J = 2.2 Hz, 1H); 7.59 (d, J = 8.8 Hz, 1H), 6.82 (dd, J = 8.7, 2.2 Hz, 1H), 6.89 (d, J = 2.2 Hz, 1H)). The 1H NMR data (Table 1) also showed the presence of three O-methyls (δH 3.83 (s, 3H), 3.84 (s, 3H), 3.63 (s, 3H)), one methyl (δH 2.87, (s, 3H)), one methylene (δH 4.66 (t, J = 7.3 Hz, 2H)), and two active hydrogens (δH 11.83 (N-H), 12.01 (N-H)), with N-H being assessed to be the indole N-H of β-carboline based on the structural features of the Peganum harmala L. alkaloids. The 13C NMR (Table 1) and distortionless enhancement by polarization transfer (DEPT) (Fig. S8 in Supporting information) data revealed the presence of four methylene carbons (δC 19.0, 25.9, 41.4, 48.8), combined with the heteronuclear single quantum correlation (HSQC) spectrum (Fig. S10 in Supporting information) to identify the hydrogens attached to them, of which three methylene hydrogens interfered with by water peaks were recognized (δH 3.26, 3.26, 3.32). The 1H–1H COSY (Fig. 3) relationship also displayed a coupling of methylene hydrogens (δH 4.66 (H-3) vs. 3.32 (H-4)) and there was also a coupling of δH 7.62 (H-3′) and δH 3.26 (H-2′). The carbon signal attached in δH 7.26 was not found in HSQC and this hydrogen was presumed to be an active hydrogen. The key heteronuclear multiple bond correlation (HMBC) cross-peaks (Fig. 3) showed that N-H at position 9′ correlated with C-10′, C-11′, C-12′, and C-13′ indicating the presence of indole ring of Part b (Fig. 2, compound 1). Similarly, the correlation of N-H at position 9 with C-10 and C-11 combined with the correlation of H-5 with C-11 suggested the presence of an indole ring in Part a (Fig. 2). The correlation of H-3 with C-18 could also be combined with the H-3 chemical shift (δH 4.66, δH-3 value that did not form N+ was generally < 4, e.g., harmaline (δH-3 3.67)) to indicate the formation of a 2-positioned N+. The HMBC correlation of H-3 with C-18 proved that the N atom at position 2 of the pyridine ring was connected to the other C atom, so the conclusions were consistent. In the case of the HMBC data both H-15 and H-17 correlated to C-10′, connecting Parts a and b. H-2′ (δH 7.62) was the N-H of the amide and generated a 1H–1H COSY correlation with H-3′ (δH 3.26), consistent with the structure as deduced. Additionally, the values of δH-3′ and δH-4′ were both 3.26. The HMBC spectrum (Fig. 3) displayed that methoxy H-20 (δH 3.63) was correlated with amide C-1′ (δC 157.3). By structural inference, compound 1 contained a long conjugated chain of the polymerized structure between harmaline (Part a) and ring-opened harmaline (Part b), with the latter being an analogous structure of pegaharmine E from a published article [11]. Since the total alkaloids were treated with hydrochloric acid after extraction and the NMR spectrum did not show any other anions containing carbon and hydrogen, as well as the fact that a saturated aqueous solution of the compound produced a white precipitate when titrated with silver nitrate solution, the anionic part was determined to be Cl−. The structural formula was shown in Fig. 2 and its solution could indeed display an orange color in daylight and a strong UV absorption at λmax 466. The trivial name was given as peganumium A.
 DownLoad:
CSV
DownLoad:
CSV
| 1 (600/150 MHz, DMSO–d6) | 2 (600/150 MHz, DMSO–d6) | 3 (400/100 MHz, CD3OD) | ||||||||
| No. | δH (J in Hz) | δC | No. | δH (J in Hz) | δC | No. | δH (J in Hz) | δC | ||
| 1 | 142.7 C | 1 | 132.6 C | 1 | 140.0 C | |||||
| 2 | N atom | 2 | N atom | 2 | N atom | |||||
| 3 | 4.66 t (7.3) | 48.8 CH2 | 3 | 4.92 t (7.2) | 44.3 CH2 | 3 | 8.53 d (6.6) | 134.5 CH | ||
| 4 | 3.32 overlap | 19.0 CH2 | 4 | 3.26 overlap | 19.1 CH2 | 4 | 8.34 d (6.6) | 114.7 CH | ||
| 5 | 7.64 d (8.7) | 120.6 CH | 5 | 7.54 d (8.6) | 120.1 CH | 5 | 8.23 d (8.9) | 125.5 CH | ||
| 6 | 6.84 dd (8.7, 2.2) | 111.9 CH | 6 | 6.77 dd (8.7, 2.2) | 110.6 CH | 6 | 7.06 dd (8.9, 2.2) | 114.9 CH | ||
| 7 | 159.3 C | 7 | 157.6 C | 7 | 165.8 C | |||||
| 8 | 6.96 d (2.2) | 93.8 CH | 8 | 6.92 d (2.2) | 94.5 CH | 8 | 7.17 d (2.2) | 95.1 CH | ||
| 9 | 12.01 | NH | 9 | 11.78 s | NH | 9a | 14.10 s (CDCl3) | NH | ||
| 10 | 124.9 C | 10 | 126.6 C | 10 | 136.9 C | |||||
| 11 | 117.6 C | 11 | 112.9 C | 11 | 134.7 C | |||||
| 12 | 119.1 C | 12 | 120.1 C | 12 | 115.2 C | |||||
| 13 | 140.8 C | 13 | 139.2 C | 13 | 148.5 C | |||||
| 14 | 3.84 s | 55.6 CH3 | 14 | 3.84 s | 55.1 CH3 | 14 | 3.16 s | 14.7 CH3 | ||
| 15 | 8.36 s | 113.2 CH | 1′ | 141.6 C | 15 | 6.03 s | 87.2 CH2 | |||
| 16 | 145.2 C | 4′ | 7.20 s | 104.9 CH | 16 | 3.69 q (7.0) | 66.8 CH2 | |||
| 17 | 7.87 d (2.6) | 119.1 CH | 5′ | 7.94 d (8.6) | 122.6 CH | 17 | 1.24 t (7.0) | 15.1 CH3 | ||
| 18 | 154.0 C | 6′ | 6.76 dd (8.6, 2.4) | 107.6 CH | 18 | 3.99 s | 56.4 CH3 | |||
| 19 | 2.87 s | 21.1 CH3 | 7′ | 158.9 C | ||||||
| 20 | 3.63 s | 51.4 CH3 | 8′ | 7.11 d (2.4) | 100.1 CH | |||||
| 1′ | 157.3 C | 9′ | N atom | |||||||
| 2′ | 7.62 m | NH | 10′ | 152.8 C | ||||||
| 3′ | 3.26 overlap | 41.4 CH2 | 11′ | 120.4 C | ||||||
| 4′ | 3.26 overlap | 25.9 CH2 | 12′ | 117.6 C | ||||||
| 5′ | 7.59 d (8.8) | 121.4 CH | 13′ | 153.6 C | ||||||
| 6′ | 6.82 dd (8.7, 2.2) | 111.4 CH | 14′ | 3.85 s | 55.3 CH3 | |||||
| 7′ | 158.8 CH | 15′ | 2.84 s | 19.6 CH3 | ||||||
| 8′ | 6.89 d (2.2) | 93.4 CH | ||||||||
| 9′ | 11.83 | NH | ||||||||
| 10′ | 127.4 C | |||||||||
| 11′ | 118.9 C | |||||||||
| 12′ | 123.3 C | |||||||||
| 13′ | 139.0 C | |||||||||
| 14′ | 3.83 s | 55.6 CH3 | ||||||||
| a The chemical shift of the N-9 active hydrogen in CDCl3 was 14.10, while in DMSO–d6 it was 13.23. | ||||||||||
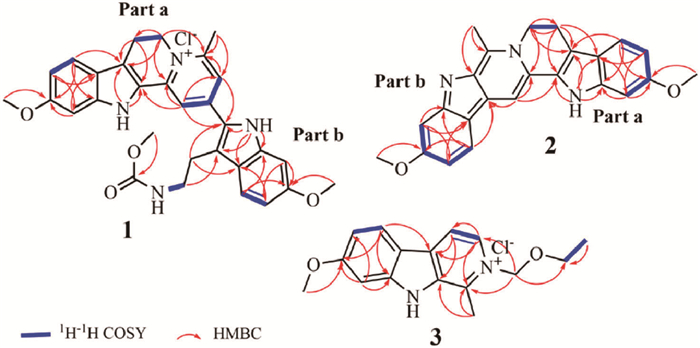
Compound 2 was obtained also as a deep yellow amorphous powder. Its molecular formula was determined to be C24H21N3O2 with 16 indices of hydrogen deficiency by HR-ESI-MS at m/z 384.1699 [M + H]+ (calcd. 384.1707). The methanol solution of compound 2 was yellowish green in daylight and presumably, a long conjugate system was also present. The UV spectra (Fig. S13 in Supporting information) showed maximum UV absorption of compound 2 at λmax 205, 224, 283, 304, and 443, verifying the above inference. The 1H NMR (400 MHz, DMSO–d6, Fig. S14 in Supporting information) and 1H–1H COSY spectrum (Fig. 3) revealed the presence of two ABX systems (δH 7.90 (d, J = 8.6 Hz, 1H), 7.53 (d, J = 8.7 Hz, 1H), 7.11 (d, J = 2.4 Hz, 1H), 6.92 (d, J = 2.2 Hz, 1H), 6.77 (dd, J = 8.7, 2.2 Hz, 1H), 6.73 (dd, J = 8.6, 2.4 Hz, 1H)). The 1H NMR spectrum (600 MHz, DMSO–d6, Table 1) showed the presence of two O-methyls (δH 3.85 (s, 3H), 3.84 (s, 3H)) and one methyl (δH 2.84 (s, 3H)), as well as one active hydrogen δH 11.78 (s, 1H) for the indole N-H of β-carboline. The 13C NMR spectrum (Fig. S15 in Supporting information) displayed methoxy (δc 55.13, 55.30) and its linked carbon signals (δc 158.93, 157.64), further illustrating the ABX system based on the structural features of Peganum harmala alkaloids. In addition, there existed one methylene δH 4.92 and the 1H–1H COSY spectrum (Fig. S16 in Supporting information) showed that δH 4.92 was coupled to 3.26, which was interfered with by the water peak in 1H NMR. The HSQC spectrum (Fig. S17 in Supporting information) gave a carbon signal (δC 19.1) connected to the interfered signal (δH 3.26). The hydrogens δH 4.92 were presumed to be the H-3 of the parent nucleus of harmaline and N-2 atom of the pyridine ring had a stronger electron-absorbing capacity than the nitrogen atom of harmaline. The overall presumption was that there existed two β-carboline parent nuclei (one of which was a harmaline parent nucleus) and that the nitrogen atom at the indole site from the other β-carboline parent nuclei was not connected by any active hydrogen. The HMBC spectrum (Fig. 3) showed that the 9-position N-H of Part a correlated with C-10, C-11, C-12, and C-13, respectively, suggesting an indole ring structure. H-3 correlated with C-1 and C-10 and H-4 correlated with C-10, C-11, and C-12, revealing a structure of a harmaline parent nucleus. For Part b, because of the N-H disappearance of the indole ring, a large change in the chemical shift of N atom at the indole-site double bond to the neighboring C atom occurred compared to Part a (153.6 for C-13′ (139.2 for C-13 in Part a) and 152.8 for C-10′ (126.6 for C-10 in Part a)), seen from Fig. 2. H-4′ correlated with C-1 and C-10, which could connect Part a and Part b. Part a was a harmaline-like structure while Part b was the structure of pegaharmine K in a published article [12]. Since the lone electron pair of N atom at position 2 was involved in the whole conjugation system, which made this N atom enhance electron-absorbing capacity for C-3, with the chemical shift of H-3 reaching δH 4.92 compared with harmaline's H-3 value that was 3.67. The structural formula of the compound was shown in Fig. 2. Because of the presence of the long conjugate system, the compound solution displayed a strong UV absorption. The trivial name was given as peganumium B.
Compound 3 was obtained as a white crystal (methanol). Its molecular formula was determined to be C16H19N2+O2Cl− with 9 indices of hydrogen deficiency by HR-ESI-MS at m/z 271.1442 [M]+ (calcd. 271.1441). The 1H NMR (400 MHz, DMSO–d6, Table 1) showed the presence of an ABX system (δH 8.23 (d, J = 8.9 Hz, 1H), 7.17 (d, J = 2.2 Hz, 1H), 7.06 (dd, J = 8.9, 2.2 Hz, 1H) and of typical H-3/H-4 signals (δH 8.53 (d, J = 6.6 Hz, 1H) 8.34 (d, J = 6.6 Hz, 1H)) in the harmine parent nucleus, with 1H–1H COSY (Fig. 3) assisting in validating the above relationship. Compared to the NMR of harmine [14], there were three more hydrogen (δH 6.03 (s, 2H), 3.69 (q, J = 7.0 Hz, 2H), 1.24 (t, J = 7.0 Hz, 3H)) signals and three more carbon signals (δC 87.2, 66.8, 15.1). The HSQC spectrum (Fig. S24 in Supporting information) gave the corresponding hydrocarbon signals. The HMBC spectrum (Fig. 3) showed the most critical correlation of H-15 and C-1/C-13, indicating that the side chain was attached at 2-position N atom. In 1H NMR spectrum of CDCl3 (Fig. S22 in Supporting information) and DMSO–d6, the presence of active hydrogen at the N-9 position of the indole ring was observed, with chemical shifts of 14.10 and 13.23, respectively. Since the total alkaloids were treated with hydrochloric acid after extraction and the NMR spectrum did not show any other anions containing carbon and hydrogen, as well as the fact that a saturated aqueous solution of the compound produced a white precipitate when titrated with silver nitrate solution, the anionic part was determined to be Cl−. The structural formula of the compound was shown in Fig. 2. The trivial name was given as peganumium C.
The biosynthetic pathways of the four compounds above were also speculated (Section Ⅰ in Supporting information). The cytotoxic activities of compounds 1–3 against four human cancer cell lines (HCT116, MGC803, A549, and PANC-1) were evaluated using the CCK-8 method with harmine and cisplatin as the positive control (Table 2). Compounds 1–3 exhibited better in vitro antiproliferative activity. Compound 2, in particular, had 24-h IC50 of 4.34 ± 0.24, 5.77 ± 0.30, 8.05 ± 0.26, and 2.16 ± 0.18 µmol/L against HCT116, MGC803, A549, and PANC-1 cells, respectively. Moreover, its activity was superior to that of the positive drugs used. In summary, compound 2 (peganumium B) performed the best antiproliferative activity in vitro.
DownLoad:
CSV
| Compd. | HCT116 | MGC803 | A549 | PANC-1 |
| 1 | 7.73 ± 0.36 | 10.13 ± 0.46 | 39.93 ± 3.42 | – |
| 2 | 4.34 ± 0.24 | 5.77 ± 0.30 | 8.05 ± 0.26 | 2.16 ± 0.18 |
| 3 | 16.01 ± 0.76 | 26.81 ± 2.98 | – | – |
| Harmine | 5.78 ± 0.67 | 16.82 ± 1.11 | 20.19 ± 4.13 | 10.56 ± 1.58 |
| Cisplatin | 6.63 ± 0.22 | 13.56 ± 1.39 | 22.72 ± 0.91 | – |
| -: Undetermined. | ||||
Utilizing a bromodeoxyuridine (BrdU) incorporation assay, we observed a marked suppression in the proliferation of PANC-1 cells following treatment with varying concentrations of peganumium B (2 and 4 µmol/L) for 48 h (Fig. 4A). The transwell assay was observed that invasive capabilities of PANC-1 cells were not affected by 1 µmol/L of peganumium B but was repressed with 2 µmol/L of peganumium B, compared with the control group (Fig. 4B).
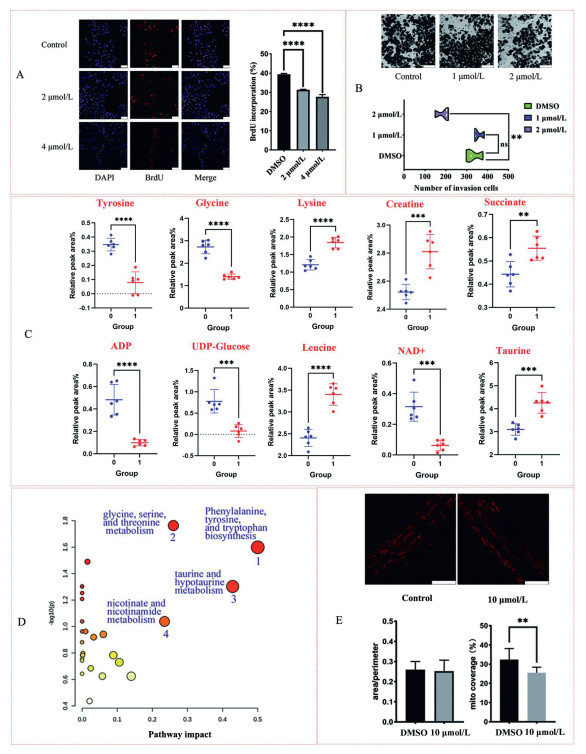
Metabolomics was a valuable tool used to analyze mechanisms of biological activity [15]. In the present study, the mechanism related to the in vitro antiproliferative effect of peganumium B on MGC803 cells was investigated by 1H NMR metabolomics. Based on the results of the multivariate analysis and peak area changes, ten differential metabolites, including tyrosine, glycine, lysine, creatine, leucine, succinate, adenosine diphosphate (ADP), uridine diphosphate glucose (UDP-glucose), nicotinamide adenine dinucleotide (NAD+), and taurine, were screened before and after dosing (Fig. 4C). Then these differential metabolites were introduced into the Metaboanalyst 6.0 software for further analysis (Supporting information). The results showed that the antiproliferative effect of peganumium B on MGC803 cells at 5 µmol/L concentration was associated with biosynthesis and metabolic pathways of some amino acids, taurine and hypotaurine metabolism, and nicotinate and nicotinamide metabolism (Fig. 4D). In addition, the downregulation of NAD+ [16] and ADP was likely to affect mitochondrial function, which played a key role in mitochondrial respiration and would be explored as follows.
Based on the metabolite analysis, the effect of the drug on mitochondrial morphology was evaluated in vivo based on Caenorhabditis elegans (C. elegans) model. We chose a C. elegans strain expressing red fluorescent protein (RFP) targeted to the outer mitochondrial membrane in body-wall muscle cells. After drug treatment (10 µmol/L), there was no significant change in network connectivity, indicated by the area/perimeter ratio, but a slight reduction in mitochondrial content (Fig. 4E). The latter was speculated to be associated with the decrease in NAD+ [17]. Overall, our study has not only enriched the chemical composition of Peganum harmala L. and discovered two new skeletons with very long conjugation systems, but also identified a compound peganumium B with excellent in vitro anticancer activity.
The authors declare that they have no known competing financial interests or personal relationships that could have appeared to influence the work reported in this paper.
Yongjian Liu: Writing – original draft, Methodology, Investigation. Cen Liu: Writing – original draft, Methodology, Investigation, Data curation. Haitao Guo: Writing – review & editing, Data curation. Jinchai Qi: Writing – review & editing, Validation. Heng Chen: Writing – review & editing. Yuping Yang: Writing – review & editing. Tao Ma: Writing – review & editing, Validation, Supervision, Resources, Methodology, Formal analysis, Conceptualization. Yonggang Liu: Validation, Supervision, Resources, Project administration, Funding acquisition, Conceptualization.
Financial support from Beijing Natural Science Foundation (No. 7232283) is gratefully acknowledged.
Supplementary material associated with this article can be found, in the online version, at doi:
F.A. Khan, A. Maalik, Z. Iqbal, et al., Eur. J. Pharmacol. 721 (2013) 391–394.
C.H. Wang, J. Liu, L.M. Zheng, Chin. Pharm. J. 37 (2002) 53–57.
S. Li, X. Cheng, C. Wang, J. Ethnopharmacol. 203 (2017) 127–162.
Z. Zhu, S. Zhao, C. Wang, Molecules 27 (2022) 4161. doi: 10.3390/molecules27134161
Q. Zhang, Y.H. Zan, H.G. Yang, et al., Phytochemistry 197 (2022) 113107.
K.B. Wang, Y.T. Di, Y. Bao, et al., Org. Lett. 16 (2014) 4028–4031. doi: 10.1021/ol501856v
Y. d. Yang, X. m. Cheng, W. Liu, et al., RSC Adv. 6 (2016) 15976–15987.
K.B. Wang, S.G. Li, X.Y. Huang, et al., Eur. J. Org. Chem. 2017 (2017) 1876–1879. doi: 10.1002/ejoc.201700137
Y. Yang, X. Cheng, W. Liu, et al., J. Ethnopharmacol. 168 (2015) 279–286. doi: 10.1109/CCBD.2015.57
K.B. Wang, X. Hu, S.G. Li, et al., Fitoterapia 125 (2018) 155–160.
K.B. Wang, D.H. Li, P. Hu, et al., Org. Lett. 18 (2016) 3398–3401. doi: 10.1021/acs.orglett.6b01560
K.B. Wang, D.H. Li, Y. Bao, et al., J. Nat. Prod. 80 (2017) 551–559.
S.G. Li, K.B. Wang, C. Gong, et al., Bioorg. Med. Chem. Lett. 28 (2018) 103–106.
Y.J. Liu, H. Liu, L. H S, et al., China Tradit. Herb. Drugs 55 (2024) 705–710.
A. Tan, X.X. Tan, Chin. Chem. Lett. 35 (2024) 109276.
J.Y. Zhu, A. Ouyang, Z.L. Shen, et al., Chin. Chem. Lett. 33 (2022) 1907–1912.
K.M. Ralto, E.P. Rhee, S.M. Parikh, Nat. Rev. Nephrol. 16 (2020) 99–111. doi: 10.1038/s41581-019-0216-6

Figure 4 The results of biological assays for peganumium B. (A) PANC-1 cells were collected and stained with BrdU and 4′, 6-diamidino-2-phenylindole (DAPI) and analyzed via a fluorescence microscopy. Scale bar: 50 µm. (B) The transwell assay on PANC-1 cells. Scale bar: 100 µm. (C) Differential metabolites on MGC803 cells. For the horizontal coordinate, "0" was the control group and "1" was the dosing group. (D) Screening of differential metabolite pathways. (E) Effects of the drug on mitochondrial morphology and content of nematodes. Data were presented as means ± standard deviation (SD) of independent tests (n = 3 (A, B), n = 6 (C) and n = 15 (E)). **P < 0.01, ***P < 0.001, ****P < 0.0001.
Table 1. 1H and 13C NMR data of compounds 1–3 (ppm).
| 1 (600/150 MHz, DMSO–d6) | 2 (600/150 MHz, DMSO–d6) | 3 (400/100 MHz, CD3OD) | ||||||||
| No. | δH (J in Hz) | δC | No. | δH (J in Hz) | δC | No. | δH (J in Hz) | δC | ||
| 1 | 142.7 C | 1 | 132.6 C | 1 | 140.0 C | |||||
| 2 | N atom | 2 | N atom | 2 | N atom | |||||
| 3 | 4.66 t (7.3) | 48.8 CH2 | 3 | 4.92 t (7.2) | 44.3 CH2 | 3 | 8.53 d (6.6) | 134.5 CH | ||
| 4 | 3.32 overlap | 19.0 CH2 | 4 | 3.26 overlap | 19.1 CH2 | 4 | 8.34 d (6.6) | 114.7 CH | ||
| 5 | 7.64 d (8.7) | 120.6 CH | 5 | 7.54 d (8.6) | 120.1 CH | 5 | 8.23 d (8.9) | 125.5 CH | ||
| 6 | 6.84 dd (8.7, 2.2) | 111.9 CH | 6 | 6.77 dd (8.7, 2.2) | 110.6 CH | 6 | 7.06 dd (8.9, 2.2) | 114.9 CH | ||
| 7 | 159.3 C | 7 | 157.6 C | 7 | 165.8 C | |||||
| 8 | 6.96 d (2.2) | 93.8 CH | 8 | 6.92 d (2.2) | 94.5 CH | 8 | 7.17 d (2.2) | 95.1 CH | ||
| 9 | 12.01 | NH | 9 | 11.78 s | NH | 9a | 14.10 s (CDCl3) | NH | ||
| 10 | 124.9 C | 10 | 126.6 C | 10 | 136.9 C | |||||
| 11 | 117.6 C | 11 | 112.9 C | 11 | 134.7 C | |||||
| 12 | 119.1 C | 12 | 120.1 C | 12 | 115.2 C | |||||
| 13 | 140.8 C | 13 | 139.2 C | 13 | 148.5 C | |||||
| 14 | 3.84 s | 55.6 CH3 | 14 | 3.84 s | 55.1 CH3 | 14 | 3.16 s | 14.7 CH3 | ||
| 15 | 8.36 s | 113.2 CH | 1′ | 141.6 C | 15 | 6.03 s | 87.2 CH2 | |||
| 16 | 145.2 C | 4′ | 7.20 s | 104.9 CH | 16 | 3.69 q (7.0) | 66.8 CH2 | |||
| 17 | 7.87 d (2.6) | 119.1 CH | 5′ | 7.94 d (8.6) | 122.6 CH | 17 | 1.24 t (7.0) | 15.1 CH3 | ||
| 18 | 154.0 C | 6′ | 6.76 dd (8.6, 2.4) | 107.6 CH | 18 | 3.99 s | 56.4 CH3 | |||
| 19 | 2.87 s | 21.1 CH3 | 7′ | 158.9 C | ||||||
| 20 | 3.63 s | 51.4 CH3 | 8′ | 7.11 d (2.4) | 100.1 CH | |||||
| 1′ | 157.3 C | 9′ | N atom | |||||||
| 2′ | 7.62 m | NH | 10′ | 152.8 C | ||||||
| 3′ | 3.26 overlap | 41.4 CH2 | 11′ | 120.4 C | ||||||
| 4′ | 3.26 overlap | 25.9 CH2 | 12′ | 117.6 C | ||||||
| 5′ | 7.59 d (8.8) | 121.4 CH | 13′ | 153.6 C | ||||||
| 6′ | 6.82 dd (8.7, 2.2) | 111.4 CH | 14′ | 3.85 s | 55.3 CH3 | |||||
| 7′ | 158.8 CH | 15′ | 2.84 s | 19.6 CH3 | ||||||
| 8′ | 6.89 d (2.2) | 93.4 CH | ||||||||
| 9′ | 11.83 | NH | ||||||||
| 10′ | 127.4 C | |||||||||
| 11′ | 118.9 C | |||||||||
| 12′ | 123.3 C | |||||||||
| 13′ | 139.0 C | |||||||||
| 14′ | 3.83 s | 55.6 CH3 | ||||||||
| a The chemical shift of the N-9 active hydrogen in CDCl3 was 14.10, while in DMSO–d6 it was 13.23. | ||||||||||
 下载: 导出CSV
Table 2. IC50 (µmol/L) of the compounds on four cancer cell lines.
| Compd. | HCT116 | MGC803 | A549 | PANC-1 |
| 1 | 7.73 ± 0.36 | 10.13 ± 0.46 | 39.93 ± 3.42 | – |
| 2 | 4.34 ± 0.24 | 5.77 ± 0.30 | 8.05 ± 0.26 | 2.16 ± 0.18 |
| 3 | 16.01 ± 0.76 | 26.81 ± 2.98 | – | – |
| Harmine | 5.78 ± 0.67 | 16.82 ± 1.11 | 20.19 ± 4.13 | 10.56 ± 1.58 |
| Cisplatin | 6.63 ± 0.22 | 13.56 ± 1.39 | 22.72 ± 0.91 | – |
| -: Undetermined. | ||||
下载: 导出CSV

 扫一扫看文章

扫一扫关注我们


