Table 1.
Mass concentration of water-insoluble inorganic ions in PM2.5 at the top and foot of Mt. Hua in winter.
Citation:
Haijiao Liu, Qiao Feng, Yu Huang, Feng Wu, Yali Liu, Minxia Shen, Xiao Guo, Wenting Dai, Weining Qi, Yifan Zhang, Lu Li, Qiyuan Wang, Bianhong Zhou, Jianjun Li. Composition and size distribution of wintertime inorganic aerosols at ground and alpine regions of northwest China[J]. Chinese Chemical Letters,
2024, 35(11): 109636.
doi:
10.1016/j.cclet.2024.109636

Composition and size distribution of wintertime inorganic aerosols at ground and alpine regions of northwest China
English
Composition and size distribution of wintertime inorganic aerosols at ground and alpine regions of northwest China
Abstract:
Water-soluble inorganic ions (WSIIs) play a pivotal role in atmospheric chemical reactions, particularly influencing the formation of secondary particulate matter. A comprehensive grasp of the vertical distribution of atmospheric pollutants holds immense significance in understanding the diffusion and transportation of these pollutants. This study investigates the WSIIs of PM2.5 and size-segregated particles at the top (~2060 m a.s.l.) and foot of Mt. Hua during the winter of 2020. All the measured ions present significant higher concentrations (1.9~6.9 times) at the foot than the top. Cl− and K+ at the foot are more than 4 times of those at the top, whereas Ca2+ and Mg2+ are only 1.3–1.9 times higher. The particle size distribution of NO3−, SO42−, K+ and Cl− demonstrate a single peak distribution (0.7–1.1 µm) at the foot, but with a bimodal distribution (0.7–1.1 µm and 4.7–5.8 µm) at the top. These differences suggest that the aerosol at the alpine region is mainly transported via long-distance from Northwest/North China, but limited influenced by vertical transport through valley breeze. The changes of concentration and size distribution of WSIIs in dust event and non-dust period indicate that the effects of dust event on aerosols at ground surface were weaker than that of the free troposphere of Guanzhong Plain. Notably, our study underscores the dominant influence of NO3− in shaping the gas-particle distribution of ammonia within the winter free troposphere. Our results highlight the significant role of long-range transport on aerosols in the free troposphere in Guanzhong Plain, Northwest China.
-
Key words:
- Water-soluble inorganic ions
- / Size distribution
- / Aerosol acidity
- / Ammonia
- / Free troposphere
-
PM2.5 can carry toxic substances with long retention time and far transmission distance in the air [1], which affect the human health [2] and environment [3]. The main components of PM2.5 include carbonaceous components, water-soluble compounds, crustal elements and various trace elements [4]. Water-soluble ions (WSIIs) serve as indicators of atmospheric pollution sources [5], typically constitute 20%–80% of the total mass concentration within PM2.5 [6,7]. The study of the concentration and variation characteristics of WSIIs is helpful to understand the formation mechanism of secondary aerosol [8]. High concentrations of NO3−, SO42− and NH4+ (collectively known as SNA) are important components that contribute to haze pollution [9] and determine the aerosols acidity, as quantified by pH [10].
At present, there are relatively few researches on the vertical distribution characteristics of atmospheric aerosol physical and chemical properties. The present studies find that the concentration, composition and particle size of water-soluble inorganic ions and secondary ions of atmosphere in different regions have different vertical characteristics with the change of height. It is mainly due to the change of source, precursor, aging of long-distance transport of air mass, boundary layer movement, meteorological condition variations [11,12]. The cloud/fog process, photochemical oxidation, and mountain plant emission in high air, which also make it significantly different from the lower land [13,14]. In general, it is consistent that secondary ions (such as NH4+ and SO42−) are mainly distributed in the fine particles [15,16], crustal ions are mainly distributed in coarse particles [17].
Alpine regions experience a distinct atmospheric conditions characterized by low temperature, high humidity, and strong solar radiation, differing from those in lowland areas [18]. The alpine region is the bottom layer of the troposphere directly affected by the underlying surface. The descent of the planetary boundary layer (PBL) during winter or summer night can make to the emergence of mountaintop into the free troposphere (FT). The FT are primarily influenced by transported sources from remote areas [19] and signify the atmospheric characteristics across the regional scale [13]. Consequently the change of PBL height alters the chemical and physical characteristics of atmospheric particles on the mountaintop [20]. Additionally, valley breeze can uplift the aerosols and precursors from the ground surface to mountaintop in daytime, and thus affect atmospheric conditions in the FT [21]. Understanding the vertical distribution in alpine regions of atmospheric pollutants, especially WSIIs, are of great importance for a comprehensive understanding of pollutant diffusion and transport.
In this study, PM2.5 and size-segregated particles were collected simultaneously between Dec. 17, 2020 to Jan. 12, 2021 from the mountaintop (~2060 m a.s.l.) (referred to as “Top”) and the foothills (referred to as “Foot”) of Mt. Hua, which is adjacent to the heavily polluted Guanzhong Plain, Northwest China. The detail sampling and analysis methods are shown in supplement. We firstly compared the differences in WSIIs characteristics and particle size distribution between lowland and tropospheric atmospheres. The major sources, formation mechanisms and estimated acidity of aerosols, as well as their influencing factors, at the Alpine region were further discussed.
The average concentration of PM2.5 at the Top (30.7 ± 21.8 µg/m3) is about 4.6 times lower than that at the Foot (141 ± 56.7 µg/m3), because there is no obvious anthropogenic emission at the alpine region (Table 1). At the Foot, PM2.5 concentration during the daytime (154 ± 78.2 µg/m3) is notably higher than the nighttime (125 ± 68.2 µg/m3). The increase of temperature (Fig. S1 in Supporting information) during daytime would cause an ascent of the PBL, which is favorable for vertical diffusion of pollutants in near-ground troposphere. Thus, the higher PM2.5 concentration during daytime should be caused by the more intensified anthropogenic emission, including vehicle exhaust, industry activities, and/or civil combustion sources. However, PM2.5 concentrations at the Top do not present a significant difference in daytime (31.9 ± 30.1 µg/m3) and nighttime (29.9 ± 22.3 µg/m3).
Table 1
The total WSIIs concentration at the Foot (40.6 ± 20.6 µg/m3) is approximately 2.88 times higher than that at the Top (14.1 ± 7.38 µg/m3). Similarly, the diurnal variation characteristics of most WSIIs exhibit higher values during the daytime at the Foot (Table 1). In contrast, there is no exhibit significant day-night difference at the Top. The two secondary anions, NO3− and SO42−, are the most abundant ions in PM2.5 at both sites.
The air mass trajectories during the sampling period, as illustrated in Fig. S2 (Supporting information), predominantly directed towards the alpine region of Mt. Hua from the northwest and north, originating in areas such as Mongolia, Inner Mongolia, and Xinjiang Autonomous Region. These regions are rich in dust due to the proximity of desert source. Consequently, the comparable PM2.5 concentrations observed at the Top during both daytime and nighttime can be attributed to their primarily originating from long-range transport originating in Northwest China. Our previous studies prove that aerosols from the Foot could affect the aerosols at the Top via vertical transport under the influence of daytime valley breeze, even though the altitude of Mt. Hua is beyond the boundary layer most of time [22]. However, no significant correlation is found in any composition in the two sites in this study, preliminary suggesting the insignificant contribution of vertical transport by valley breeze in winter.
Previous studies indicate that particles originating from biomass burning are well-known enriched with Cl− and K+ [23], whereas Ca2+ and Mg2+ are two pivotal markers of dust-related emissions [22]. Table 1 additionally provides the average concentration ratio of each component at the Foot relative to that at the Top (RF/T). Remarkably high RF/T values are observed for Cl− and K+, suggesting the significant contribution from biomass burning on PM2.5 in the surrounding areas of the Foot. Additionally, the highest RF/T of Cl− and K+ compared to other WSIIs also suggest that anthropogenic emissions at ground level are difficult to vertically transport to the FT region during winter, when PBL is always lower than the submit of Mt. Hua (nearly 2100 m a.s.l.). In contrast, Ca2+ and Mg2+ exhibit the lowest RF/T values, again confirming that aerosols at the Top are subject to greater influence from dust-related sources through long-distance transport.
As shown in Table S1 (Supporting information), the concentrations of WSIIs in fine particles (the sum of particles with size < 2.1 µm) at the Foot (37.8 ± 4.92 µg/m3) are significantly higher than those (11.2 ± 2.09 µg/m3) in coarse particles (the sum of particles with size > 2.1 µm), while the concentrations of coarse are higher than fine particles at the Top (6.29 ± 1.02 µg/m3 and 5.34 ± 0.850 µg/m3, respectively). Previous studies have proved particles released from anthropogenic mainly present as fine grain, while mineral dust primarily exists with coarse grain [24]. This reaffirms that the significance of mineral dust emission as a substantial aerosol source at the Top.
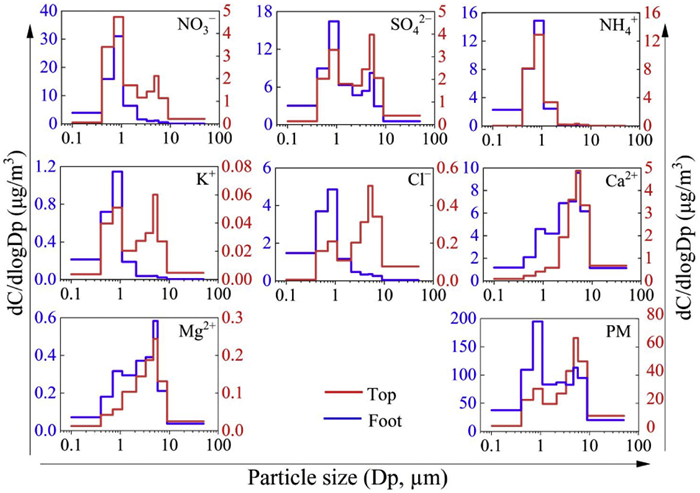
Nearly all the WSIIs in both fine and coarse particles exhibit higher geometric mean diameter (GMD) at the Top compared to the Foot (Table S1 in Supporting information), in accordance with the fact that particles at the Top experience more coagulation during the long-range transport. The particle size distribution of NO3− and SO42− demonstrate a single peak distribution (0.7–1.1 µm) at the Foot, but with a bimodal distribution (0.7–1.1 µm and 4.7–5.8 µm) at the Top (Fig. 1). Meanwhile, the GMD values at the Top are 2.13 ± 0.758 µm and 2.97 ± 1.04 µm, respectively. This prevalence is primarily attributed to heterogeneous reactions occurring on the coarse mineral dust surfaces [24]. Interestingly, both the K+ and Cl− present a peak value at 0.7–1.1 µm at the Foot with GMD values 0.649 ± 0.177 µm and 0.706 ± 0.156 µm, respectively, suggesting their primary occurrence in fine particles from biomass burning. Conversely, K+ and Cl− present bimodal distributions (0.7–1.1 µm and 4.7–5.8 µm) at the Top, with the GMD 2.79 ± 1.29 µm and 5.15 ± 2.00 µm, confirming that tropospheric air is influenced not only by anthropogenic pollution sources but also by long-distance transport of dust. Ca2+ and Mg2+ exhibit single peak distributions (4.7–5.8 µm) with high GMD values at both sites, indicating that mineral dust is the primary source of Ca2+ and Mg2+ at Mt. Hua during the winter. However, the particle size distribution of NH4+ demonstrates a single peak distribution (the range of 0.7–1.1 µm) at both the Top and Foot, with the GMD of 0.960 ± 0.178 µm and 0.602 ± 0.185 µm, respectively, which indicating a predominant presence in fine particles. This is because that particulate ammonium is secondarily formed via heterogeneous reactions of gaseous ammonia with H2SO4 and HNO3, and mainly exists in accumulate mode of particles in the form of (NH4)2SO4, NH4HSO4, and NH4NO3 [25].
Figure 1
 Figure 1. Particle size distribution of water-soluble ions at the Top and Foot.
NO3− is the most important secondary component in WSIIs of PM2.5 at both sites (Fig. S3 in Supporting information). The average proportion of NO3− in WSIIs accounts for 36.3% at the Top, which is lower than the Foot (40.2%). In contrast, the average proportions of SO42− and NH4+ in WSIIs (24.6% and 22.7%) at the Top are higher than those at the Foot (21.2% and 21.0%). This observed trend is primarily attributed to the inherent instability, volatility, and short-lived nature of nitrates, and its formation is readily replaced by sulfate which is non-volatile [26]. As a result, sulfate, with higher acidity and lower volatility than nitrate, demonstrates a propensity for continuous formation during long-range transport.
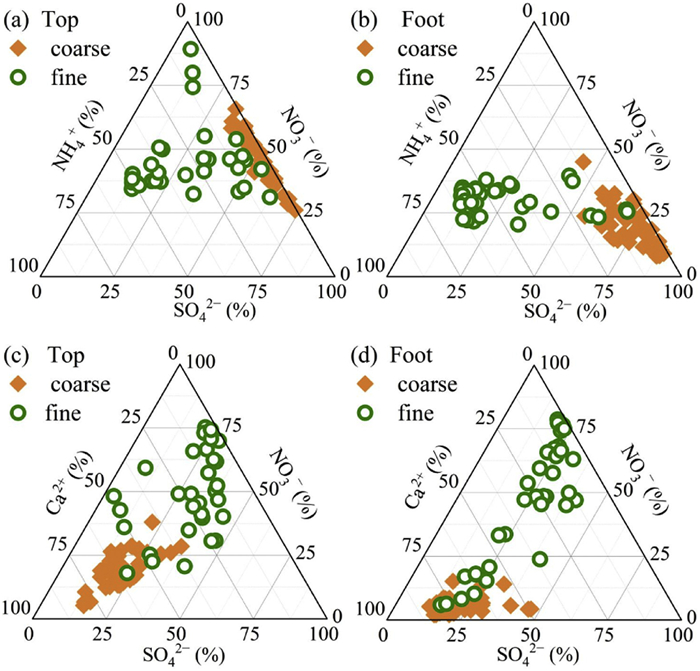
At both the Top and Foot, the primary constituents of fine particles comprise of SO42−, NH4+, and NO3−, and the sum of the three ion concentrations contributing to 86.8% and 79.5% to total WSIIs, respectively (Table S1 in Supporting information). Meanwhile, the main components of coarse particles are SO42−, NO3−, and Ca2+, and the total concentration of the three ions accounts for 90.5% and 89.8% of WSIIs, respectively (Table S1 in Supporting information). It can be observed in Fig. 2 that the percentage of NO3− in coarse particles are comparable with fine particles at the Top, meanwhile the mean value at the Top is higher than those at the Foot. Notably, Fig. 2 also shows higher percentages of NO3− and Ca2+ in coarse particles at the Top. The accumulation of NO3− in coarse particles at the Top are primarily attributed to the presence of NH4NO3 in fine particles, which are highly volatile and easily converted into gaseous NH3 and HNO3. The HNO3 can react with cations (such as Ca2+, Mg2+) in coarse particles to form non-volatile salts, leading to the migration of nitrate from fine particles to coarse [27].
Figure 2
 Figure 2. Ternary phase diagrams of SO42−, NH4+, and NO3− molar equivalents in coarse and fine particles at the Top (a) and Foot (b). Ternary phase diagrams of SO42−, Ca2+, and NO3− molar equivalents in coarse and fine particles at the Top (c) and Foot (d).
As shown in Fig. S1 (Supporting information), the PM2.5 concentration exhibit a rapid increase from Jan. 9 to Jan. 11, 2021 at both sites. The satellite observation (Fig. S4 in Supporting information) proves that it mainly attributes to the dust event transport from the northwest of China. The strong enhancement of dust-indicative ions (Ca2+ and Mg2+), but weak increase of other components, agreeing well with the high dust contribution during the event. Moreover, due to that aerosols are mainly affected by anthropogenic emissions, the increase of PM2.5 at the Foot is much lower that at the Top.
The size distributions of most WSIIs during the dust event exhibit a marked difference to that observed in non-dust period (Fig. S5 in Supporting information). At the Top, NO3− predominantly reside in fine particles, displaying a primary peak within the 0.7–1.1 µm range during non-dust period. In contrast, it mainly exists in coarse particles with a major peak spanning the 4.7–5.8 µm size range during the dust period. This result proves the enhanced effect of NO3− evaporation in the fine particles and subsequently adsorption of gaseous HNO3 onto coarse particles that contain more alkaline species [28] during the dust event. SO42− exhibits a transformation from a bimodal size distribution during non-dust period to a single coarse modal size distribution during the dust event. This alteration could be attributed to the presence of certain amounts of SO42− [29]. Cl−, Ca2+, and Mg2+ are mostly exited in coarse particles in both periods, however, their concentrations increase more than twice during the dust event. Interestingly, NH4+ exhibits a single fine modal size distribution during non-dust period, but a bimodal distribution during the dust event. The phenomena agrees well with the conclusion in previous study [28], which indicates a heterogeneous reaction of NH4NO3 on hygroscopic coarse particle surfaces during dust events [26].
The alterations in ion size distribution between the two periods at the Foot are comparatively less pronounced than that observed at the Top. For instances, both NO3− and NH4+ show single fine mode size distributions in both periods, the increases in Ca2+ and Mg2+ concentrations are relatively smaller. These results also imply that the influence of the dust event on the aerosols at ground surface is comparatively weaker than that on the free troposphere of the Guanzhong Plain. However, it is important to note that the increases of SO42− and PM in the coarse mode still prove the heightened impact of crustal materials on aerosols at the Foot during the dust event.
Acidity plays an important role in understanding the properties and reaction processes of air aerosols. The estimations of aerosol pH are exclusively applied for the samples collected at the Top. In applying ISORROPIA-Ⅱ (details are provided in Supporting information), aerosols are assumed as internally mixed, existing within a single aqueous phase, i.e., in a “metastable” condition [30]. In this study, we initially employ the “forward, metastable” parameters considering both NH3 and NH4+ concentration in ISORROPIA-Ⅱ [31]. The calculated pH values are shown in Table 1. The average pH of PM2.5 at the Top is 6.10 ± 1.29, with no obvious difference between daytime (6.02 ± 1.48) and nighttime (6.18 ± 1.43). These results substantially exceed those recorded in most ground-level regions, such as the pH of 4.3 ± 0.4 in Beijing [32], 0.94 ± 0.59 in the southeastern United States [33], and 1.25 ± 1.14 in Greece [34]. This divergence could be primarily attributed to the substantial load of dust-related compositions at the Top of Mt. Hua during the winter.
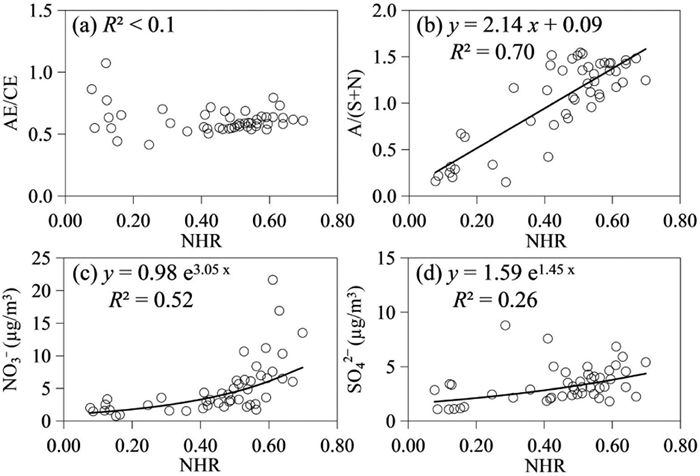
The buffering effect of ammonia plays an important role on atmospheric aerosols acidity, thus the gas-particle partitioning of ammonia is extremely important in the atmosphere [35]. The observed values of ammonium conversion ratio (NHR) at the Top are 0.447 ± 0.186 in the daytime and 0.487 ± 0.193 in the nighttime, respectively, suggesting that ammonia is comparably existed in each phase at the Top [36]. The correlation between NHR and the ratio of anion to cation equivalents (AE/CE) is found to be weak (Fig. 3). However, a markedly strong correlation is observed between NHR and the ratio of equivalent charges of NH4+ to sum of SO42− and NO3− (A/(S + N)), indicating that the gas-particle distribution of ammonia is largely governed by the charge balance of SNA. Additionally, it is noted that NHR exhibits a strong correlation with NO3− concentration, while such a correlation is not observed with SO42− concentration (Fig. 3). This observation further underscores the predominant role of NO3− in driving the gas-particle distribution of ammonia within the free troposphere region during the winter.
Figure 3
 Figure 3. Correlations of NHR with (a) AE/CE, (b) ratio of equivalent charges of NH4+ to sum of SO42− and NO3− (A/(S + N)), (c) NO3− concentration, and (d) SO42− concentration in PM2.5 at the Top.
In summary, this study encompasses concurrent observations of WSIIs in PM2.5 and size-resolved particles at the Top and Foot of Mt. Hua. The differences of mass concentrations, chemical compositions, and size distributions between the two sites all confirm that the inorganic aerosols at the alpine region are primarily transported via long distances from northwestern and northern regions. Although aerosols at the Foot were highly affected by local/regional anthropogenic emissions in Guanzhong Plain, these pollutants are difficult to vertically transport to the FT through valley breeze in daytime. The nearly neutral character of PM2.5 is mainly attributed the high loading of dust-related compositions at the Top. Moreover, NHR values unveil the predominant influence of NO3− in determining the gas-particle distribution of ammonia at the FT region during the winter.
Declaration of competing interest
The authors declare that they have no known competing financial interests or personal relationships that could have appeared to influence the work reported in this paper.
Acknowledgments
This work was supported by the program from National Natural Science Foundation of China (Nos. 42207555, 41977332), Natural Science Basic Research Program of Shaanxi (Nos. 2021JQ-971, 2022JQ-242), Open Foundation of SKLLQG (No. SKLLQGZR2101), and Strategic Priority Research Program of CAS (No. XDB40000000). Jianjun Li also acknowledged the support of the Youth Innovation Promotion Association CAS (No. 2020407).
Supplementary materials
Supplementary material associated with this article can be found, in the online version, at doi:
10.1016/j.cclet.2024.109636 .
-
-
[1]
X. Guo, Y. Wang, S. Mei, et al., J. Clean. Prod. 360 (2022) 132179. doi: 10.1016/j.jclepro.2022.132179
-
[2]
H.R. Shamsollahi, M. Yunesian, S. Kharrazi, Chemosphere 301 (2022) 134774. doi: 10.1016/j.chemosphere.2022.134774
-
[3]
G. Nan, H. Sun, Y. Zhu, Res. Environ. Sci. 31 (2018) 834–843.
-
[4]
G. Wang, H. Wang, Y. Yu, et al., Atmos. Environ. 37 (2003) 2893–2902. doi: 10.1016/S1352-2310(03)00271-1
-
[5]
X. Han, Q. Guo, C. Liu, et al., Environ. Pollut. 218 (2016) 230–241. doi: 10.1016/j.envpol.2016.06.038
-
[6]
Z. Zhao, S. Lv, Y. Zhang, et al., Environ. Sci. Pollut. R. 26 (2019) 7497–7511. doi: 10.1007/s11356-019-04205-2
-
[7]
B. Wang, Z. Tang, N. Cai, H. Niu, Urban. Clim. 35 (2021) 100742. doi: 10.1016/j.uclim.2020.100742
-
[8]
S.N. Behera, M. Sharma, Atmos. Environ. 45 (2011) 4015–4024. doi: 10.1016/j.atmosenv.2011.04.056
-
[9]
L. Xu, F. Duan, K. He, et al., Environ. Pollut. 227 (2017) 296–305. doi: 10.1016/j.envpol.2017.04.076
-
[10]
H. Guo, A.P. Sullivan, P. Campuzano-Jost, J. Geophys. Res.-Atoms. 121 (2016) 10355-310376.
-
[11]
X. Gao, L. Xue, X. Wang, et al., Sci. Total. Environ. 433 (2012) 498–506. doi: 10.1016/j.scitotenv.2012.06.095
-
[12]
S. Zhou, L. Wu, J. Guo, et al., Atmos. Chem. Phys. 20 (2020) 6435–6453. doi: 10.5194/acp-20-6435-2020
-
[13]
J. Li, G. Wang, B. Zhou, et al., Atmos. Environ. 45 (2011) 1251–1258. doi: 10.1016/j.atmosenv.2010.12.009
-
[14]
M. Fan, Y. Zhang, Y. Lin, et al., Environ. Sci. Technol. 56 (2022) 6870–6879. doi: 10.1021/acs.est.1c02843
-
[15]
B. Su, Z. Zhang, J. Tao, et al., Environ. Sci. 36 (2015) 1195–1201.
-
[16]
B. Wen, Y. Yin, Y. Qing, K. Chen, Environ. Sci. 34 (2013) 1973–1981.
-
[17]
D. Yang, H. Yu, G. Ding, S. Wang, J. Meteorol. Res. 17 (2003) 116–128.
-
[18]
S.K. Pani, C.T. Lee, C.C.K. Chou, et al., Aerosol. Air. Qual. Res. 17 (2017) 3006–3036. doi: 10.4209/aaqr.2017.03.0097
-
[19]
M. Lugauer, U. Baltensperger, M. Furger, et al., Tellus B 50 (1998) 76–92.
-
[20]
F. Marenco, P. Bonasoni, F. Calzolari, et al., J. Geophys. Res-Atoms. 111 (2006) D24202.
-
[21]
M.O. Andreae, D. Rosenfeld, Earth-Sci. Rev. 89 (2008) 13–41. doi: 10.1016/j.earscirev.2008.03.001
-
[22]
J. Li, G. Wang, Y. Ren, et al., Sci. Total. Environ. 566 (2016) 230–237.
-
[23]
C.A. Alves, C. Gonçalves, C.A. Pio, et al., Atmos. Environ. 44 (2010) 3024–3033. doi: 10.1016/j.atmosenv.2010.05.010
-
[24]
X. Zhang, J. Wang, K. Zhang, et al., J. Environ. Sci. China 114 (2022) 354–364. doi: 10.1016/j.jes.2021.09.014
-
[25]
Y. Wang, G. Zhuang, X. Zhang, et al., Atmos. Environ. 40 (2006) 2935–2952. doi: 10.1016/j.atmosenv.2005.12.051
-
[26]
R.C. Sullivan, S.A. Guazzotti, D.A. Sodeman, K.A. Prather, Atmos. Chem. Phys. 7 (2007) 1213–1236. doi: 10.5194/acp-7-1213-2007
-
[27]
G. Wang, B. Zhou, C. Cheng, et al., Atmos. Environ. 13 (2013) 819–835.
-
[28]
C. Wu, S. Zhang, G. Wang, et al., Environ. Sci. Technol. 54 (2020) 15622–15630. doi: 10.1021/acs.est.0c04544
-
[29]
F. Wu, D. Zhang, J. Cao, H. Xu, Z. An, Geophys. Res. Lett. 39 (2012) L24803.
-
[30]
R.J. Weber, H. Guo, A.G. Russell, A. Nenes, Nat. Geosci. 9 (2016) 282–285. doi: 10.1038/ngeo2665
-
[31]
C. Hennigan, J. Izumi, A. Sullivan, R. Weber, A. Nenes, Atmos. Chem. Phys. 15 (2015) 2775–2790. doi: 10.5194/acp-15-2775-2015
-
[32]
M. Liu, Y. Song, T. Zhou, et al., Geophys. Res. Lett. 44 (2017) 5213–5221. doi: 10.1002/2017GL073210
-
[33]
H. Guo, L. Xu, A. Bougiatioti, et al., Atmos. Chem. Phys. 15 (2015) 5211–5228. doi: 10.5194/acp-15-5211-2015
-
[34]
A. Bougiatioti, P. Nikolaou, I. Stavroulas, et al., Atmos. Chem. Phys. 16 (2016) 4579–4591. doi: 10.5194/acp-16-4579-2016
-
[35]
G. Zheng, H. Su, S. Wang, et al., Science 369 (2020) 1374–1377. doi: 10.1126/science.aba3719
-
[36]
G. Hu, Y. Zhang, J. Sun, et al., Atmos. Res. 145 (2014) 1–11.
-
[1]
-
Figure 2 Ternary phase diagrams of SO42−, NH4+, and NO3− molar equivalents in coarse and fine particles at the Top (a) and Foot (b). Ternary phase diagrams of SO42−, Ca2+, and NO3− molar equivalents in coarse and fine particles at the Top (c) and Foot (d).
Figure 3 Correlations of NHR with (a) AE/CE, (b) ratio of equivalent charges of NH4+ to sum of SO42− and NO3− (A/(S + N)), (c) NO3− concentration, and (d) SO42− concentration in PM2.5 at the Top.
Table 1. Mass concentration of water-insoluble inorganic ions in PM2.5 at the top and foot of Mt. Hua in winter.

 下载: 导出CSV
-

 DownLoad:


 扫一扫看文章
计量
- PDF下载量: 2
- 文章访问数: 982
- HTML全文浏览量: 81
